Self-hosted observability and operations console for Asynq task queues: live activity, grouped failures, queues, servers and periodic schedules.
TypeScript
0
46 commits
updated Oct 12, 2026

A self-hosted observability and operations console for Asynq. React, TypeScript and Vite on the frontend; Go, Chi and the Asynq Inspector on the backend. A SQLite file stores the audit log, saved views and periodic schedule links; it does not mirror tasks.
What Spool shows:
/ to search, j/k to move, Esc to close), and a detail panel with lines around, same-message filtering and copy actions.These screenshots use Spool's demo worker with sample tasks and show both dark and light themes.
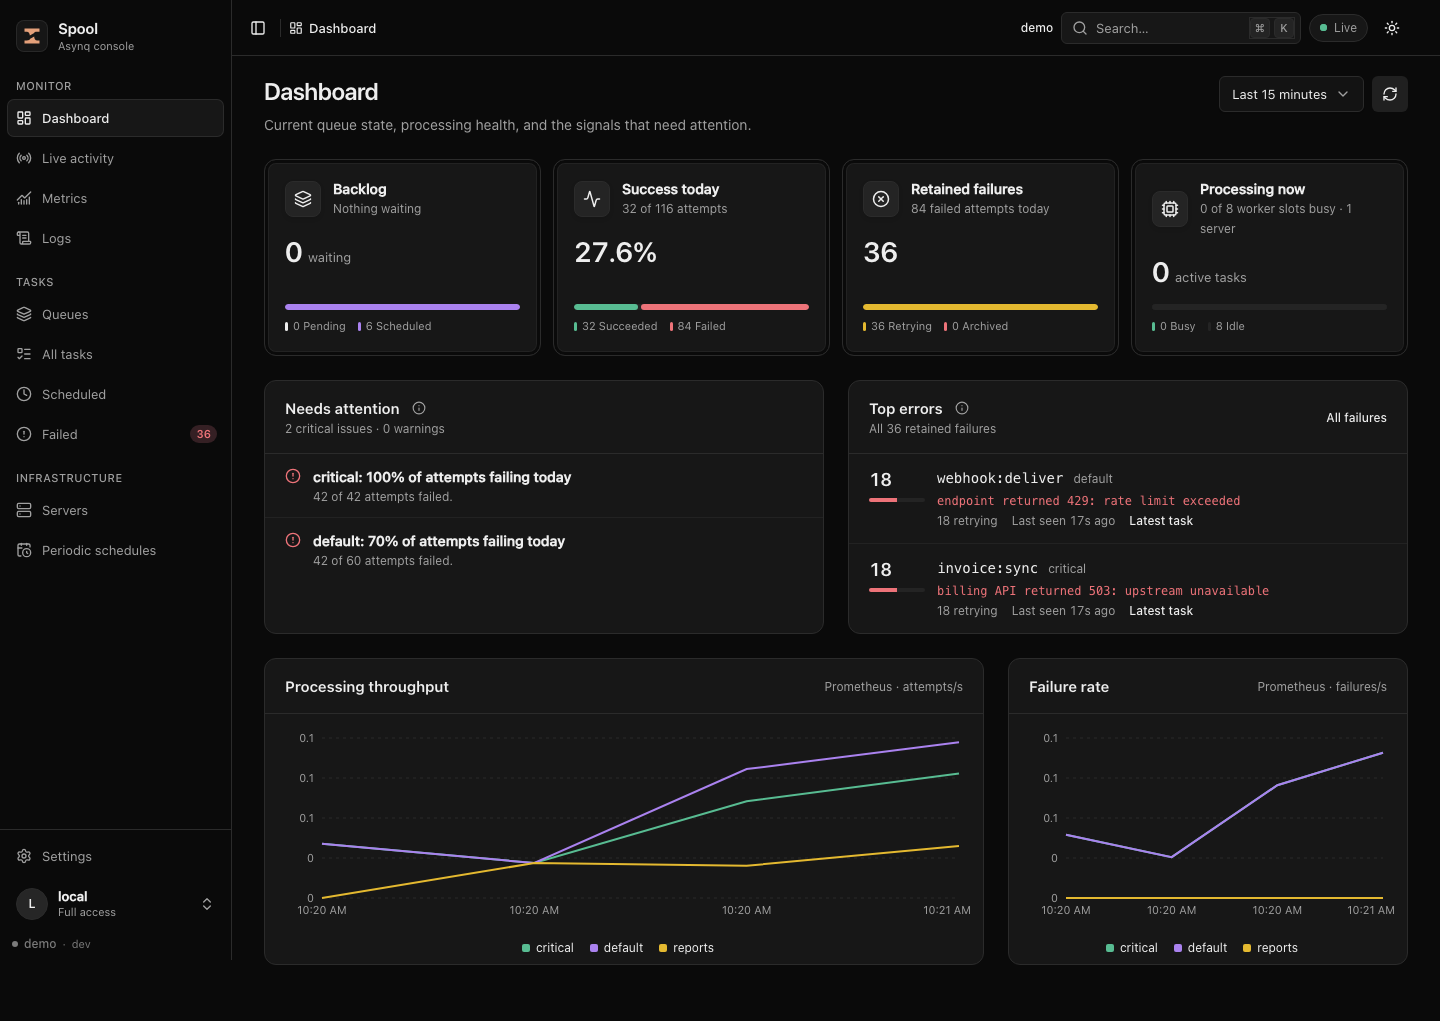
Dashboard — spot queue health issues, busy workers and recurring errors at a glance.
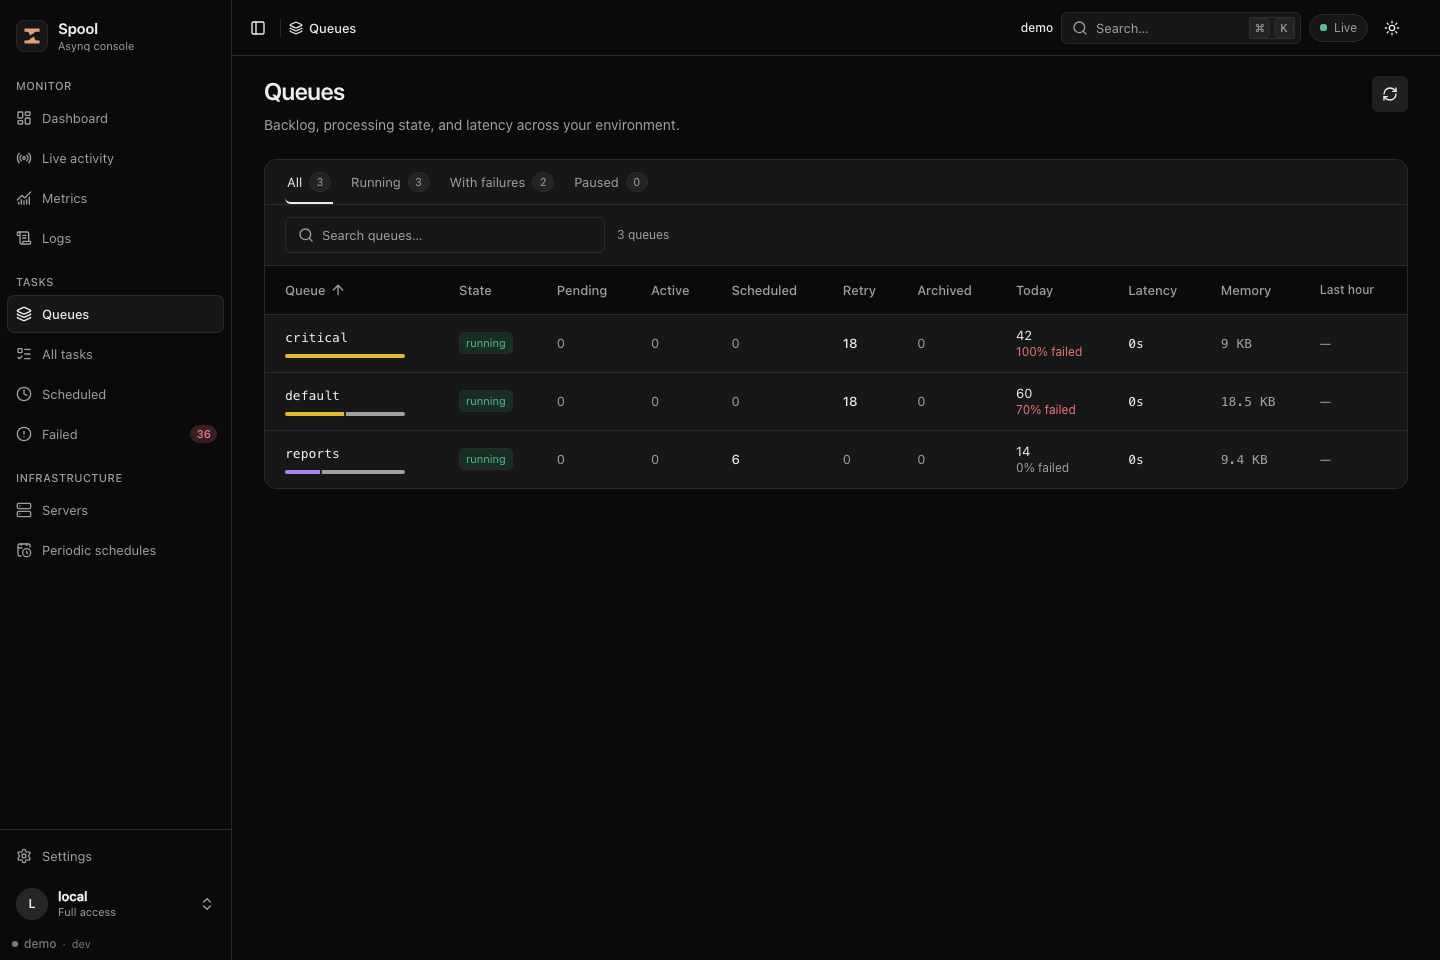
Queues — compare backlog, processing state, retries, latency and failures across queues.
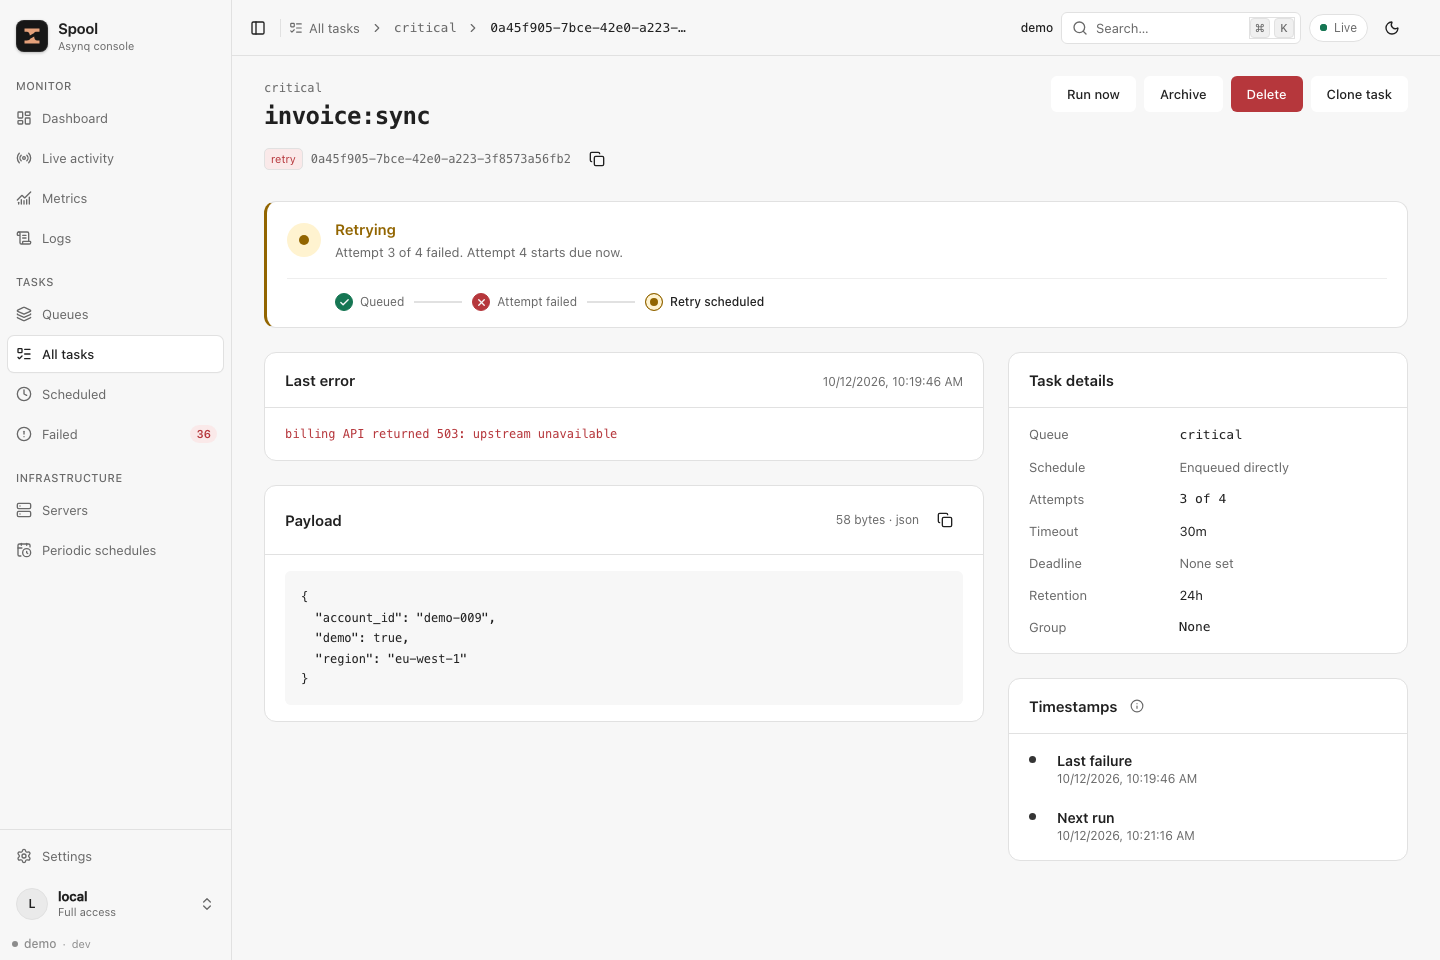
Task inspection — inspect the payload, last error and retry timing, then run, archive, delete or clone a task.
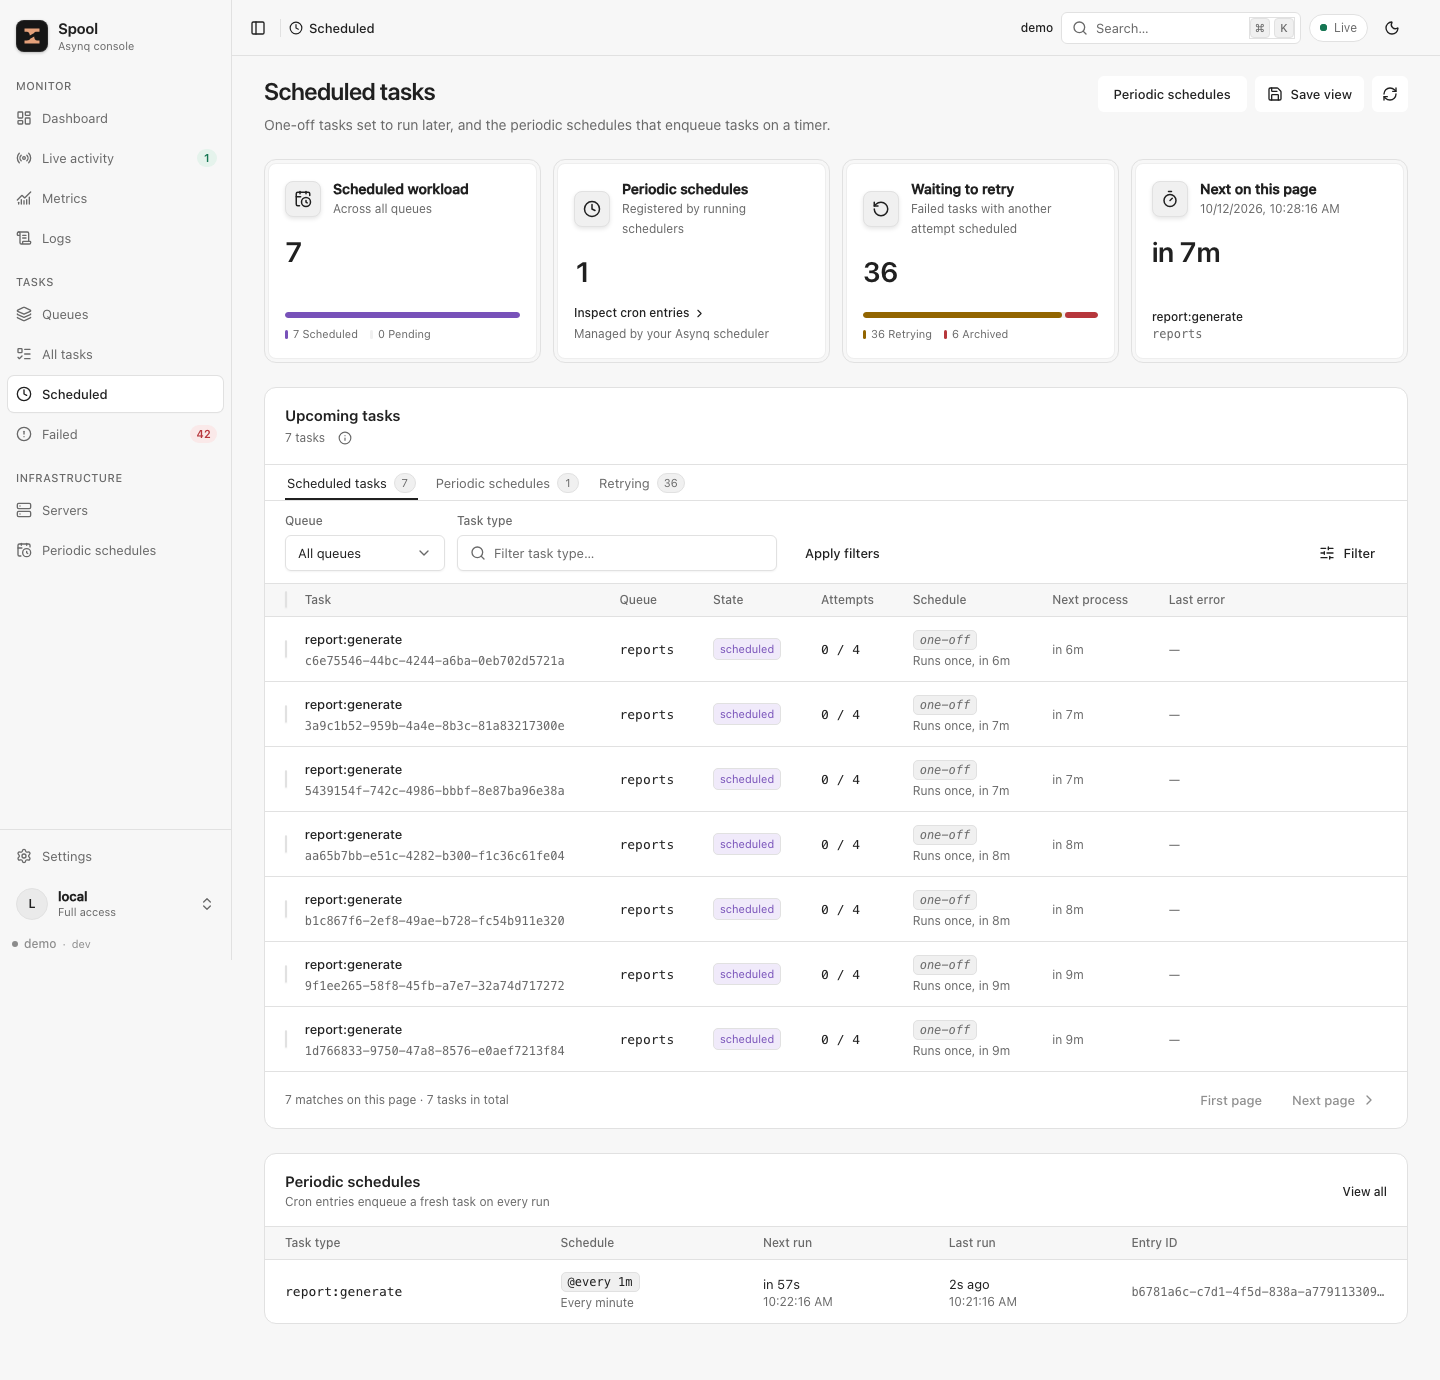
Scheduled tasks — see upcoming jobs, retry workload and the periodic schedules that enqueue them.
Have the Redis connection URL used by your Asynq workers ready, including its database index. With Docker, a Compose plugin supporting up --wait, Bash and OpenSSL installed:
git clone https://github.com/nanaaikinson/spool.git
cd spool
./scripts/install.sh
The terminal wizard asks for your Redis URL, administrator username, local port and console URL. It keeps Spool's SQLite database in a persistent volume and bundles Prometheus by default; choose external Prometheus if you already operate one. It generates separate administrator and session secrets, builds the frontend and backend inside Docker, then waits for Redis and database readiness and checks metrics connectivity. Local Go, Node and pnpm installations are unnecessary.
Open the console URL you chose (default http://localhost:8003) and sign in using SPOOL_ADMIN_USER and SPOOL_ADMIN_PASSWORD from .env.installation. That file has owner-only permissions and also records the selected Compose files and project name. Rerunning the installer preserves it and reuses the same persistent volumes.
To prepare configuration before starting, run ./scripts/install.sh --configure-only. Use --env-file PATH for a custom configuration location and pass the same path on reruns. make self-host runs the default installer; make install installs frontend development dependencies.
The app is published on loopback only; bundled Prometheus has no published host ports. Local HTTP access works directly or through an SSH tunnel. For remote browser access, choose an HTTPS URL and configure your reverse proxy, certificates and DNS. The installer enables secure cookies for HTTPS but does not provision the proxy.
See the deployment guide for upgrades, backups, connection changes, and manual Compose deployments.
Settings shows Redis, database and metrics collection checks. Set SPOOL_INSTANCE_NAME and SPOOL_SUPPORT_URL at runtime to identify the instance and provide a public support contact; these appear before sign-in. See runtime metadata.
Spool connects to the Redis your Asynq workers already use. It doesn't replace your workers or need their code. The quickest way to try it is the published image with a Redis URL and an account (Spool always requires sign-in when it listens beyond localhost, as it does in a container):
docker run --rm -p 127.0.0.1:8003:8003 \
  -e REDIS_URL='redis://:PASSWORD@redis.internal:6379/0' \
  -e SPOOL_ADMIN_USER=admin -e SPOOL_ADMIN_PASSWORD='choose-a-long-password' \
  -e SPOOL_SESSION_KEY="$(openssl rand -hex 32)" \
  ghcr.io/nanaaikinson/spool:latest
Open http://127.0.0.1:8003 and sign in. Without a database Spool runs read-only: everything is visible, but pausing queues and acting on tasks are off. Mount a volume and set DATABASE_PATH to a SQLite file on it to turn on actions, the audit log, saved views and schedule links:
docker run -d --name spool -p 127.0.0.1:8003:8003 \
  -v spool-data:/data -e DATABASE_PATH=/data/spool.db \
  -e REDIS_URL='rediss://spool:PASSWORD@redis.internal:6380/0' \
  -e SPOOL_ADMIN_USER=admin -e SPOOL_ADMIN_PASSWORD='choose-a-long-password' \
  -e SPOOL_SESSION_KEY="$(openssl rand -hex 32)" \
  ghcr.io/nanaaikinson/spool:latest
docker logs spool   # reports whether it reached Redis and found your queues
Images are published for linux/amd64 and linux/arm64. Pin a version tag such as 0.1.0 in production. The deployment guide covers Compose, HTTPS and Prometheus.
redis://host:6379/2 reads database 2. If Spool starts but shows no queues, its log says so; the database number is the usual cause.redis:// (plain), rediss:// (TLS), redis-sentinel://:password@host1:26379,host2:26379/0?master=NAME (Sentinel; add &sentinel_password=… if the Sentinels use a different password from Redis), and redis-socket://:password@/path/to/redis.sock?db=0 (Unix socket). Usernames for Redis ACLs go before the password: rediss://spool:PASSWORD@host:6380/0. Percent-encode special characters in credentials.REDIS_TLS_CA_FILE, and REDIS_TLS_CERT_FILE plus REDIS_TLS_KEY_FILE for mutual TLS. These apply to rediss:// and redis-sentinel:// URLs.asynq:* keys and Lua scripting, as Asynq's own Inspector does; pausing queues and acting on tasks need write access. For people who only need to look, use a viewer account or SPOOL_READ_ONLY=true.localhost is the Spool container itself. Use a hostname your Redis is reachable at from there.Spool is built and tested against Asynq v0.26. It reads Asynq's data in Redis directly through Asynq's Inspector, so workers on other Asynq versions may store data Spool can't read. Please report incompatibilities with your worker version.
Requires Go 1.27+, Node 24+, pnpm 10.33 (pinned in apps/web/package.json), and Docker Compose. Air is optional: make dev uses it for live reload when installed and falls back to go run otherwise. With Corepack, run corepack enable once; the Makefile runs pnpm inside apps/web so Corepack picks the pinned version.
cp .env.example .env
make install
make infra
make run-dev
make run-dev runs the Go server and Vite together in one terminal; press Ctrl+C to stop both. Run them separately with make dev and make web. Environment overrides such as REDIS_URL=redis://YOUR_REDIS_HOST:6379/0 make run-dev apply to both.
Open http://127.0.0.1:5173. To generate realistic traffic in the dedicated local Redis container, use another terminal:
REDIS_URL=redis://127.0.0.1:6388/0 make demo
The demo runs an Asynq server and enqueues successful emails, slow reports, scheduled reports, billing failures and webhook retries that eventually archive. It also registers a periodic schedule. Stop it with Ctrl+C. Always point the demo at a dedicated Redis database, never at production; it refuses to start without an explicit REDIS_URL.
Local infrastructure ports are Redis 6388, Prometheus 9098 and the API 8088; the development database is tmp/spool.db. Connections use explicit IPv4 loopback addresses to avoid unrelated services listening on localhost. Set different ports and URLs if these are occupied. make down stops this project's infrastructure without deleting its volumes.
docker compose up --build -d
# Optional synthetic traffic, in this project's Redis container:
docker compose --profile demo up -d demo
Open http://127.0.0.1:8088. The development Compose account is admin / spool-local. Compose runs all infrastructure plus a non-root Go container that serves the built UI. Its example passwords and signing key are for local evaluation; set real secrets for production. The Prometheus scrape file targets host.docker.internal:8088, which works for both native development and the published application container port. Inside a production network, use the application's service name and internal port.
The guided installer manages configuration on your Docker host. For manual deployments, use compose.production.redis.yaml with credentials copied from .env.production.redis.example. It builds the root Dockerfile, requires production credentials, keeps the SQLite database in the spool-data volume, and exposes port 8003 only to the container network. The optional host override publishes it on loopback for a host-installed HTTPS proxy.
Add the Prometheus override to bundle private metrics storage. It scrapes app:8003 and retains 15 days of history in a persistent volume. The guided installer includes it unless you choose external Prometheus.
See the production deployment guide for exact commands, Dockerfile-only deployment, connection URLs, HTTPS, metrics routing, and persistent storage.
The Go server reads configuration at startup. It loads .env from its working directory when present without overriding process environment variables. The guided installer passes .env.installation through Compose; the server does not load that file directly. The frontend build does not need Redis or Prometheus credentials, and infrastructure URLs never reach the browser.
| Configuration file | Used by | Purpose |
|---|---|---|
.env (copy .env.example) | Native development server | Local development connections and settings |
.env.installation (generated) | Guided installer and its Compose stack | Saved service choices, credentials, access settings and project identity |
.env.production (copy the production template) | Manual Compose or docker run | User-supplied production settings; use the parser rules in the deployment guide |
The defaults below are for the standalone Go server. The installer provisions the database volume and Prometheus and supplies their settings. Missing settings on a standalone deployment do not automatically create those services. Change runtime settings in the appropriate file and redeploy.
| Variable | Purpose | Default |
|---|---|---|
SPOOL_ADDR | HTTP listen address | 127.0.0.1:8088 |
REDIS_URL | Asynq connection URI, including DB index | redis://127.0.0.1:6388/0 |
DATABASE_PATH | SQLite file for the audit log, saved views, schedule links and server logs, created with its directory if missing; without it Spool is read-only | unset |
REDIS_TLS_CA_FILE | PEM file with the CA that signed your Redis server certificate | unset |
REDIS_TLS_CERT_FILE, REDIS_TLS_KEY_FILE | Client certificate and key for Redis mutual TLS | unset |
PROMETHEUS_URL | Prometheus base URL, with optional URI credentials | unset |
SPOOL_ENV | Environment label | development |
SPOOL_STATIC_DIR | Compiled frontend directory | apps/web/dist |
SPOOL_READ_ONLY | Disable all changes, even for the admin account | false |
SPOOL_ADMIN_USER, SPOOL_ADMIN_PASSWORD | Operations account | unset |
SPOOL_VIEWER_USER, SPOOL_VIEWER_PASSWORD | Read-only account | unset |
SPOOL_SESSION_KEY | Session signing secret; at least 32 characters when accounts are set | unset |
SPOOL_SECURE_COOKIE | HTTPS-only session cookie | false |
SPOOL_LOG_RETENTION | How long the Logs page keeps Spool's own log lines, such as 3d or 36h (1h to 365d) | 3d |
SPOOL_INSTANCE_NAME | Public instance name shown before sign-in, at most 80 characters | SPOOL_ENV |
SPOOL_SUPPORT_URL | Public HTTPS or mailto support link shown before sign-in | unset |
SPOOL_METRICS_JOB | Prometheus scrape job checked by Settings diagnostics | spool |
SPOOL_METRICS_TOKEN | Bearer token required on /metrics; at least 32 characters, no whitespace | unset |
Accounts are required when SPOOL_ADDR is not a loopback address. Use long random account passwords and a random signing secret. For remote access, use TLS termination and SPOOL_SECURE_COOKIE=true; the installer's localhost HTTP option uses false. Protect Redis with its own network and credentials, and the database file with filesystem permissions. Expose /metrics only to the monitoring network; exclude it from public ingress. Stateless signed sessions expire after 12 hours. Changing the signing key revokes all sessions; logout deletes the browser cookie. Spool supports a configured admin and viewer account, not a multi-user identity-management system.
Without a database, Spool runs read-only and says so in a banner: every change is refused before it reaches Redis, saved views and the audit log are unavailable, and task-to-schedule links last only as long as Asynq keeps its enqueue history. Migrations run at startup. Run one Spool instance per database file, on local storage rather than a network filesystem. Each change is written to the audit log as pending before the Redis action and marked succeeded or failed afterward, so a record left pending (for example after a crash) means the outcome is unknown. Payloads are never stored in the audit log. Back up the database file and retain audit records as your deployment requires; see backups.
/health checks the running process; /ready checks Redis and, when configured, the database. Prometheus is optional and does not block server readiness; the installer performs its own metrics check after starting services. Structured logs include the calling file and line, request IDs, route templates, statuses and timings. With a database, Spool's own log lines (not the per-request lines) are also kept for SPOOL_LOG_RETENTION, removed hourly, and shown to the administrator account on the Logs page. /metrics exports native Asynq metrics, Go/process metrics, spool_http_request_duration_seconds and spool_log_events_total by level.
Task lists read a single Asynq page per request, with at most 100 tasks. Type, minimum retry and failure-time filters apply to that page; use the next cursor even when a filtered page is empty. Queue plus exact task ID performs a direct lookup. State totals are before page filters. There is no Redis-wide payload scan. Aggregating tasks require a group name and are excluded from unscoped collections. Changing task state while paging can shift records, as with Asynq's own page APIs.
Queue priority is configured per server, so it appears on the Servers page. Processed counters include failed attempts. Success rate subtracts failures from processed attempts. Stored completed task counts are distinct from processed totals. Native asynq_tasks_enqueued_total is a state gauge despite its name; Spool does not present it as cumulative enqueue throughput.
Task details display only retained timestamps, the last error and retry count. The Asynq Inspector does not expose a full attempt history or enqueue, creation or heartbeat timestamps. Orphaned tasks use Asynq's explicit orphan indication. Cancel is best effort: it requires exactly one running worker for the task and sends Asynq's cancellation signal. Clone creates a new task with explicit queue/type/payload/retry settings and 24-hour retention; it does not restore the original uniqueness or scheduling options. Binary and truncated payloads cannot be cloned from their displayed form. Payload/result display is bounded at 256 KiB; binary data is base64.
Historical charts use Prometheus range queries against the Asynq metrics collector and refresh every minute while visible, or every 15 seconds in live mode. The API allows a fixed metric set, ranges up to seven days and at most 1500 points per series. Spool does not fabricate history it never recorded. A single server-sent events (SSE) broker tells the UI to refetch every 15 seconds and immediately after each change; the broker itself does not poll Redis.
Run make on its own to list every target.
make api-client    # Generate and validate OpenAPI, then generate Hey API client/query helpers
make api-check     # Regenerate and compare the canonical contract and committed client
make lint          # go vet, ESLint, TypeScript
make test          # Backend and frontend unit tests
make build         # Build the web UI and the Go server and demo binaries
make image         # Build the Docker image locally, tagged spool:VERSION
make e2e           # Build the web UI and run the Playwright browser tests
make test-install  # Installer and Compose checks; Python 3 + Docker Compose, no running containers
(cd apps/web && pnpm exec prettier --write src e2e '*.ts')
Store tests use a temporary SQLite file. Real Redis integration tests use an explicitly configured isolated database:
SPOOL_TEST_REDIS=redis://127.0.0.1:6388/15 go test -race ./internal/...

(cd apps/web && pnpm exec playwright install chromium)
make e2e
Playwright seeds only the spool-e2e queue in Redis database 15, starts isolated API instances on ports 8188/8189 and Vite on 5188, then tests themes, persistence, queue status tabs, task navigation, scheduled summaries, advanced filters, archive/retry, failures, a command palette, non-JSON payloads, mobile layout, session roles, the administrator-only Logs page (search, line detail, viewer restriction) and saved-view creation/restoration/deletion. It also verifies shadcn Select keyboard navigation, filter restoration and validation, Checkbox selection, confirmation cancellation, clone forms and the mobile Sidebar/Sheet. It saves screenshots in apps/web/test-results. The CI workflow runs generation checks, lint/types, tests, builds and these essential browser workflows. Avoid parallel test suites sharing the same fixture queue.
Generated code lives in apps/web/src/api/generated and is disposable. Change domain DTOs and the endpoint registry in internal/api/contract.go, then regenerate. Do not edit or format generated files. TypeScript 6 is pinned because Hey API currently requires its JavaScript compiler API; TypeScript 7 is not compatible with this generator version.
See architecture and data provenance and interface design. The backend uses Chandlery's environment and Zog error helpers and db.Repository[*Model] for audit log and saved-view reads and writes, with Bun for migrations, audit finalization, schedule links and server logs. Pages are TanStack Router file routes in apps/web/src/routes.
Upstream references: Asynq Inspector, native metrics collector, Chandlery, Bun, Zog, Hey API, TanStack Router, TanStack Query.
Self-hosted observability and operations console for Asynq task queues: live activity, grouped failures, queues, servers and periodic schedules.
TypeScript
0
46 commits
updated Oct 12, 2026
A self-hosted observability and operations console for Asynq. React, TypeScript and Vite on the frontend; Go, Chi and the Asynq Inspector on the backend. A SQLite file stores the audit log, saved views and periodic schedule links; it does not mirror tasks.
What Spool shows:
/ to search, j/k to move, Esc to close), and a detail panel with lines around, same-message filtering and copy actions.These screenshots use Spool's demo worker with sample tasks and show both dark and light themes.
Dashboard — spot queue health issues, busy workers and recurring errors at a glance.
Queues — compare backlog, processing state, retries, latency and failures across queues.
Task inspection — inspect the payload, last error and retry timing, then run, archive, delete or clone a task.
Scheduled tasks — see upcoming jobs, retry workload and the periodic schedules that enqueue them.
Have the Redis connection URL used by your Asynq workers ready, including its database index. With Docker, a Compose plugin supporting up --wait, Bash and OpenSSL installed:
git clone https://github.com/nanaaikinson/spool.git
cd spool
./scripts/install.sh
The terminal wizard asks for your Redis URL, administrator username, local port and console URL. It keeps Spool's SQLite database in a persistent volume and bundles Prometheus by default; choose external Prometheus if you already operate one. It generates separate administrator and session secrets, builds the frontend and backend inside Docker, then waits for Redis and database readiness and checks metrics connectivity. Local Go, Node and pnpm installations are unnecessary.
Open the console URL you chose (default http://localhost:8003) and sign in using SPOOL_ADMIN_USER and SPOOL_ADMIN_PASSWORD from .env.installation. That file has owner-only permissions and also records the selected Compose files and project name. Rerunning the installer preserves it and reuses the same persistent volumes.
To prepare configuration before starting, run ./scripts/install.sh --configure-only. Use --env-file PATH for a custom configuration location and pass the same path on reruns. make self-host runs the default installer; make install installs frontend development dependencies.
The app is published on loopback only; bundled Prometheus has no published host ports. Local HTTP access works directly or through an SSH tunnel. For remote browser access, choose an HTTPS URL and configure your reverse proxy, certificates and DNS. The installer enables secure cookies for HTTPS but does not provision the proxy.
See the deployment guide for upgrades, backups, connection changes, and manual Compose deployments.
Settings shows Redis, database and metrics collection checks. Set SPOOL_INSTANCE_NAME and SPOOL_SUPPORT_URL at runtime to identify the instance and provide a public support contact; these appear before sign-in. See runtime metadata.
Spool connects to the Redis your Asynq workers already use. It doesn't replace your workers or need their code. The quickest way to try it is the published image with a Redis URL and an account (Spool always requires sign-in when it listens beyond localhost, as it does in a container):
docker run --rm -p 127.0.0.1:8003:8003 \
  -e REDIS_URL='redis://:PASSWORD@redis.internal:6379/0' \
  -e SPOOL_ADMIN_USER=admin -e SPOOL_ADMIN_PASSWORD='choose-a-long-password' \
  -e SPOOL_SESSION_KEY="$(openssl rand -hex 32)" \
  ghcr.io/nanaaikinson/spool:latest
Open http://127.0.0.1:8003 and sign in. Without a database Spool runs read-only: everything is visible, but pausing queues and acting on tasks are off. Mount a volume and set DATABASE_PATH to a SQLite file on it to turn on actions, the audit log, saved views and schedule links:
docker run -d --name spool -p 127.0.0.1:8003:8003 \
  -v spool-data:/data -e DATABASE_PATH=/data/spool.db \
  -e REDIS_URL='rediss://spool:PASSWORD@redis.internal:6380/0' \
  -e SPOOL_ADMIN_USER=admin -e SPOOL_ADMIN_PASSWORD='choose-a-long-password' \
  -e SPOOL_SESSION_KEY="$(openssl rand -hex 32)" \
  ghcr.io/nanaaikinson/spool:latest
docker logs spool   # reports whether it reached Redis and found your queues
Images are published for linux/amd64 and linux/arm64. Pin a version tag such as 0.1.0 in production. The deployment guide covers Compose, HTTPS and Prometheus.
redis://host:6379/2 reads database 2. If Spool starts but shows no queues, its log says so; the database number is the usual cause.redis:// (plain), rediss:// (TLS), redis-sentinel://:password@host1:26379,host2:26379/0?master=NAME (Sentinel; add &sentinel_password=… if the Sentinels use a different password from Redis), and redis-socket://:password@/path/to/redis.sock?db=0 (Unix socket). Usernames for Redis ACLs go before the password: rediss://spool:PASSWORD@host:6380/0. Percent-encode special characters in credentials.REDIS_TLS_CA_FILE, and REDIS_TLS_CERT_FILE plus REDIS_TLS_KEY_FILE for mutual TLS. These apply to rediss:// and redis-sentinel:// URLs.asynq:* keys and Lua scripting, as Asynq's own Inspector does; pausing queues and acting on tasks need write access. For people who only need to look, use a viewer account or SPOOL_READ_ONLY=true.localhost is the Spool container itself. Use a hostname your Redis is reachable at from there.Spool is built and tested against Asynq v0.26. It reads Asynq's data in Redis directly through Asynq's Inspector, so workers on other Asynq versions may store data Spool can't read. Please report incompatibilities with your worker version.
Requires Go 1.27+, Node 24+, pnpm 10.33 (pinned in apps/web/package.json), and Docker Compose. Air is optional: make dev uses it for live reload when installed and falls back to go run otherwise. With Corepack, run corepack enable once; the Makefile runs pnpm inside apps/web so Corepack picks the pinned version.
cp .env.example .env
make install
make infra
make run-dev
make run-dev runs the Go server and Vite together in one terminal; press Ctrl+C to stop both. Run them separately with make dev and make web. Environment overrides such as REDIS_URL=redis://YOUR_REDIS_HOST:6379/0 make run-dev apply to both.
Open http://127.0.0.1:5173. To generate realistic traffic in the dedicated local Redis container, use another terminal:
REDIS_URL=redis://127.0.0.1:6388/0 make demo
The demo runs an Asynq server and enqueues successful emails, slow reports, scheduled reports, billing failures and webhook retries that eventually archive. It also registers a periodic schedule. Stop it with Ctrl+C. Always point the demo at a dedicated Redis database, never at production; it refuses to start without an explicit REDIS_URL.
Local infrastructure ports are Redis 6388, Prometheus 9098 and the API 8088; the development database is tmp/spool.db. Connections use explicit IPv4 loopback addresses to avoid unrelated services listening on localhost. Set different ports and URLs if these are occupied. make down stops this project's infrastructure without deleting its volumes.
docker compose up --build -d
# Optional synthetic traffic, in this project's Redis container:
docker compose --profile demo up -d demo
Open http://127.0.0.1:8088. The development Compose account is admin / spool-local. Compose runs all infrastructure plus a non-root Go container that serves the built UI. Its example passwords and signing key are for local evaluation; set real secrets for production. The Prometheus scrape file targets host.docker.internal:8088, which works for both native development and the published application container port. Inside a production network, use the application's service name and internal port.
The guided installer manages configuration on your Docker host. For manual deployments, use compose.production.redis.yaml with credentials copied from .env.production.redis.example. It builds the root Dockerfile, requires production credentials, keeps the SQLite database in the spool-data volume, and exposes port 8003 only to the container network. The optional host override publishes it on loopback for a host-installed HTTPS proxy.
Add the Prometheus override to bundle private metrics storage. It scrapes app:8003 and retains 15 days of history in a persistent volume. The guided installer includes it unless you choose external Prometheus.
See the production deployment guide for exact commands, Dockerfile-only deployment, connection URLs, HTTPS, metrics routing, and persistent storage.
The Go server reads configuration at startup. It loads .env from its working directory when present without overriding process environment variables. The guided installer passes .env.installation through Compose; the server does not load that file directly. The frontend build does not need Redis or Prometheus credentials, and infrastructure URLs never reach the browser.
| Configuration file | Used by | Purpose |
|---|---|---|
.env (copy .env.example) | Native development server | Local development connections and settings |
.env.installation (generated) | Guided installer and its Compose stack | Saved service choices, credentials, access settings and project identity |
.env.production (copy the production template) | Manual Compose or docker run | User-supplied production settings; use the parser rules in the deployment guide |
The defaults below are for the standalone Go server. The installer provisions the database volume and Prometheus and supplies their settings. Missing settings on a standalone deployment do not automatically create those services. Change runtime settings in the appropriate file and redeploy.
| Variable | Purpose | Default |
|---|---|---|
SPOOL_ADDR | HTTP listen address | 127.0.0.1:8088 |
REDIS_URL | Asynq connection URI, including DB index | redis://127.0.0.1:6388/0 |
DATABASE_PATH | SQLite file for the audit log, saved views, schedule links and server logs, created with its directory if missing; without it Spool is read-only | unset |
REDIS_TLS_CA_FILE | PEM file with the CA that signed your Redis server certificate | unset |
REDIS_TLS_CERT_FILE, REDIS_TLS_KEY_FILE | Client certificate and key for Redis mutual TLS | unset |
PROMETHEUS_URL | Prometheus base URL, with optional URI credentials | unset |
SPOOL_ENV | Environment label | development |
SPOOL_STATIC_DIR | Compiled frontend directory | apps/web/dist |
SPOOL_READ_ONLY | Disable all changes, even for the admin account | false |
SPOOL_ADMIN_USER, SPOOL_ADMIN_PASSWORD | Operations account | unset |
SPOOL_VIEWER_USER, SPOOL_VIEWER_PASSWORD | Read-only account | unset |
SPOOL_SESSION_KEY | Session signing secret; at least 32 characters when accounts are set | unset |
SPOOL_SECURE_COOKIE | HTTPS-only session cookie | false |
SPOOL_LOG_RETENTION | How long the Logs page keeps Spool's own log lines, such as 3d or 36h (1h to 365d) | 3d |
SPOOL_INSTANCE_NAME | Public instance name shown before sign-in, at most 80 characters | SPOOL_ENV |
SPOOL_SUPPORT_URL | Public HTTPS or mailto support link shown before sign-in | unset |
SPOOL_METRICS_JOB | Prometheus scrape job checked by Settings diagnostics | spool |
SPOOL_METRICS_TOKEN | Bearer token required on /metrics; at least 32 characters, no whitespace | unset |
Accounts are required when SPOOL_ADDR is not a loopback address. Use long random account passwords and a random signing secret. For remote access, use TLS termination and SPOOL_SECURE_COOKIE=true; the installer's localhost HTTP option uses false. Protect Redis with its own network and credentials, and the database file with filesystem permissions. Expose /metrics only to the monitoring network; exclude it from public ingress. Stateless signed sessions expire after 12 hours. Changing the signing key revokes all sessions; logout deletes the browser cookie. Spool supports a configured admin and viewer account, not a multi-user identity-management system.
Without a database, Spool runs read-only and says so in a banner: every change is refused before it reaches Redis, saved views and the audit log are unavailable, and task-to-schedule links last only as long as Asynq keeps its enqueue history. Migrations run at startup. Run one Spool instance per database file, on local storage rather than a network filesystem. Each change is written to the audit log as pending before the Redis action and marked succeeded or failed afterward, so a record left pending (for example after a crash) means the outcome is unknown. Payloads are never stored in the audit log. Back up the database file and retain audit records as your deployment requires; see backups.
/health checks the running process; /ready checks Redis and, when configured, the database. Prometheus is optional and does not block server readiness; the installer performs its own metrics check after starting services. Structured logs include the calling file and line, request IDs, route templates, statuses and timings. With a database, Spool's own log lines (not the per-request lines) are also kept for SPOOL_LOG_RETENTION, removed hourly, and shown to the administrator account on the Logs page. /metrics exports native Asynq metrics, Go/process metrics, spool_http_request_duration_seconds and spool_log_events_total by level.
Task lists read a single Asynq page per request, with at most 100 tasks. Type, minimum retry and failure-time filters apply to that page; use the next cursor even when a filtered page is empty. Queue plus exact task ID performs a direct lookup. State totals are before page filters. There is no Redis-wide payload scan. Aggregating tasks require a group name and are excluded from unscoped collections. Changing task state while paging can shift records, as with Asynq's own page APIs.
Queue priority is configured per server, so it appears on the Servers page. Processed counters include failed attempts. Success rate subtracts failures from processed attempts. Stored completed task counts are distinct from processed totals. Native asynq_tasks_enqueued_total is a state gauge despite its name; Spool does not present it as cumulative enqueue throughput.
Task details display only retained timestamps, the last error and retry count. The Asynq Inspector does not expose a full attempt history or enqueue, creation or heartbeat timestamps. Orphaned tasks use Asynq's explicit orphan indication. Cancel is best effort: it requires exactly one running worker for the task and sends Asynq's cancellation signal. Clone creates a new task with explicit queue/type/payload/retry settings and 24-hour retention; it does not restore the original uniqueness or scheduling options. Binary and truncated payloads cannot be cloned from their displayed form. Payload/result display is bounded at 256 KiB; binary data is base64.
Historical charts use Prometheus range queries against the Asynq metrics collector and refresh every minute while visible, or every 15 seconds in live mode. The API allows a fixed metric set, ranges up to seven days and at most 1500 points per series. Spool does not fabricate history it never recorded. A single server-sent events (SSE) broker tells the UI to refetch every 15 seconds and immediately after each change; the broker itself does not poll Redis.
Run make on its own to list every target.
make api-client    # Generate and validate OpenAPI, then generate Hey API client/query helpers
make api-check     # Regenerate and compare the canonical contract and committed client
make lint          # go vet, ESLint, TypeScript
make test          # Backend and frontend unit tests
make build         # Build the web UI and the Go server and demo binaries
make image         # Build the Docker image locally, tagged spool:VERSION
make e2e           # Build the web UI and run the Playwright browser tests
make test-install  # Installer and Compose checks; Python 3 + Docker Compose, no running containers
(cd apps/web && pnpm exec prettier --write src e2e '*.ts')
Store tests use a temporary SQLite file. Real Redis integration tests use an explicitly configured isolated database:
SPOOL_TEST_REDIS=redis://127.0.0.1:6388/15 go test -race ./internal/...

(cd apps/web && pnpm exec playwright install chromium)
make e2e
Playwright seeds only the spool-e2e queue in Redis database 15, starts isolated API instances on ports 8188/8189 and Vite on 5188, then tests themes, persistence, queue status tabs, task navigation, scheduled summaries, advanced filters, archive/retry, failures, a command palette, non-JSON payloads, mobile layout, session roles, the administrator-only Logs page (search, line detail, viewer restriction) and saved-view creation/restoration/deletion. It also verifies shadcn Select keyboard navigation, filter restoration and validation, Checkbox selection, confirmation cancellation, clone forms and the mobile Sidebar/Sheet. It saves screenshots in apps/web/test-results. The CI workflow runs generation checks, lint/types, tests, builds and these essential browser workflows. Avoid parallel test suites sharing the same fixture queue.
Generated code lives in apps/web/src/api/generated and is disposable. Change domain DTOs and the endpoint registry in internal/api/contract.go, then regenerate. Do not edit or format generated files. TypeScript 6 is pinned because Hey API currently requires its JavaScript compiler API; TypeScript 7 is not compatible with this generator version.
See architecture and data provenance and interface design. The backend uses Chandlery's environment and Zog error helpers and db.Repository[*Model] for audit log and saved-view reads and writes, with Bun for migrations, audit finalization, schedule links and server logs. Pages are TanStack Router file routes in apps/web/src/routes.
Upstream references: Asynq Inspector, native metrics collector, Chandlery, Bun, Zog, Hey API, TanStack Router, TanStack Query.



