
See what people are saying (1)
README
StatShed


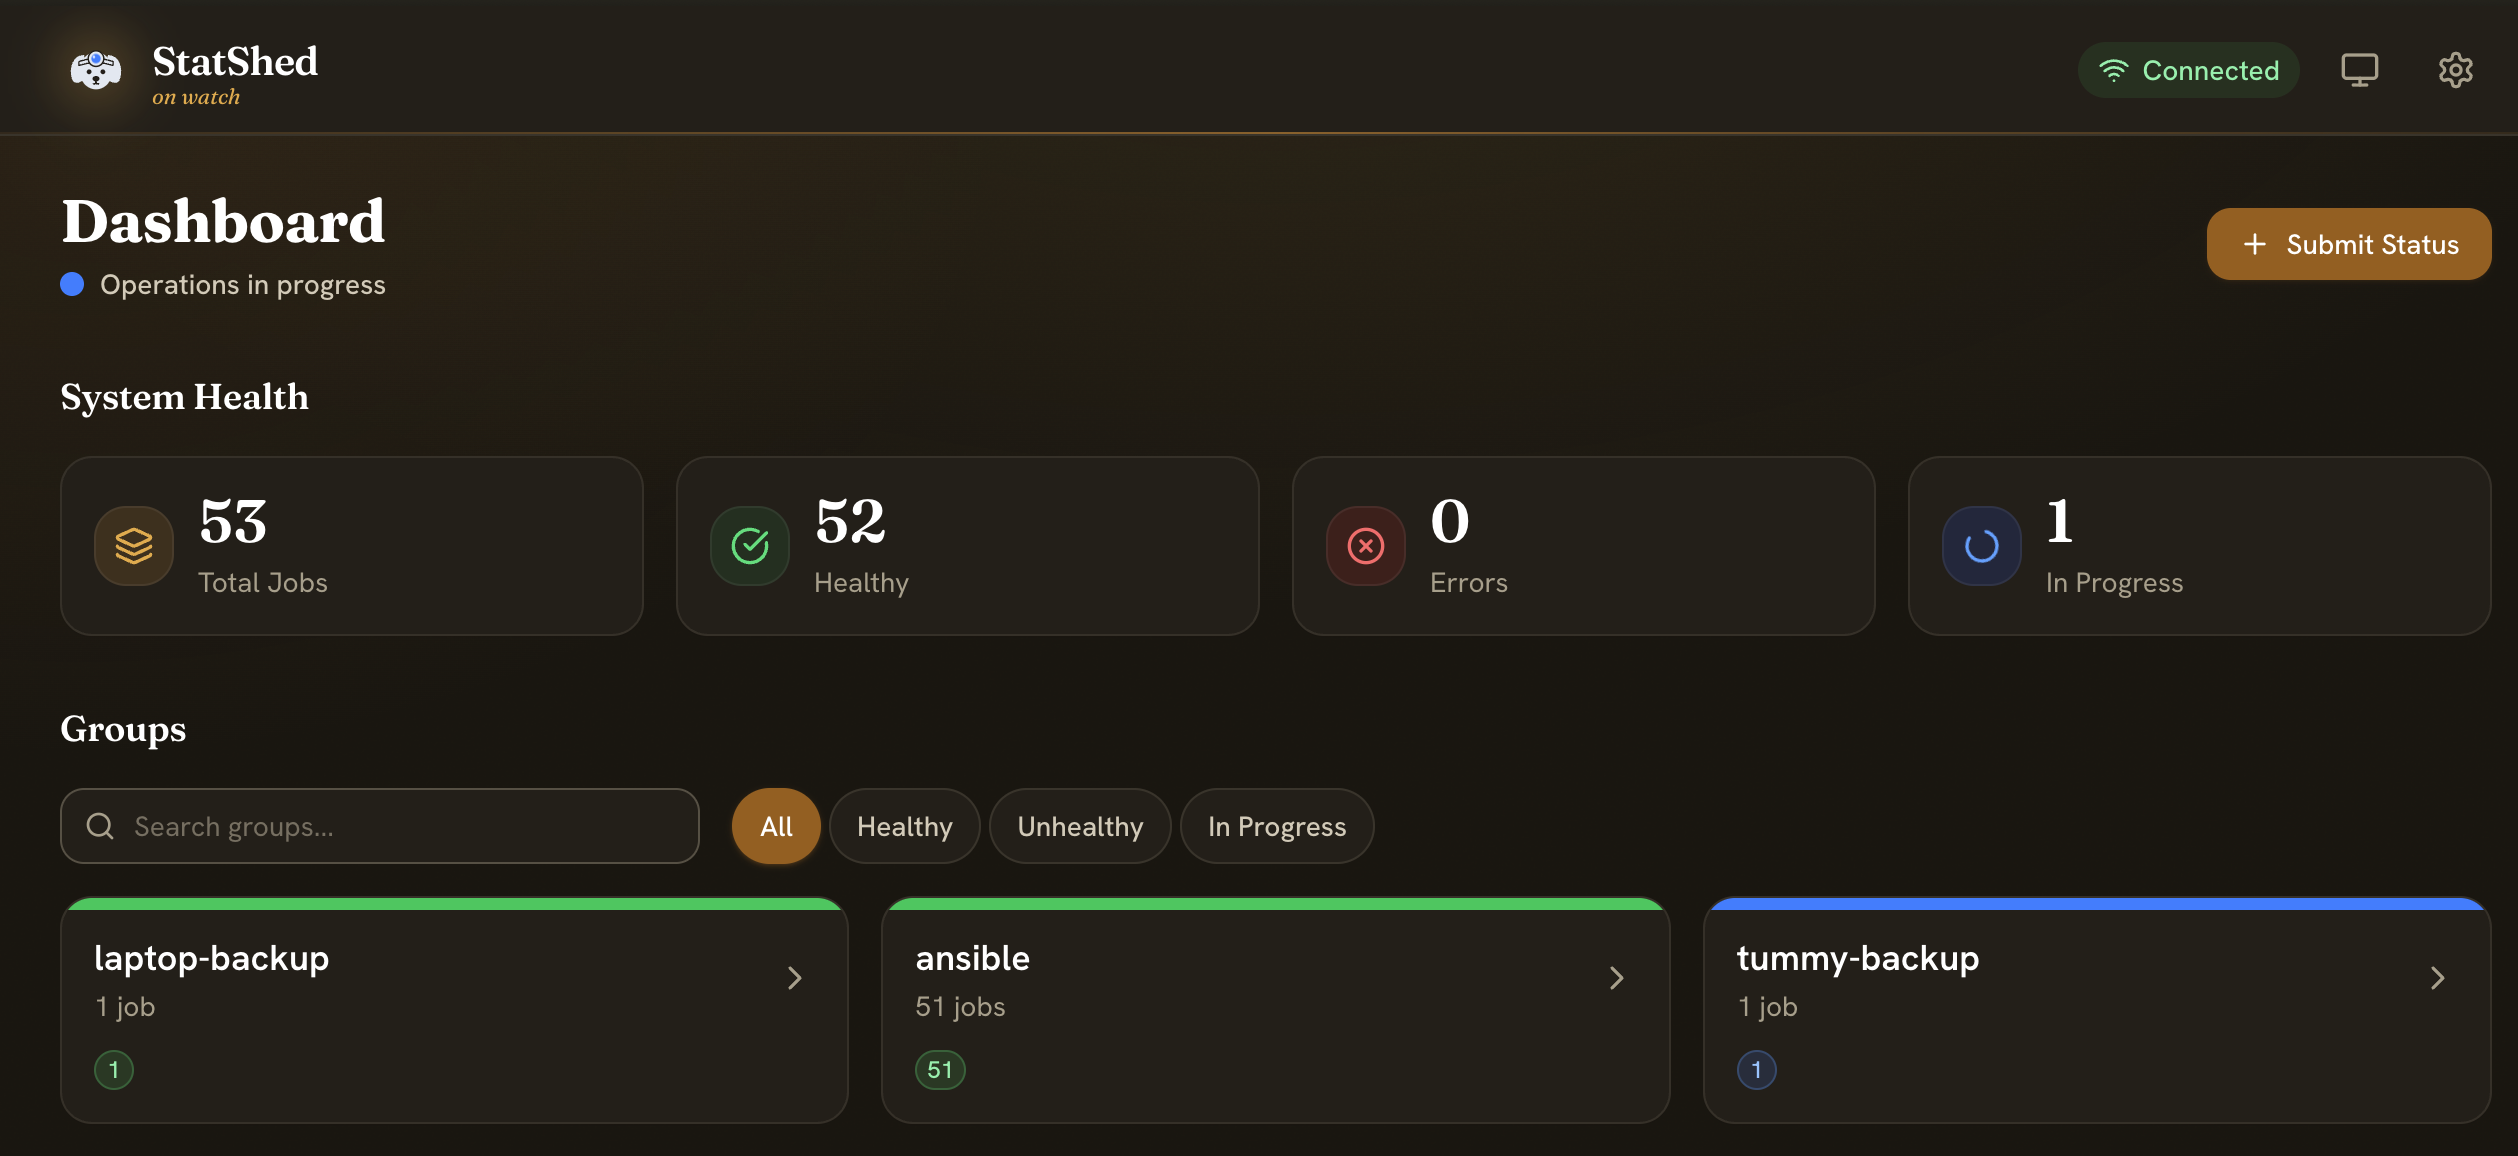
A dead-simple place to see whether your jobs actually ran. Every cron job, backup script, CI pipeline, and batch task makes one HTTP POST with its status; StatShed shows a live dashboard of what succeeded, what failed, what's still running, and what's gone quiet — across every machine you own.
Why StatShed?
Job status is scattered everywhere and visible nowhere. Cron emails get filtered into a folder you never open. Backup scripts write logs to a box nobody reads. CI posts to a chat channel and scrolls away by morning. So the simple question — "did last night's backup actually run?" — turns into an SSH safari.
StatShed fixes that with the smallest possible moving part: each job sends one HTTP request when it starts, succeeds, or fails, and a single self-hosted server collects them into a live web dashboard, grouped however you like. No agents to install, no scrape config, no per-job setup on the server. A job shows up the first time it reports.
It's built for:
- Cron jobs — know at a glance that every nightly task ran (and yell when one didn't).
- Backups — green means last night's dump finished; red or stale means go look.
- CI/CD & releases — post build/deploy status from any pipeline to one board.
- Batch & cluster work — long jobs can stream progress and attach log output, so you see what's running and the tail of its log without logging into anything.
[!IMPORTANT] StatShed is not a monitoring or alerting system, and isn't trying to be. It doesn't probe your services, collect metrics, draw graphs, or page anyone. It's a status collector and dashboard. Run it alongside your real monitoring (Icinga, Nagios, Prometheus, …) — not instead of it. See What StatShed is — and isn't.
Quick start
Two ways to get a dashboard running in a couple of minutes — no build required either way.
Option A — Docker (recommended)
Pulls a prebuilt image; nothing is compiled locally. Needs Docker with Compose.
mkdir statshed && cd statshed

# Grab the compose file from the latest release
curl -LO https://github.com/statshed/statshed-server/releases/latest/download/docker-compose.yml

docker compose up -d
Open http://localhost:7827. That's it — the single container serves the dashboard, the
REST API, and the live event stream, and stores its data in a Docker volume
(statshed-data).
Want to customize? Also download
env.example,
copy it to .env, and edit. A .env is optional — the compose file ships sensible defaults.
To pin a version instead of latest, set STATSHED_VERSION=0.10.0 in .env — the
image tag omits the leading v (it's 0.10.0, not v0.10.0).
Option B — Standalone binary
A single self-contained binary with the dashboard embedded — no Docker, no runtime
dependencies. Pick a release from the
releases page and download the binary
for your architecture (plus SHA256SUMS to verify it). The asset names include the version,
so set it once:
VERSION=v0.10.0  # the release you want (binary assets keep the leading `v`)
ARCH=amd64       # or arm64
BASE=https://github.com/statshed/statshed-server/releases/download/$VERSION

curl -LO $BASE/statshed-server-$VERSION-linux-$ARCH
curl -LO $BASE/SHA256SUMS
sha256sum --check --ignore-missing SHA256SUMS

chmod +x statshed-server-$VERSION-linux-$ARCH
./statshed-server-$VERSION-linux-$ARCH
Open http://127.0.0.1:7828. The binary listens on 127.0.0.1:7828 by default and
creates its SQLite database in the current directory. To reach it from other machines, bind
all interfaces: HOST=0.0.0.0 PORT=7828 ./statshed-server-....
[!NOTE] StatShed has no authentication, by design. Run it on a trusted/internal network, or behind a reverse proxy that adds TLS and auth. See Security.
Different default ports are intentional: the Docker quick start maps host 7827 to the container's 7828, while the bare binary listens on 7828 directly. Use whichever port your setup exposes in the examples below.
Send your first status
With the server running, report a status and watch it appear on the dashboard instantly
(no refresh). Point these at port 7827 for Docker or 7828 for the standalone binary —
the examples use 7827.
With curl:
curl -X POST http://localhost:7827/api/status \
  -H 'Content-Type: application/json' \
  -d '{"group":"demo","job":"hello-world","status":"success","message":"It works!"}'
Or with the statshed CLI (see CLI clients):
export STATSHED_URL=http://localhost:7827
statshed submit -g demo -j hello-world -s success -m "It works!"
Jobs normally report success, error, or progress; the server assigns timeout and
stale on its own (see Core concepts). Group and job names are normalized
to lowercase and may contain only letters, digits, dot, dash, and underscore. In real life
you'd call the CLI from your scripts rather than hand-writing curl.
What StatShed is — and isn't
StatShed is a lightweight, push-based status collector and a real-time dashboard. Jobs push events to it over plain HTTP; it stores the latest state per job and shows it, grouped, updating live. There are no agents and nothing to register in advance.
StatShed is not a replacement for a monitoring/alerting system. It has no metrics, no time-series graphs, no alert routing or paging, and no authentication or access control. It does not reach out and check your services — it only knows what your jobs tell it.
Reach for it when you want a single glanceable answer to "did my jobs run, and were they OK?" — with progress and logs when you need them. Keep your real monitoring for uptime, thresholds, and paging.
Core concepts
- Groups and jobs. Every report names a
group(e.g.backups,ci, a hostname) and ajobwithin it. Both are created automatically the first time they report — no setup. Names are normalized to lowercase and limited toa–z 0–9 . _ -(max 255 chars). - Statuses. Your jobs report
success,error, orprogress. The server can also assign two on its own:timeout— aprogressjob that stopped reporting before finishing.stale— asuccessjob that hasn't checked in within its staleness window (only for groups where staleness is enabled — see below).
- Progress timeout. A background worker runs about once a minute and flips a
progressjob totimeoutonce it exceeds the progress-timeout window (default 5 minutes). - Staleness (opt-in per group). Staleness is off by default. Enable it for a group
and its
successjobs becomestaleif they don't report again within the staleness window (default 24 hours) — handy for jobs you expect to run on a schedule. - Expiration. Jobs that haven't reported for the expiration window (default 24 hours) are removed, so the board stays focused on what's current instead of growing forever.
- The progress-timeout, staleness, and expiration windows are configurable globally and per group (see Configuring the server).
- Acknowledge. Seen a failure and dealt with it? Acknowledge the job (or a whole group,
or everything) to clear it from the unhealthy count without waiting for the next report.
Only
error,timeout, andstalejobs can be acknowledged. - Logs. A report can carry a log file; the dashboard shows its tail, which is handy for "why did this fail" without leaving the page.
CLI clients
You can use any HTTP client, but the statshed CLI is the easy button for scripts and
pipelines. Two interchangeable implementations live in their own repos:
| Client | Repo | Best for |
|---|---|---|
| Go (recommended) | statshed-gocli | A single static binary with no runtime dependencies — drop it onto any cron/CI host. |
| Python | statshed-pycli | Environments where you already have Python and prefer pip/uv installs. |
Both expose the same command surface:
statshed submit -g <group> -j <job> -s <success|error|progress> [-m "message"] [--log file.log]
Point the CLI at your server with the STATSHED_URL environment variable (or a config
file — see each client's README). By default, submit is lenient: if the server is
unreachable it won't fail your script (great with set -eu). See the client repos for
install instructions, configuration, and the full command set.
Reporting from real jobs
A few copy-pasteable patterns. (All assume STATSHED_URL is set.)
Cron job, safe under set -eu — status reporting won't abort your script:
#!/bin/bash
set -eu
statshed submit -g backups -j postgres -s progress -m "Starting dump"
pg_dump mydb | gzip > /backups/mydb.sql.gz
statshed submit -g backups -j postgres -s success -m "Dump complete" --log /var/log/pgdump.log
GitHub Actions — report build start, then success or failure:
- run: statshed submit -g ci -j "${{ github.repository }}" -s progress -m "${{ github.sha }}"
- run: make build
- if: success()
  run: statshed submit -g ci -j "${{ github.repository }}" -s success -m "${{ github.sha }}"
- if: failure()
  run: statshed submit -g ci -j "${{ github.repository }}" -s error -m "${{ github.sha }}"
env:
  STATSHED_URL: https://statshed.internal.example.com
Configuring the server
The server is configured entirely through environment variables (with Docker, set them in
.env). The handful most people touch:
| Variable | Default | Description |
|---|---|---|
STATSHED_PORT | 7827 | (Docker compose only) host port mapped to the container's 7828. Open the dashboard here; the CLI POSTs here. |
HOST | 127.0.0.1 | Bind address for the server process. Set 0.0.0.0 to accept connections from other hosts (the container image already binds 0.0.0.0). |
PORT | 7828 | Port the server process listens on. |
DATABASE_URL | sqlite:///statshed.db | SQLite database location (SQLite only). The Docker image uses sqlite:////data/statshed.db inside the statshed-data volume. |
DEBUG | false | Verbose request logging. Keep false in production. |
LOG_UPLOAD_ENABLED | true | Accept log uploads on POST /api/status. When false, the report still succeeds but any uploaded log is ignored and the response carries a warning. |
CORS_ORIGINS | (localhost dev origins) | Comma-separated browser origins allowed to call the API. Only matters if a browser hits the API from a different origin than it was served from. |
Less common settings: MAX_LOG_LINES (default 1000, the longest tail stored per job),
MAX_JOBS_PAGE_SIZE (default 500, the cap on a single jobs query), and
STATIC_DIR / STATIC_DISABLED (serve the dashboard from a directory, or turn off SPA
serving). SECRET_KEY is accepted but ignored — it exists only so a .env carried over
from the legacy Python server still loads.
The progress-timeout, staleness, and expiration windows are runtime settings, not environment variables. Configure them per group from the dashboard, and globally via the config API — the dashboard's global settings form covers progress and staleness. See Core concepts for what they do.
Command-line flags
--version       Print the version and exit.
--healthcheck   Probe the local /api/health endpoint; exit 0 if healthy, 1 otherwise.
                (This is what the container's HEALTHCHECK runs.)
Data, backups & upgrades
StatShed keeps everything in a single SQLite database.
- Where it lives. With Docker it's in the Compose-managed
statshed-datavolume (Compose prefixes it with the project name — find the exact name withdocker volume ls). With the standalone binary it's the file named byDATABASE_URL, created in the working directory by default. - Back it up. Copy the database file (and its
-wal/-shmsiblings if present), ideally while the server is stopped. With Docker, back up that volume. - Upgrades preserve your data. Pull a newer image (or drop in a newer binary) and restart; the server applies any pending schema migrations automatically on startup and keeps your existing jobs.
- One caveat. The server only initializes and migrates a database it created itself. It will refuse to start against a foreign or incompatible database — for example one produced by the legacy Python server — rather than risk corrupting it. In that case, start with a fresh database (or restore from a StatShed backup).
Protocol overview
The dashboard, REST API, and event stream are all served from one origin on one port. CLIs
and scripts talk to the REST API under /api; the browser additionally subscribes to the
live event stream. The REST API reference documents every endpoint —
this is the short version.
Report a status — POST /api/status:
| Field | Required | Notes |
|---|---|---|
group | yes | created on first use; normalized, ≤255 chars |
job | yes | created on first use; normalized, ≤255 chars |
status | yes | one of success, error, progress, timeout, stale (jobs normally send the first three) |
message | no | free text, ≤4096 chars |
log | no | a log file (use multipart/form-data instead of JSON) |
A successful report returns 201 with the stored job. JSON request bodies are capped at
1 MB.
The status lifecycle the server manages on its own:
progress ──(no update before progress timeout)──▶ timeout
success  ──(no update before staleness window)──▶ stale      (only if staleness is enabled for the group)
any job  ──(no update before expiration window)─▶ removed
Live updates (SSE). The browser connects an
EventSource to
GET /api/events, a text/event-stream that pushes events such as status_update,
group_created, jobs_acked, job_deleted, health_update, and job_expired. It sends a
heartbeat comment about every 25 seconds and reconnects automatically after a drop; clients
re-fetch on reconnect to catch anything missed. Every event payload carries
"schema_version": 1. Full event catalog: docs/restapi.md.
Security
StatShed performs no authentication or authorization — every request is trusted. That's a deliberate choice for the common case (an internal dashboard on a trusted network), and it keeps reporting from a script down to one unauthenticated HTTP call.
To expose StatShed beyond a trusted network, put it behind a reverse proxy that terminates TLS and adds authentication. Two notes for proxy setups:
- Restrict who can reach it, since anyone who can POST can write status (and read all of it).
- The event stream is
text/event-streamand must not be buffered by the proxy, or live updates will stall (see Troubleshooting).
Use CORS_ORIGINS if a browser on a different origin needs to call the API directly.
Architecture
StatShed ships as a single Go binary. It serves the REST API under /api, the SSE
stream at /api/events, and the embedded React/Vite dashboard at / — same origin, one
port — backed by SQLite. The production image is a non-root
distroless container with no shell or
package manager; the standalone release binaries embed the dashboard so they need nothing on
disk but themselves. The database schema is migrated automatically on startup.
StatShed began as a Python/Flask + Socket.IO server; it's now a single Go binary with SSE in place of WebSockets. The Python implementation has been retired.
Development & tests
Build and hack on StatShed locally — see CONTRIBUTING.md for the full
loop and the checks CI enforces. You'll need a Go toolchain and Node.js (for the dashboard).
Common tasks (run make help for the full list):
make dev            # run the Go server locally with a freshly built embedded dashboard
make test           # Go unit tests with the race detector
make e2e            # frontend end-to-end tests (Playwright)
make contract-test  # HTTP contract suite against the Go server
make up             # build and run the full stack in Docker (build from source)
The build-from-source Docker path uses docker-compose.yml; the
release/prebuilt path uses the compose file attached to each GitHub Release.
Troubleshooting
- Port already in use. Change
STATSHED_PORT(Docker) orPORT(standalone binary) to a free port. - Can't reach it from another machine. The binary binds
127.0.0.1by default; setHOST=0.0.0.0(the Docker image already does). Make sure your firewall allows the port. - It refuses to start, complaining about the database. The server only adopts a database
it created itself; point
DATABASE_URLat a fresh path, or restore a StatShed backup. See Data, backups & upgrades. - My log upload didn't show up. Check that
LOG_UPLOAD_ENABLEDisn'tfalse, that you sent the report asmultipart/form-datawith alogfile part, and remember the stored log is capped atMAX_LOG_LINESlines. - Live updates don't arrive behind a reverse proxy. The event stream
(
GET /api/events) istext/event-streamand must not be buffered. For nginx, disable buffering for that path (e.g.proxy_buffering off;).
Repository layout
statshed-server/
├── cmd/statshed-server/   # Go entrypoint (main package)
├── internal/              # Go server: api, store, realtime (SSE), background, config, staticfs
├── frontend/              # React + Vite dashboard (embedded into the Go binary)
├── contracttest/          # HTTP contract suite (drives the Go server over HTTP)
├── docs/                  # REST API reference and design docs
├── docker-compose.yml     # Build-from-source single-service stack
├── Dockerfile             # Multi-stage build → distroless image
└── Makefile               # Developer/operator tasks — `make help`
Releasing (maintainers)
Releases are tag-driven. Pushing a semver tag builds the multi-arch image, pushes it to
GHCR, and publishes a GitHub Release with the standalone binaries, a docker-compose.yml,
an env.example, and SHA256SUMS:
git tag v0.9.2
git push origin v0.9.2
One-time: after the first release, set the
statshed-serverGHCR package to public (Package settings → Change visibility) so anyone can pull it, and link it to this repository.
License
StatShed is dedicated to the public domain under CC0 1.0 Universal — use it for anything, no attribution required.
Contributors

76 commits
Similar repos


Languages
TypeScript
54.2%
Go
42.8%
CSS
1.8%
See what people are saying (1)
README
StatShed
A dead-simple place to see whether your jobs actually ran. Every cron job, backup script, CI pipeline, and batch task makes one HTTP POST with its status; StatShed shows a live dashboard of what succeeded, what failed, what's still running, and what's gone quiet — across every machine you own.
Why StatShed?
Job status is scattered everywhere and visible nowhere. Cron emails get filtered into a folder you never open. Backup scripts write logs to a box nobody reads. CI posts to a chat channel and scrolls away by morning. So the simple question — "did last night's backup actually run?" — turns into an SSH safari.
StatShed fixes that with the smallest possible moving part: each job sends one HTTP request when it starts, succeeds, or fails, and a single self-hosted server collects them into a live web dashboard, grouped however you like. No agents to install, no scrape config, no per-job setup on the server. A job shows up the first time it reports.
It's built for:
- Cron jobs — know at a glance that every nightly task ran (and yell when one didn't).
- Backups — green means last night's dump finished; red or stale means go look.
- CI/CD & releases — post build/deploy status from any pipeline to one board.
- Batch & cluster work — long jobs can stream progress and attach log output, so you see what's running and the tail of its log without logging into anything.
[!IMPORTANT] StatShed is not a monitoring or alerting system, and isn't trying to be. It doesn't probe your services, collect metrics, draw graphs, or page anyone. It's a status collector and dashboard. Run it alongside your real monitoring (Icinga, Nagios, Prometheus, …) — not instead of it. See What StatShed is — and isn't.
Quick start
Two ways to get a dashboard running in a couple of minutes — no build required either way.
Option A — Docker (recommended)
Pulls a prebuilt image; nothing is compiled locally. Needs Docker with Compose.
mkdir statshed && cd statshed

# Grab the compose file from the latest release
curl -LO https://github.com/statshed/statshed-server/releases/latest/download/docker-compose.yml

docker compose up -d
Open http://localhost:7827. That's it — the single container serves the dashboard, the
REST API, and the live event stream, and stores its data in a Docker volume
(statshed-data).
Want to customize? Also download
env.example,
copy it to .env, and edit. A .env is optional — the compose file ships sensible defaults.
To pin a version instead of latest, set STATSHED_VERSION=0.10.0 in .env — the
image tag omits the leading v (it's 0.10.0, not v0.10.0).
Option B — Standalone binary
A single self-contained binary with the dashboard embedded — no Docker, no runtime
dependencies. Pick a release from the
releases page and download the binary
for your architecture (plus SHA256SUMS to verify it). The asset names include the version,
so set it once:
VERSION=v0.10.0  # the release you want (binary assets keep the leading `v`)
ARCH=amd64       # or arm64
BASE=https://github.com/statshed/statshed-server/releases/download/$VERSION

curl -LO $BASE/statshed-server-$VERSION-linux-$ARCH
curl -LO $BASE/SHA256SUMS
sha256sum --check --ignore-missing SHA256SUMS

chmod +x statshed-server-$VERSION-linux-$ARCH
./statshed-server-$VERSION-linux-$ARCH
Open http://127.0.0.1:7828. The binary listens on 127.0.0.1:7828 by default and
creates its SQLite database in the current directory. To reach it from other machines, bind
all interfaces: HOST=0.0.0.0 PORT=7828 ./statshed-server-....
[!NOTE] StatShed has no authentication, by design. Run it on a trusted/internal network, or behind a reverse proxy that adds TLS and auth. See Security.
Different default ports are intentional: the Docker quick start maps host 7827 to the container's 7828, while the bare binary listens on 7828 directly. Use whichever port your setup exposes in the examples below.
Send your first status
With the server running, report a status and watch it appear on the dashboard instantly
(no refresh). Point these at port 7827 for Docker or 7828 for the standalone binary —
the examples use 7827.
With curl:
curl -X POST http://localhost:7827/api/status \
  -H 'Content-Type: application/json' \
  -d '{"group":"demo","job":"hello-world","status":"success","message":"It works!"}'
Or with the statshed CLI (see CLI clients):
export STATSHED_URL=http://localhost:7827
statshed submit -g demo -j hello-world -s success -m "It works!"
Jobs normally report success, error, or progress; the server assigns timeout and
stale on its own (see Core concepts). Group and job names are normalized
to lowercase and may contain only letters, digits, dot, dash, and underscore. In real life
you'd call the CLI from your scripts rather than hand-writing curl.
What StatShed is — and isn't
StatShed is a lightweight, push-based status collector and a real-time dashboard. Jobs push events to it over plain HTTP; it stores the latest state per job and shows it, grouped, updating live. There are no agents and nothing to register in advance.
StatShed is not a replacement for a monitoring/alerting system. It has no metrics, no time-series graphs, no alert routing or paging, and no authentication or access control. It does not reach out and check your services — it only knows what your jobs tell it.
Reach for it when you want a single glanceable answer to "did my jobs run, and were they OK?" — with progress and logs when you need them. Keep your real monitoring for uptime, thresholds, and paging.
Core concepts
- Groups and jobs. Every report names a
group(e.g.backups,ci, a hostname) and ajobwithin it. Both are created automatically the first time they report — no setup. Names are normalized to lowercase and limited toa–z 0–9 . _ -(max 255 chars). - Statuses. Your jobs report
success,error, orprogress. The server can also assign two on its own:timeout— aprogressjob that stopped reporting before finishing.stale— asuccessjob that hasn't checked in within its staleness window (only for groups where staleness is enabled — see below).
- Progress timeout. A background worker runs about once a minute and flips a
progressjob totimeoutonce it exceeds the progress-timeout window (default 5 minutes). - Staleness (opt-in per group). Staleness is off by default. Enable it for a group
and its
successjobs becomestaleif they don't report again within the staleness window (default 24 hours) — handy for jobs you expect to run on a schedule. - Expiration. Jobs that haven't reported for the expiration window (default 24 hours) are removed, so the board stays focused on what's current instead of growing forever.
- The progress-timeout, staleness, and expiration windows are configurable globally and per group (see Configuring the server).
- Acknowledge. Seen a failure and dealt with it? Acknowledge the job (or a whole group,
or everything) to clear it from the unhealthy count without waiting for the next report.
Only
error,timeout, andstalejobs can be acknowledged. - Logs. A report can carry a log file; the dashboard shows its tail, which is handy for "why did this fail" without leaving the page.
CLI clients
You can use any HTTP client, but the statshed CLI is the easy button for scripts and
pipelines. Two interchangeable implementations live in their own repos:
| Client | Repo | Best for |
|---|---|---|
| Go (recommended) | statshed-gocli | A single static binary with no runtime dependencies — drop it onto any cron/CI host. |
| Python | statshed-pycli | Environments where you already have Python and prefer pip/uv installs. |
Both expose the same command surface:
statshed submit -g <group> -j <job> -s <success|error|progress> [-m "message"] [--log file.log]
Point the CLI at your server with the STATSHED_URL environment variable (or a config
file — see each client's README). By default, submit is lenient: if the server is
unreachable it won't fail your script (great with set -eu). See the client repos for
install instructions, configuration, and the full command set.
Reporting from real jobs
A few copy-pasteable patterns. (All assume STATSHED_URL is set.)
Cron job, safe under set -eu — status reporting won't abort your script:
#!/bin/bash
set -eu
statshed submit -g backups -j postgres -s progress -m "Starting dump"
pg_dump mydb | gzip > /backups/mydb.sql.gz
statshed submit -g backups -j postgres -s success -m "Dump complete" --log /var/log/pgdump.log
GitHub Actions — report build start, then success or failure:
- run: statshed submit -g ci -j "${{ github.repository }}" -s progress -m "${{ github.sha }}"
- run: make build
- if: success()
  run: statshed submit -g ci -j "${{ github.repository }}" -s success -m "${{ github.sha }}"
- if: failure()
  run: statshed submit -g ci -j "${{ github.repository }}" -s error -m "${{ github.sha }}"
env:
  STATSHED_URL: https://statshed.internal.example.com
Configuring the server
The server is configured entirely through environment variables (with Docker, set them in
.env). The handful most people touch:
| Variable | Default | Description |
|---|---|---|
STATSHED_PORT | 7827 | (Docker compose only) host port mapped to the container's 7828. Open the dashboard here; the CLI POSTs here. |
HOST | 127.0.0.1 | Bind address for the server process. Set 0.0.0.0 to accept connections from other hosts (the container image already binds 0.0.0.0). |
PORT | 7828 | Port the server process listens on. |
DATABASE_URL | sqlite:///statshed.db | SQLite database location (SQLite only). The Docker image uses sqlite:////data/statshed.db inside the statshed-data volume. |
DEBUG | false | Verbose request logging. Keep false in production. |
LOG_UPLOAD_ENABLED | true | Accept log uploads on POST /api/status. When false, the report still succeeds but any uploaded log is ignored and the response carries a warning. |
CORS_ORIGINS | (localhost dev origins) | Comma-separated browser origins allowed to call the API. Only matters if a browser hits the API from a different origin than it was served from. |
Less common settings: MAX_LOG_LINES (default 1000, the longest tail stored per job),
MAX_JOBS_PAGE_SIZE (default 500, the cap on a single jobs query), and
STATIC_DIR / STATIC_DISABLED (serve the dashboard from a directory, or turn off SPA
serving). SECRET_KEY is accepted but ignored — it exists only so a .env carried over
from the legacy Python server still loads.
The progress-timeout, staleness, and expiration windows are runtime settings, not environment variables. Configure them per group from the dashboard, and globally via the config API — the dashboard's global settings form covers progress and staleness. See Core concepts for what they do.
Command-line flags
--version       Print the version and exit.
--healthcheck   Probe the local /api/health endpoint; exit 0 if healthy, 1 otherwise.
                (This is what the container's HEALTHCHECK runs.)
Data, backups & upgrades
StatShed keeps everything in a single SQLite database.
- Where it lives. With Docker it's in the Compose-managed
statshed-datavolume (Compose prefixes it with the project name — find the exact name withdocker volume ls). With the standalone binary it's the file named byDATABASE_URL, created in the working directory by default. - Back it up. Copy the database file (and its
-wal/-shmsiblings if present), ideally while the server is stopped. With Docker, back up that volume. - Upgrades preserve your data. Pull a newer image (or drop in a newer binary) and restart; the server applies any pending schema migrations automatically on startup and keeps your existing jobs.
- One caveat. The server only initializes and migrates a database it created itself. It will refuse to start against a foreign or incompatible database — for example one produced by the legacy Python server — rather than risk corrupting it. In that case, start with a fresh database (or restore from a StatShed backup).
Protocol overview
The dashboard, REST API, and event stream are all served from one origin on one port. CLIs
and scripts talk to the REST API under /api; the browser additionally subscribes to the
live event stream. The REST API reference documents every endpoint —
this is the short version.
Report a status — POST /api/status:
| Field | Required | Notes |
|---|---|---|
group | yes | created on first use; normalized, ≤255 chars |
job | yes | created on first use; normalized, ≤255 chars |
status | yes | one of success, error, progress, timeout, stale (jobs normally send the first three) |
message | no | free text, ≤4096 chars |
log | no | a log file (use multipart/form-data instead of JSON) |
A successful report returns 201 with the stored job. JSON request bodies are capped at
1 MB.
The status lifecycle the server manages on its own:
progress ──(no update before progress timeout)──▶ timeout
success  ──(no update before staleness window)──▶ stale      (only if staleness is enabled for the group)
any job  ──(no update before expiration window)─▶ removed
Live updates (SSE). The browser connects an
EventSource to
GET /api/events, a text/event-stream that pushes events such as status_update,
group_created, jobs_acked, job_deleted, health_update, and job_expired. It sends a
heartbeat comment about every 25 seconds and reconnects automatically after a drop; clients
re-fetch on reconnect to catch anything missed. Every event payload carries
"schema_version": 1. Full event catalog: docs/restapi.md.
Security
StatShed performs no authentication or authorization — every request is trusted. That's a deliberate choice for the common case (an internal dashboard on a trusted network), and it keeps reporting from a script down to one unauthenticated HTTP call.
To expose StatShed beyond a trusted network, put it behind a reverse proxy that terminates TLS and adds authentication. Two notes for proxy setups:
- Restrict who can reach it, since anyone who can POST can write status (and read all of it).
- The event stream is
text/event-streamand must not be buffered by the proxy, or live updates will stall (see Troubleshooting).
Use CORS_ORIGINS if a browser on a different origin needs to call the API directly.
Architecture
StatShed ships as a single Go binary. It serves the REST API under /api, the SSE
stream at /api/events, and the embedded React/Vite dashboard at / — same origin, one
port — backed by SQLite. The production image is a non-root
distroless container with no shell or
package manager; the standalone release binaries embed the dashboard so they need nothing on
disk but themselves. The database schema is migrated automatically on startup.
StatShed began as a Python/Flask + Socket.IO server; it's now a single Go binary with SSE in place of WebSockets. The Python implementation has been retired.
Development & tests
Build and hack on StatShed locally — see CONTRIBUTING.md for the full
loop and the checks CI enforces. You'll need a Go toolchain and Node.js (for the dashboard).
Common tasks (run make help for the full list):
make dev            # run the Go server locally with a freshly built embedded dashboard
make test           # Go unit tests with the race detector
make e2e            # frontend end-to-end tests (Playwright)
make contract-test  # HTTP contract suite against the Go server
make up             # build and run the full stack in Docker (build from source)
The build-from-source Docker path uses docker-compose.yml; the
release/prebuilt path uses the compose file attached to each GitHub Release.
Troubleshooting
- Port already in use. Change
STATSHED_PORT(Docker) orPORT(standalone binary) to a free port. - Can't reach it from another machine. The binary binds
127.0.0.1by default; setHOST=0.0.0.0(the Docker image already does). Make sure your firewall allows the port. - It refuses to start, complaining about the database. The server only adopts a database
it created itself; point
DATABASE_URLat a fresh path, or restore a StatShed backup. See Data, backups & upgrades. - My log upload didn't show up. Check that
LOG_UPLOAD_ENABLEDisn'tfalse, that you sent the report asmultipart/form-datawith alogfile part, and remember the stored log is capped atMAX_LOG_LINESlines. - Live updates don't arrive behind a reverse proxy. The event stream
(
GET /api/events) istext/event-streamand must not be buffered. For nginx, disable buffering for that path (e.g.proxy_buffering off;).
Repository layout
statshed-server/
├── cmd/statshed-server/   # Go entrypoint (main package)
├── internal/              # Go server: api, store, realtime (SSE), background, config, staticfs
├── frontend/              # React + Vite dashboard (embedded into the Go binary)
├── contracttest/          # HTTP contract suite (drives the Go server over HTTP)
├── docs/                  # REST API reference and design docs
├── docker-compose.yml     # Build-from-source single-service stack
├── Dockerfile             # Multi-stage build → distroless image
└── Makefile               # Developer/operator tasks — `make help`
Releasing (maintainers)
Releases are tag-driven. Pushing a semver tag builds the multi-arch image, pushes it to
GHCR, and publishes a GitHub Release with the standalone binaries, a docker-compose.yml,
an env.example, and SHA256SUMS:
git tag v0.9.2
git push origin v0.9.2
One-time: after the first release, set the
statshed-serverGHCR package to public (Package settings → Change visibility) so anyone can pull it, and link it to this repository.
License
StatShed is dedicated to the public domain under CC0 1.0 Universal — use it for anything, no attribution required.
Similar repos
Contributors
76 commits
Languages
TypeScript
54.2%
Go
42.8%
CSS
1.8%