
Mirror-glass monitor for a local LLM runtime (llama-swap, NInfer, Strata) on one RTX 4090
Python
1
27 commits
updated Oct 5, 2026
See what people are saying
README
Speculum
A lightweight observability dashboard for a local LLM runtime.
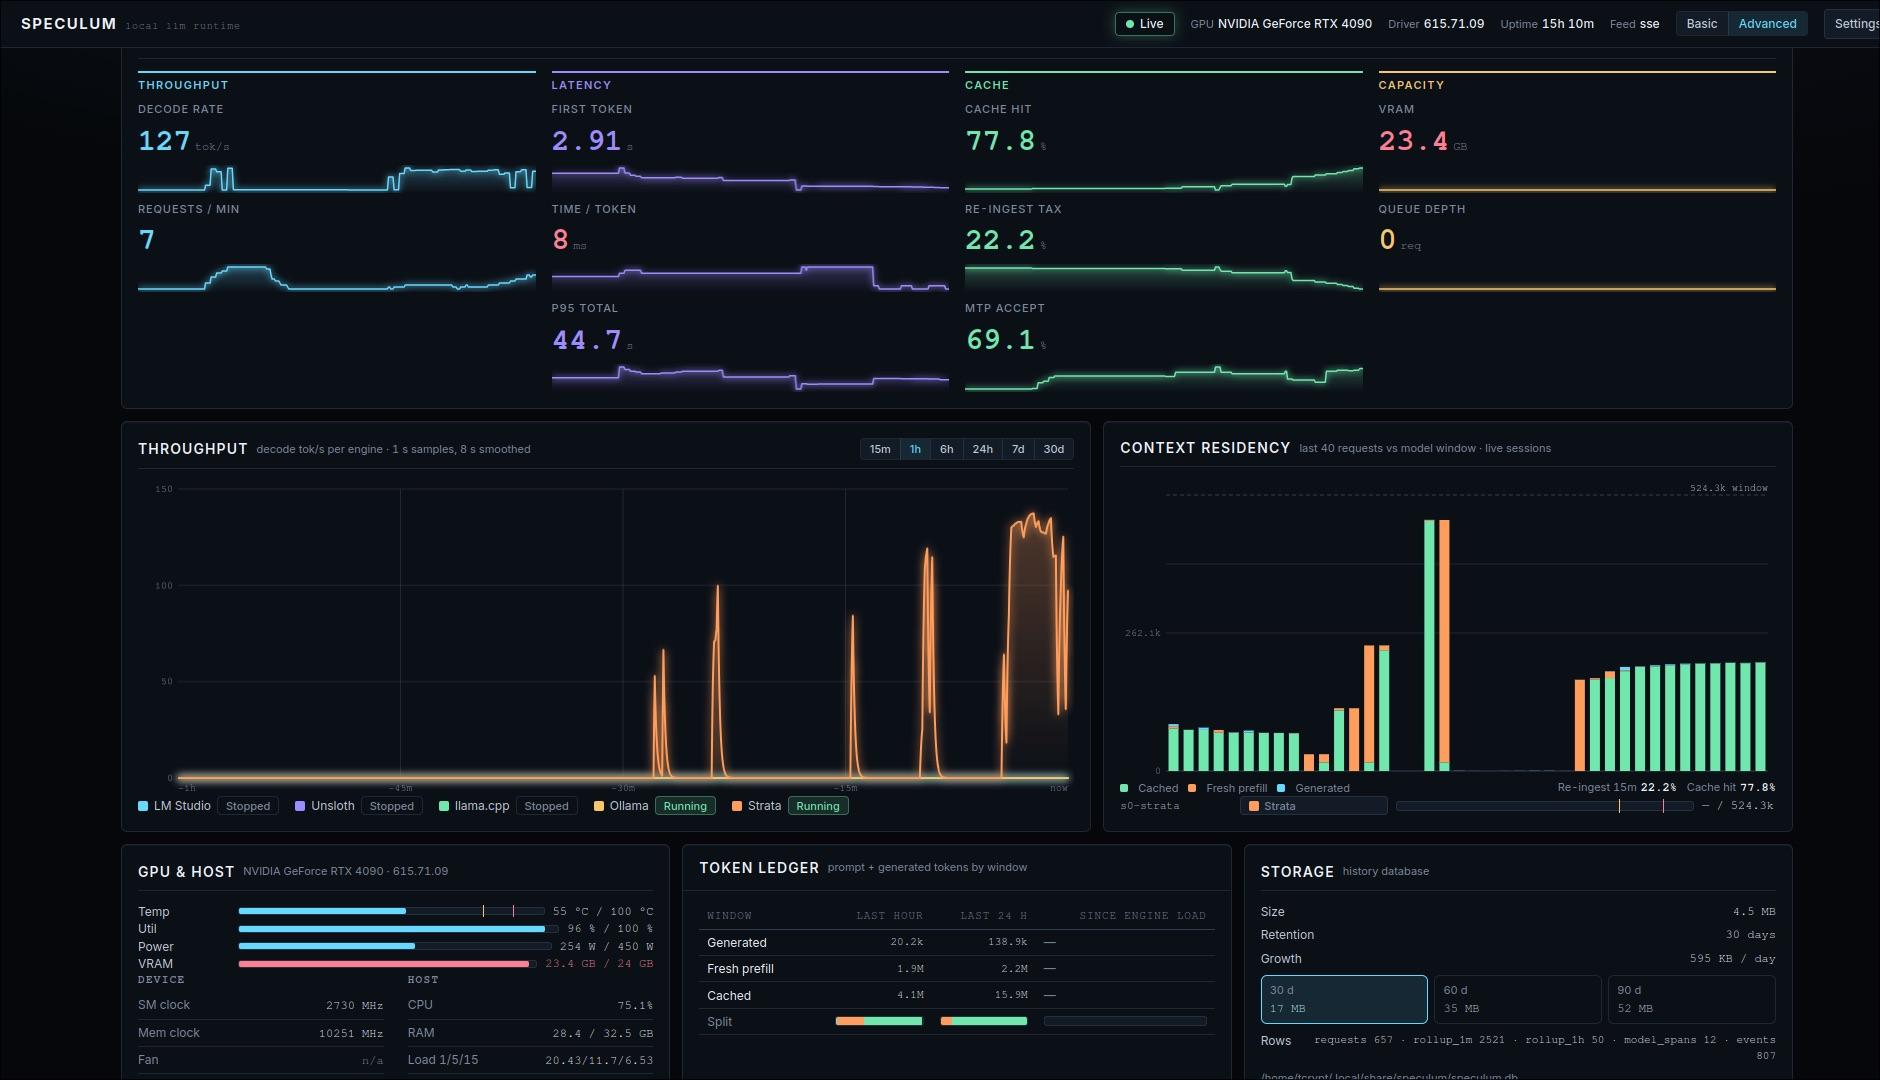
Speculum runs on the box doing the work. It watches a local LLM stack — one GPU serving local models through llama-swap, plus engine backends such as NInfer or Strata (or Ollama, vLLM, LM Studio, Unsloth Studio, any OpenAI-compatible or custom endpoint) — and renders everything on one page, refreshed at 1 Hz:
- No build step, no dependencies. The front end is plain HTML, CSS and ES
modules; the collector is one Python 3 process using only the standard
library. Nothing to
pip install, nothing to compile. - No infrastructure. The only storage is an optional local SQLite file.
- Local by design. Binds
127.0.0.1only. Off-box viewing goes throughtailscale serve(tailnet-only) — never to the LAN or the public internet. - Honest degradation. Every source is optional. A down engine or backend shows as an honest "no data" — never a fabricated number, and never enough to take the page down.
Quick start
All you need is Python 3.9 or newer (3.11+ only if you use a TOML config file) — the collector is stdlib-only, so there is nothing to install.
Live — the collector serves the static files and the feed:
python3 collector/speculum.py # → http://127.0.0.1:8792/
For 24/7, run it as a systemd --user service:
cp collector/speculum.service ~/.config/systemd/user/
systemctl --user daemon-reload
systemctl --user enable --now speculum
journalctl --user -u speculum -f
The unit binds 127.0.0.1:8792 only, runs with CUDA_VISIBLE_DEVICES= (the
collector never touches the CUDA context — it reads nvidia-smi as one
long-lived subprocess) and a MemoryMax=64M ceiling. To view it off-box,
publish tailnet-only with tailscale serve.
The unit assumes the checkout is at ~/speculum — if yours lives elsewhere,
point ExecStart at it.
Configuration is optional: copy speculum.example.toml to
speculum.toml (repo root or ~/.config/speculum/) and edit. With no config
file, Speculum probes the default ports on localhost and shows what it finds.
The config sets the bind address/port, enables or disables discovery, sets the
history retention (30/60/90 days, or 0 to turn history off), and adds engine
adapters (ollama, vllm, lmstudio, unsloth, openai, custom) on any
host.
Demo — ?demo runs a seeded simulation with no backend at all; serve the
directory any way you like (e.g. python3 -m http.server 8792) and open
http://localhost:8792/?demo. The simulator fills exactly the same state
shape as live data, so the page is identical in behaviour.
How it works
nvidia-smi · /proc · llama-swap :9090 · NInfer backend · Strata :8080 · other engines
        │  (each optional; every poll degrades to "no data")
        ▼
collector/speculum.py   one Python 3 process, daemon poll threads,
                        one shared state under one lock
        │
        ├─ static files from the repo root
        ├─ GET /api/snapshot   one-shot full JSON
        └─ GET /api/stream     SSE: 1 Hz tick (hot values + new events/requests)
        ▼
app.js   EventSource with snapshot-poll fallback; paint loop; all panels
The collector keeps bounded in-memory buffers (60 min of GPU/host/KPI samples
at 1 Hz, the last 500 requests, the last 200 events), and collector/history.py
persists the long view into SQLite: per-request rows, minute/hour rollups,
model load spans and events, with daily pruning at the configured retention.
Long-range views (throughput, timeline, leaderboard beyond 1 h) are answered
from that database, so the page works across collector restarts.
Screenshots
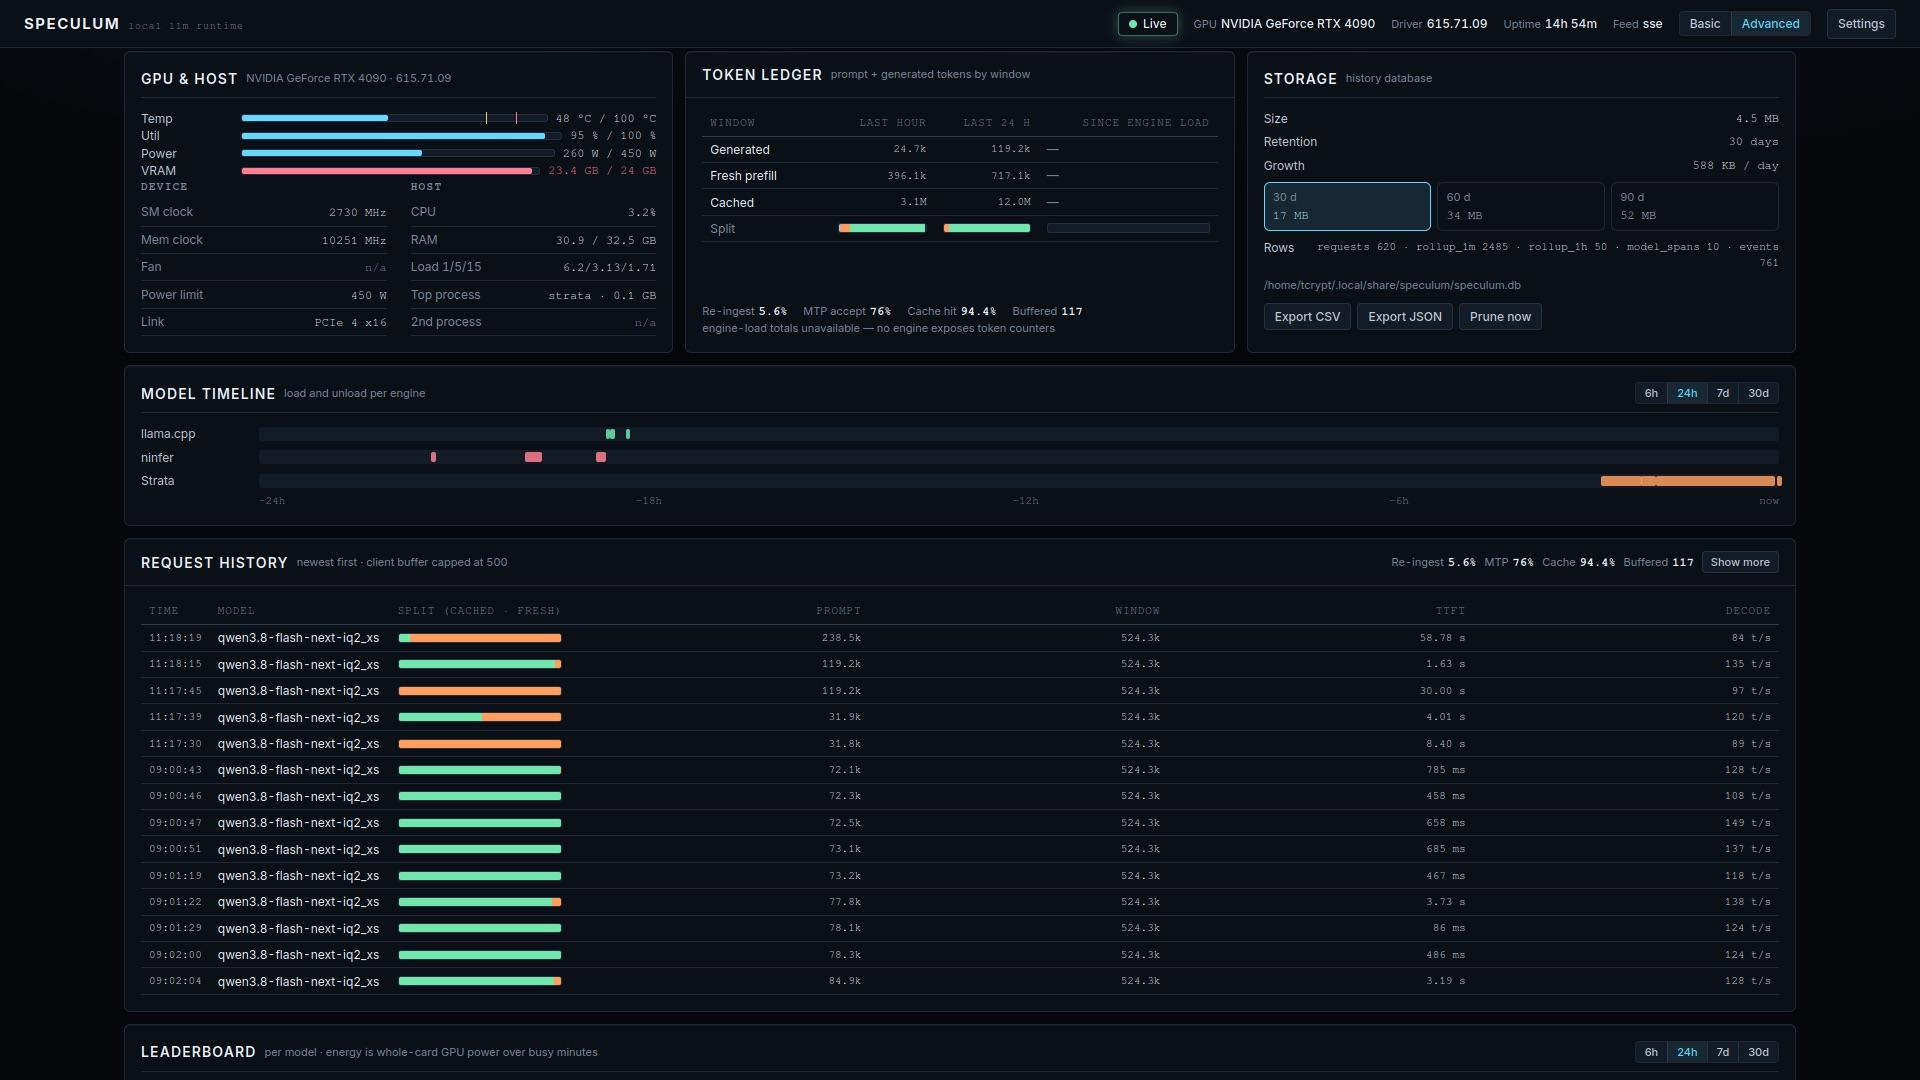
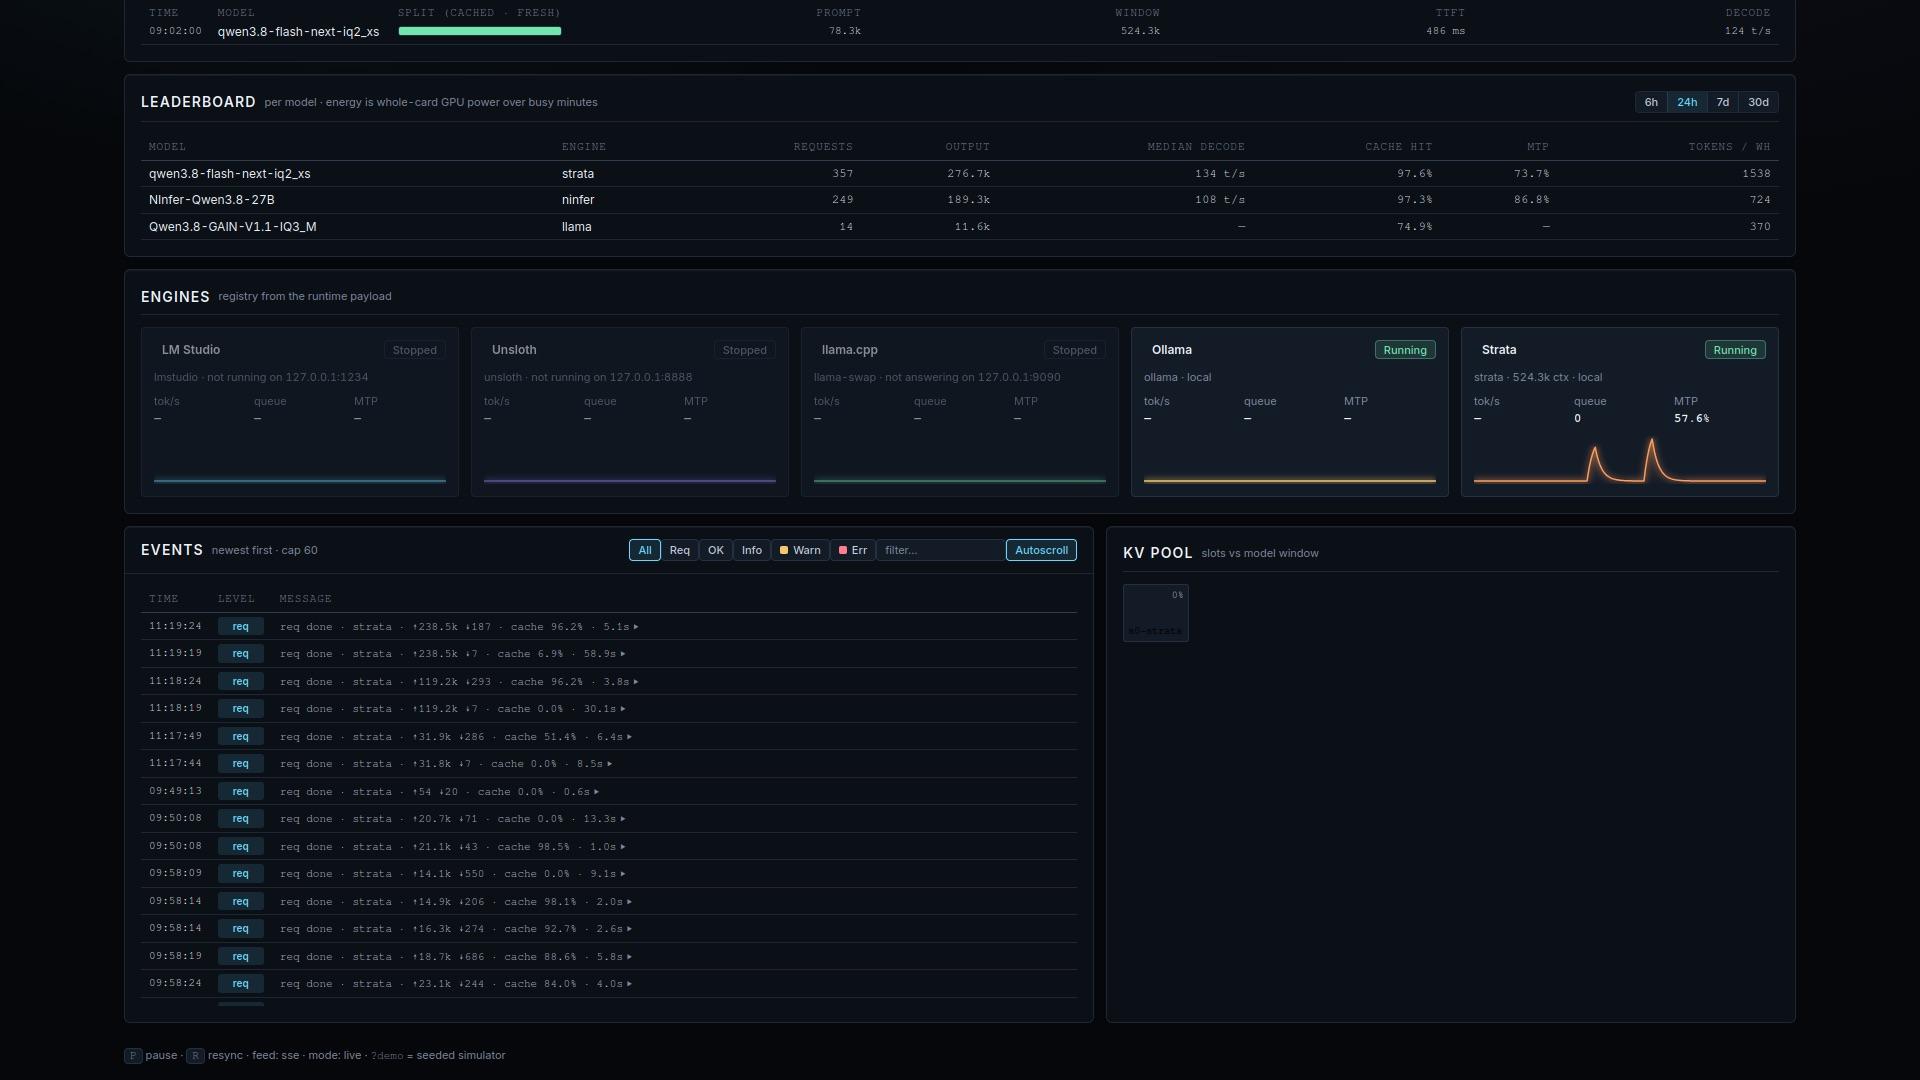
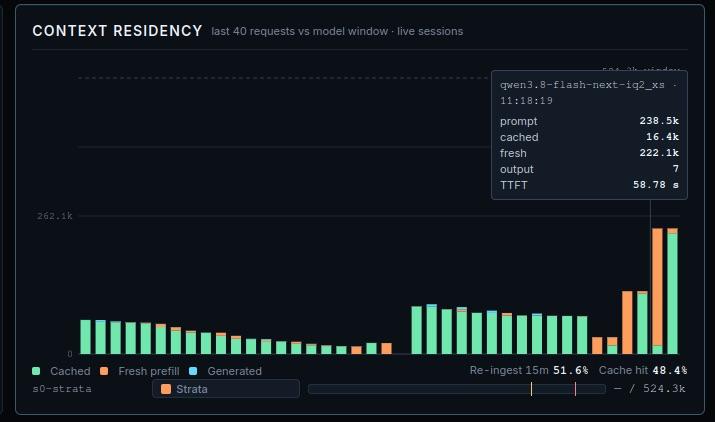
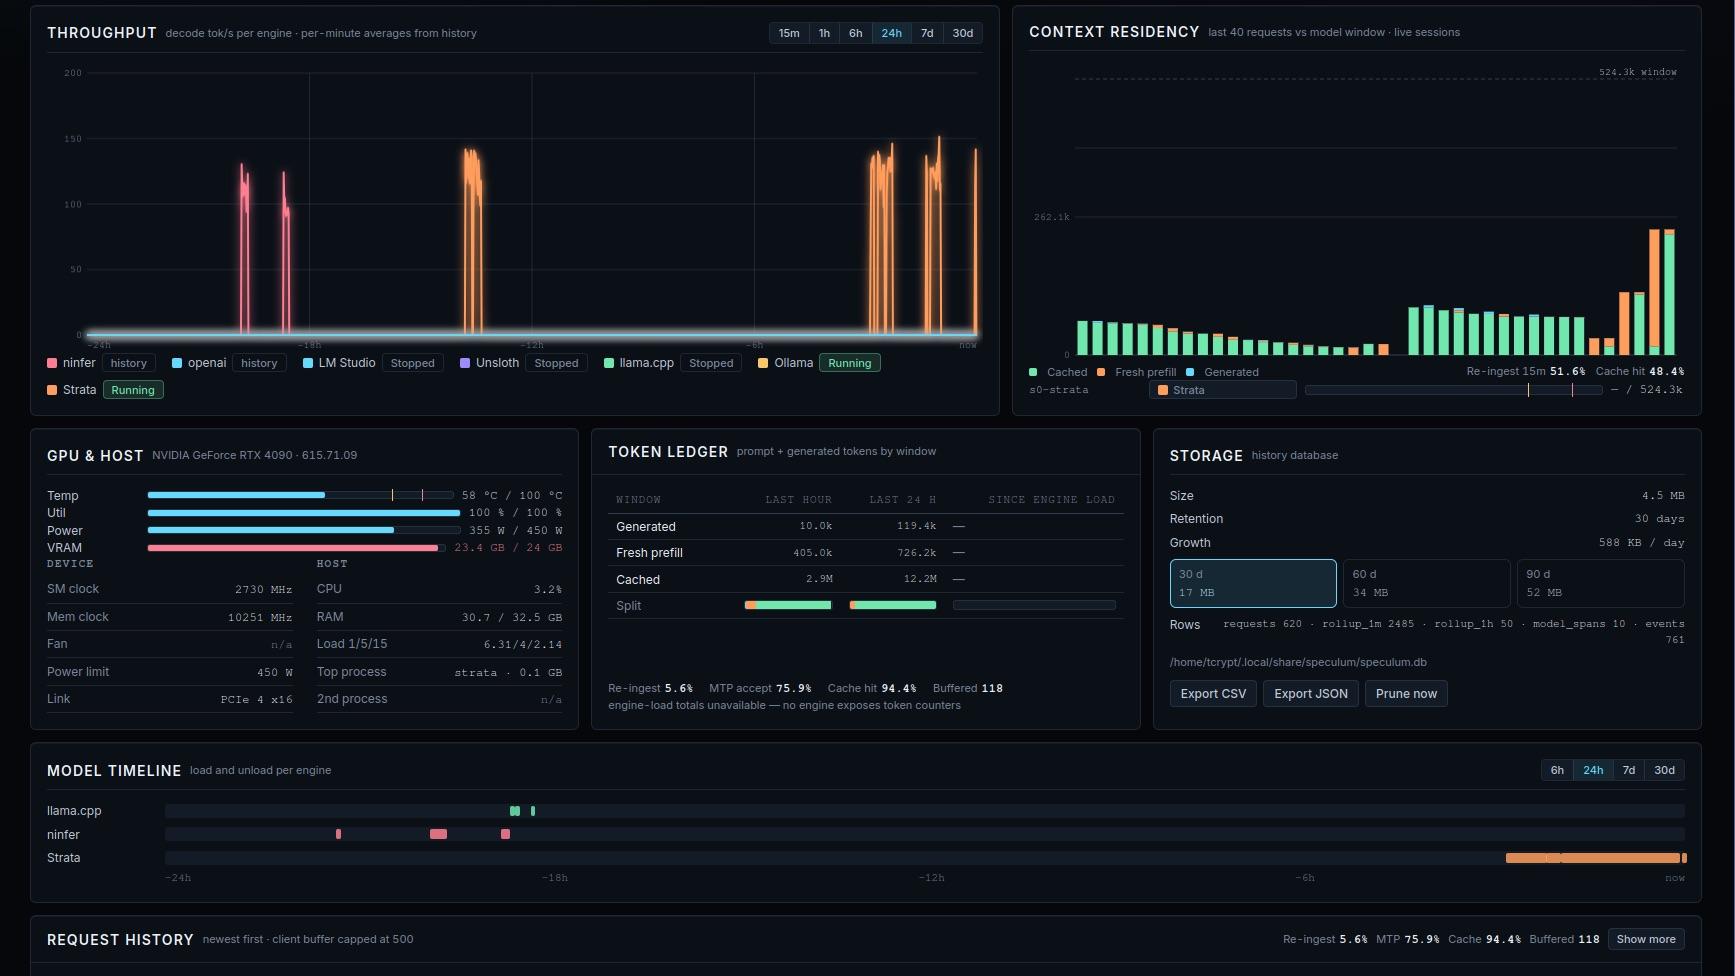
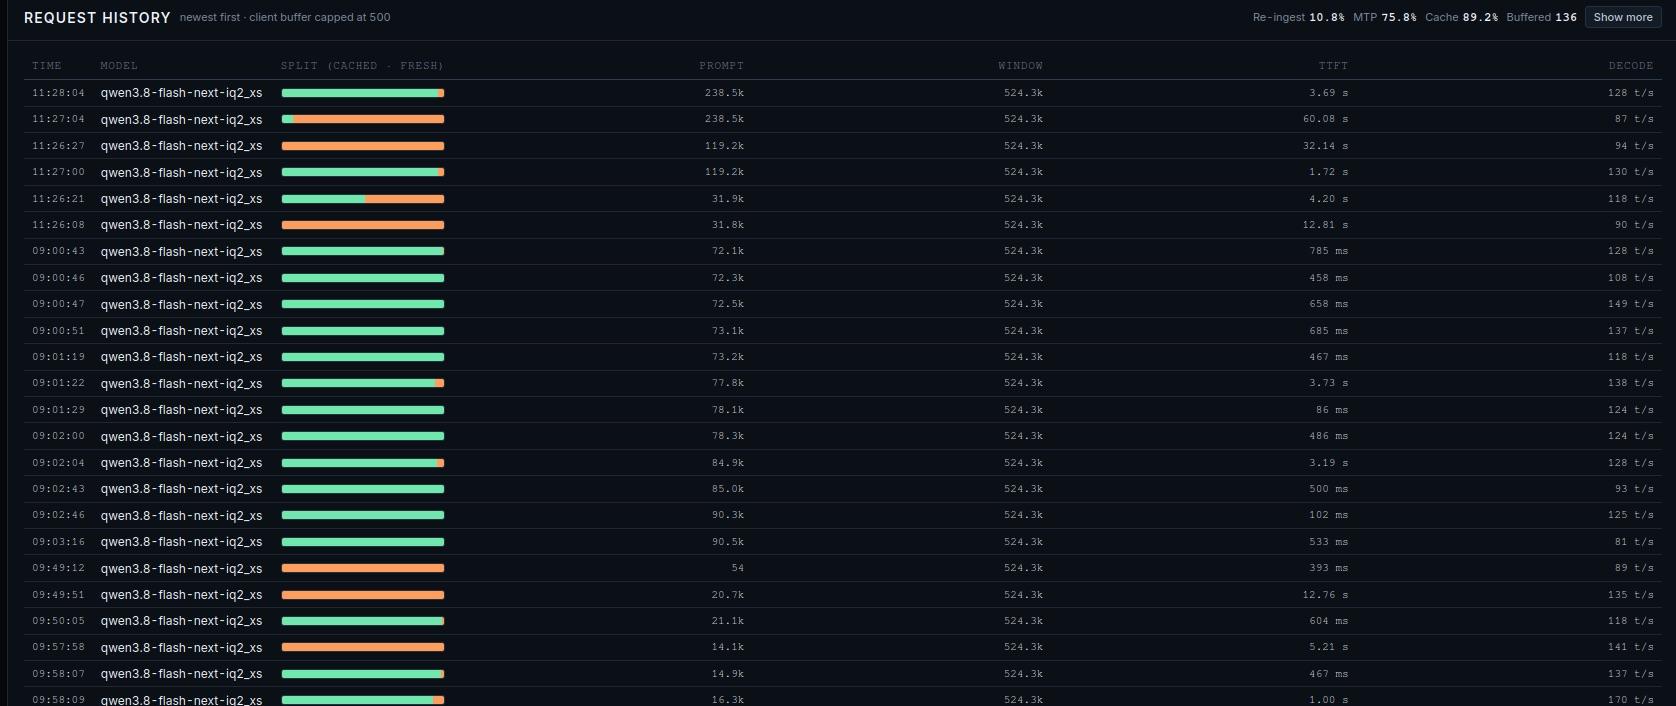
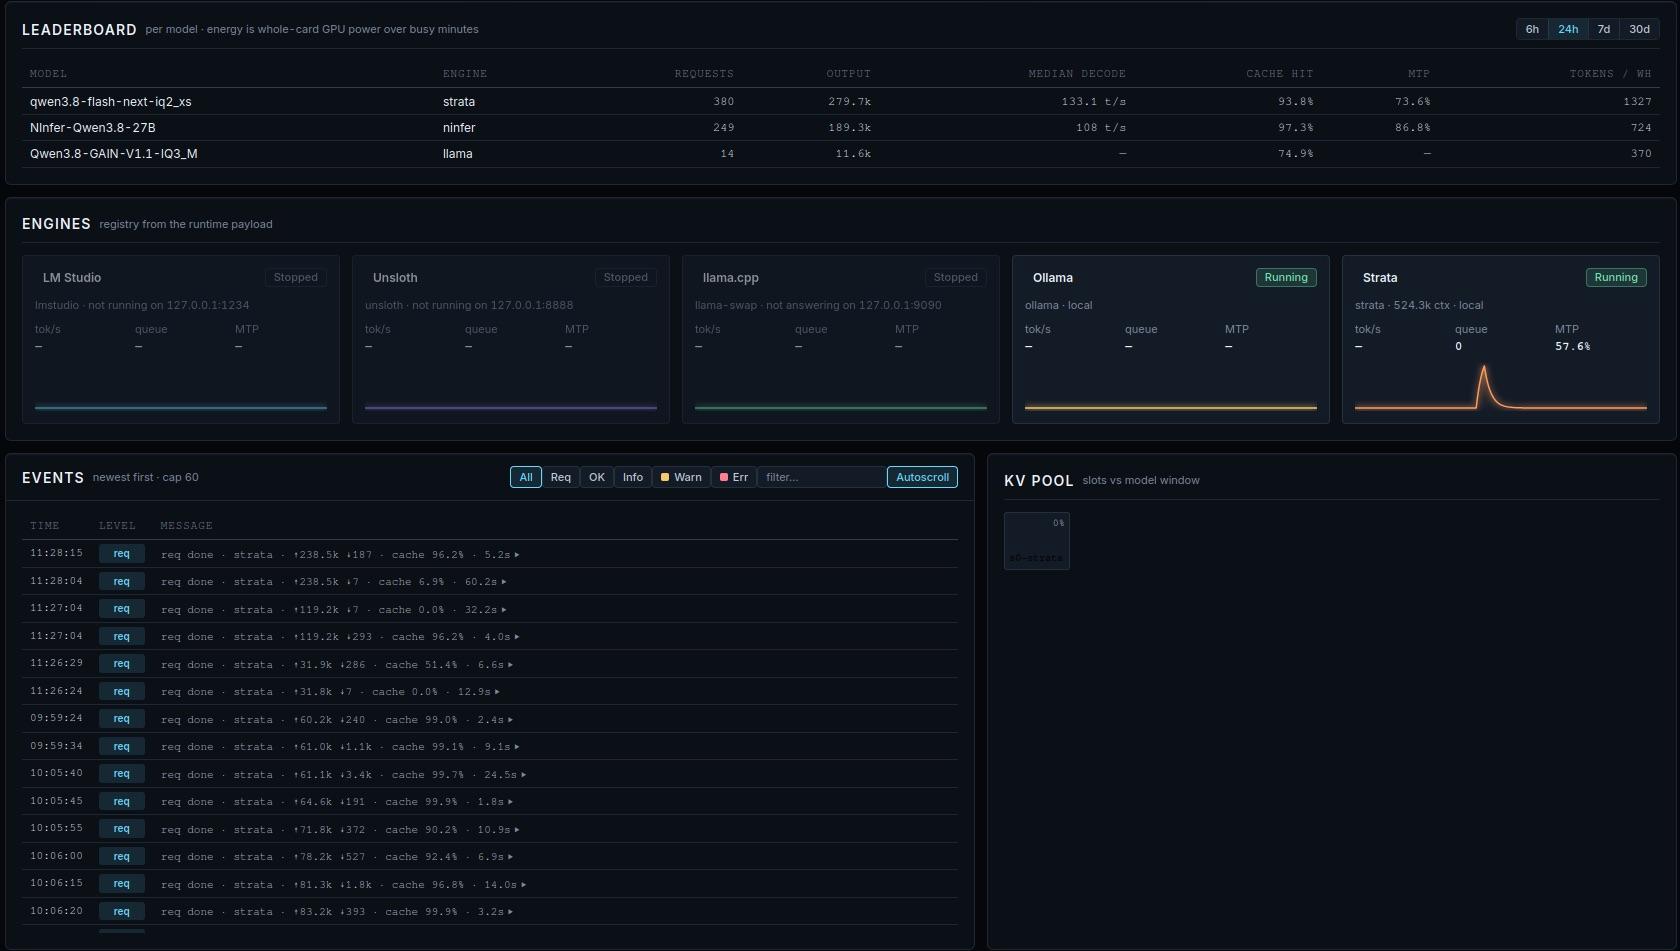
Captured live on the monitor box (dark theme; the settings menu also has a light theme).
What it watches
| Source | Feeds |
|---|---|
nvidia-smi (one long-lived -lms 1000 subprocess, read line by line) | GPU name/driver, temperature, utilisation, power, VRAM |
/proc/stat /proc/meminfo /proc/loadavg /proc/uptime | host CPU, RAM, load, uptime, top processes |
llama-swap :9090 (/running, /v1/models, /api/metrics/activity, /api/events) | models in use, per-request records (cached vs fresh prompt, outputs, TTFT), event stream |
NInfer backend (port from llama-swap /running, e.g. :5803) — /metrics, /slots, log stream | decode/prefill tok/s, KV slots, per-request TTFT/queue/prefill/decode/MTP, engine latch alerts |
Strata :8080 (/v1/models, /metrics, /slots) | second engine + context slots |
any engine from speculum.toml | same, via the pluggable adapters |
Panels
The top bar shows the overall state (Live / Degraded / Offline), GPU, driver, host uptime, feed type, the view toggle and the settings menu; an alert strip appears only while an alert is active (e.g. an engine latched red after a run of "service unavailable"). The deck then holds twelve panels:
| Panel | Shows |
|---|---|
| KPI | ten live KPIs in four groups — Throughput (decode rate, requests/min), Latency (first token, time/token, p95), Cache (cache hit, re-ingest tax, MTP acceptance), Capacity (VRAM, queue depth) — each with a 60-min sparkline and a delta vs 15 min ago |
| Throughput | rolling decode tok/s, one trace per engine, ranges 15 min → 30 d (beyond 1 h from the history DB) |
| GPU & host | horizontal meters for temp, utilisation, power draw and VRAM (warn/crit ticks from the real power limit and VRAM total), plus device readouts (SM/mem clock, fan, PCIe) and host (CPU, RAM, load, top processes) |
| Context | one bar per live session: prompt tokens vs the model window, with 75 % / 90 % ticks |
| Model timeline | which model was loaded on which engine over time (6 h → 30 d; spans survive collector restarts) |
| Token ledger | generated / fresh / cached token volume over the last hour, last 24 h and since engine start, with per-column mix bars |
| Storage | history database size, retention, what longer retention would cost; CSV export and prune-now |
| Requests | recent inferences: model, prompt vs window (cached vs fresh), window, TTFT, decode rate |
| Leaderboard | per-model requests, output tokens, median decode, cache hit, MTP and tokens per Wh (6 h → 30 d) |
| Engines | one card per engine: state, origin, window, backend, decode rate, queue, MTP, history sparkline; dimmed with a reason when stopped |
| Events | runtime event stream (request completions, engine lifecycle, warnings, alerts) with severity filters and pause-autoscroll |
| KV pool | one cell per live KV slot, fill = prompt tokens vs window |
Views. The top bar toggles Basic (KPI, throughput, GPU, timeline,
engines) and Advanced (everything); the choice is bookmarkable via
?view=basic|advanced. Settings (top-bar menu) persist in the browser:
theme (dark default / light), reduce motion (follows the OS preference, or
forced on/off), and the optional ripple effect (off by default).
Keys: P pause · R reseed (demo) / resync (live).
HTTP API
| Endpoint | Purpose |
|---|---|
GET /api/snapshot | one-shot full JSON (state + history) |
GET /api/stream | SSE: 1 Hz tick plus push events |
GET /api/history?range=… | rollup rows (minute/hour) |
GET /api/requests?range=… | raw request rows |
GET /api/spans?range=… | model load spans |
GET /api/leaderboard?range=… | per-model statistics |
GET /api/storage | database size, retention, projections |
GET /api/export?range=…&format=csv | CSV export |
POST /api/prune | apply retention now |
Files
| File | Role |
|---|---|
index.html | page shell: top bar, twelve panel shells, footer, one module script |
tokens.css · components.css · layout.css | design tokens (dark + light themes, WCAG AA) · UI primitives · layout — no framework, no build |
app.js | feed (SSE + poll fallback), ?demo simulator, paint loop, all panels |
ui.js · viewmodel.js · ripple.js | DOM primitives and formatters · pure view-model adapters · optional ripple effect |
collector/speculum.py | stdlib-only collector and HTTP server (Python 3, one process) |
collector/history.py | SQLite history: writer thread, rollups, spans, storage/export API |
collector/engines.py · collector/config.py | engine adapters + backoff scheduler · speculum.toml loader |
collector/speculum.service | systemd --user unit |
speculum.example.toml | example configuration |
smoke/ | Node DOM-stub smoke tests (no browser needed) |
LICENSE | MIT license |
Development
python3 -m py_compile collector/speculum.py    # collector parses
node smoke/ui-primitives.mjs                   # primitives + ripple state machine
node smoke/shell.mjs                           # boots the real app.js shell over real payload shapes
python3 -m http.server 8792                    # → http://localhost:8792/?demo (simulator)
The UI files are ES modules, so node --check does not apply to them; the
smoke scripts import and execute them, which is the parse-and-run check.
Demo values are deliberately invented — that is the simulator's job.
Origin
Speculum started on 2026-10-03 as a prototype generated in a single agent turn on a local model — one RTX 4090 box serving local models through llama-swap and NInfer — and has been iterated on that same box since.
License
MIT — see LICENSE.
Similar repos


Mirror-glass monitor for a local LLM runtime (llama-swap, NInfer, Strata) on one RTX 4090
Python
1
27 commits
updated Oct 5, 2026
See what people are saying
README
Speculum
A lightweight observability dashboard for a local LLM runtime.
Speculum runs on the box doing the work. It watches a local LLM stack — one GPU serving local models through llama-swap, plus engine backends such as NInfer or Strata (or Ollama, vLLM, LM Studio, Unsloth Studio, any OpenAI-compatible or custom endpoint) — and renders everything on one page, refreshed at 1 Hz:
- No build step, no dependencies. The front end is plain HTML, CSS and ES
modules; the collector is one Python 3 process using only the standard
library. Nothing to
pip install, nothing to compile. - No infrastructure. The only storage is an optional local SQLite file.
- Local by design. Binds
127.0.0.1only. Off-box viewing goes throughtailscale serve(tailnet-only) — never to the LAN or the public internet. - Honest degradation. Every source is optional. A down engine or backend shows as an honest "no data" — never a fabricated number, and never enough to take the page down.
Quick start
All you need is Python 3.9 or newer (3.11+ only if you use a TOML config file) — the collector is stdlib-only, so there is nothing to install.
Live — the collector serves the static files and the feed:
python3 collector/speculum.py # → http://127.0.0.1:8792/
For 24/7, run it as a systemd --user service:
cp collector/speculum.service ~/.config/systemd/user/
systemctl --user daemon-reload
systemctl --user enable --now speculum
journalctl --user -u speculum -f
The unit binds 127.0.0.1:8792 only, runs with CUDA_VISIBLE_DEVICES= (the
collector never touches the CUDA context — it reads nvidia-smi as one
long-lived subprocess) and a MemoryMax=64M ceiling. To view it off-box,
publish tailnet-only with tailscale serve.
The unit assumes the checkout is at ~/speculum — if yours lives elsewhere,
point ExecStart at it.
Configuration is optional: copy speculum.example.toml to
speculum.toml (repo root or ~/.config/speculum/) and edit. With no config
file, Speculum probes the default ports on localhost and shows what it finds.
The config sets the bind address/port, enables or disables discovery, sets the
history retention (30/60/90 days, or 0 to turn history off), and adds engine
adapters (ollama, vllm, lmstudio, unsloth, openai, custom) on any
host.
Demo — ?demo runs a seeded simulation with no backend at all; serve the
directory any way you like (e.g. python3 -m http.server 8792) and open
http://localhost:8792/?demo. The simulator fills exactly the same state
shape as live data, so the page is identical in behaviour.
How it works
nvidia-smi · /proc · llama-swap :9090 · NInfer backend · Strata :8080 · other engines
        │  (each optional; every poll degrades to "no data")
        ▼
collector/speculum.py   one Python 3 process, daemon poll threads,
                        one shared state under one lock
        │
        ├─ static files from the repo root
        ├─ GET /api/snapshot   one-shot full JSON
        └─ GET /api/stream     SSE: 1 Hz tick (hot values + new events/requests)
        ▼
app.js   EventSource with snapshot-poll fallback; paint loop; all panels
The collector keeps bounded in-memory buffers (60 min of GPU/host/KPI samples
at 1 Hz, the last 500 requests, the last 200 events), and collector/history.py
persists the long view into SQLite: per-request rows, minute/hour rollups,
model load spans and events, with daily pruning at the configured retention.
Long-range views (throughput, timeline, leaderboard beyond 1 h) are answered
from that database, so the page works across collector restarts.
Screenshots
Captured live on the monitor box (dark theme; the settings menu also has a light theme).
What it watches
| Source | Feeds |
|---|---|
nvidia-smi (one long-lived -lms 1000 subprocess, read line by line) | GPU name/driver, temperature, utilisation, power, VRAM |
/proc/stat /proc/meminfo /proc/loadavg /proc/uptime | host CPU, RAM, load, uptime, top processes |
llama-swap :9090 (/running, /v1/models, /api/metrics/activity, /api/events) | models in use, per-request records (cached vs fresh prompt, outputs, TTFT), event stream |
NInfer backend (port from llama-swap /running, e.g. :5803) — /metrics, /slots, log stream | decode/prefill tok/s, KV slots, per-request TTFT/queue/prefill/decode/MTP, engine latch alerts |
Strata :8080 (/v1/models, /metrics, /slots) | second engine + context slots |
any engine from speculum.toml | same, via the pluggable adapters |
Panels
The top bar shows the overall state (Live / Degraded / Offline), GPU, driver, host uptime, feed type, the view toggle and the settings menu; an alert strip appears only while an alert is active (e.g. an engine latched red after a run of "service unavailable"). The deck then holds twelve panels:
| Panel | Shows |
|---|---|
| KPI | ten live KPIs in four groups — Throughput (decode rate, requests/min), Latency (first token, time/token, p95), Cache (cache hit, re-ingest tax, MTP acceptance), Capacity (VRAM, queue depth) — each with a 60-min sparkline and a delta vs 15 min ago |
| Throughput | rolling decode tok/s, one trace per engine, ranges 15 min → 30 d (beyond 1 h from the history DB) |
| GPU & host | horizontal meters for temp, utilisation, power draw and VRAM (warn/crit ticks from the real power limit and VRAM total), plus device readouts (SM/mem clock, fan, PCIe) and host (CPU, RAM, load, top processes) |
| Context | one bar per live session: prompt tokens vs the model window, with 75 % / 90 % ticks |
| Model timeline | which model was loaded on which engine over time (6 h → 30 d; spans survive collector restarts) |
| Token ledger | generated / fresh / cached token volume over the last hour, last 24 h and since engine start, with per-column mix bars |
| Storage | history database size, retention, what longer retention would cost; CSV export and prune-now |
| Requests | recent inferences: model, prompt vs window (cached vs fresh), window, TTFT, decode rate |
| Leaderboard | per-model requests, output tokens, median decode, cache hit, MTP and tokens per Wh (6 h → 30 d) |
| Engines | one card per engine: state, origin, window, backend, decode rate, queue, MTP, history sparkline; dimmed with a reason when stopped |
| Events | runtime event stream (request completions, engine lifecycle, warnings, alerts) with severity filters and pause-autoscroll |
| KV pool | one cell per live KV slot, fill = prompt tokens vs window |
Views. The top bar toggles Basic (KPI, throughput, GPU, timeline,
engines) and Advanced (everything); the choice is bookmarkable via
?view=basic|advanced. Settings (top-bar menu) persist in the browser:
theme (dark default / light), reduce motion (follows the OS preference, or
forced on/off), and the optional ripple effect (off by default).
Keys: P pause · R reseed (demo) / resync (live).
HTTP API
| Endpoint | Purpose |
|---|---|
GET /api/snapshot | one-shot full JSON (state + history) |
GET /api/stream | SSE: 1 Hz tick plus push events |
GET /api/history?range=… | rollup rows (minute/hour) |
GET /api/requests?range=… | raw request rows |
GET /api/spans?range=… | model load spans |
GET /api/leaderboard?range=… | per-model statistics |
GET /api/storage | database size, retention, projections |
GET /api/export?range=…&format=csv | CSV export |
POST /api/prune | apply retention now |
Files
| File | Role |
|---|---|
index.html | page shell: top bar, twelve panel shells, footer, one module script |
tokens.css · components.css · layout.css | design tokens (dark + light themes, WCAG AA) · UI primitives · layout — no framework, no build |
app.js | feed (SSE + poll fallback), ?demo simulator, paint loop, all panels |
ui.js · viewmodel.js · ripple.js | DOM primitives and formatters · pure view-model adapters · optional ripple effect |
collector/speculum.py | stdlib-only collector and HTTP server (Python 3, one process) |
collector/history.py | SQLite history: writer thread, rollups, spans, storage/export API |
collector/engines.py · collector/config.py | engine adapters + backoff scheduler · speculum.toml loader |
collector/speculum.service | systemd --user unit |
speculum.example.toml | example configuration |
smoke/ | Node DOM-stub smoke tests (no browser needed) |
LICENSE | MIT license |
Development
python3 -m py_compile collector/speculum.py    # collector parses
node smoke/ui-primitives.mjs                   # primitives + ripple state machine
node smoke/shell.mjs                           # boots the real app.js shell over real payload shapes
python3 -m http.server 8792                    # → http://localhost:8792/?demo (simulator)
The UI files are ES modules, so node --check does not apply to them; the
smoke scripts import and execute them, which is the parse-and-run check.
Demo values are deliberately invented — that is the simulator's job.
Origin
Speculum started on 2026-10-03 as a prototype generated in a single agent turn on a local model — one RTX 4090 box serving local models through llama-swap and NInfer — and has been iterated on that same box since.
License
MIT — see LICENSE.