
Real-time hardware and LLM inference monitoring — GPU, CPU, memory, and vLLM metrics streamed to a dashboard.
TypeScript
121
212 commits
updated Sep 10, 2026
README
Spark Dashboard
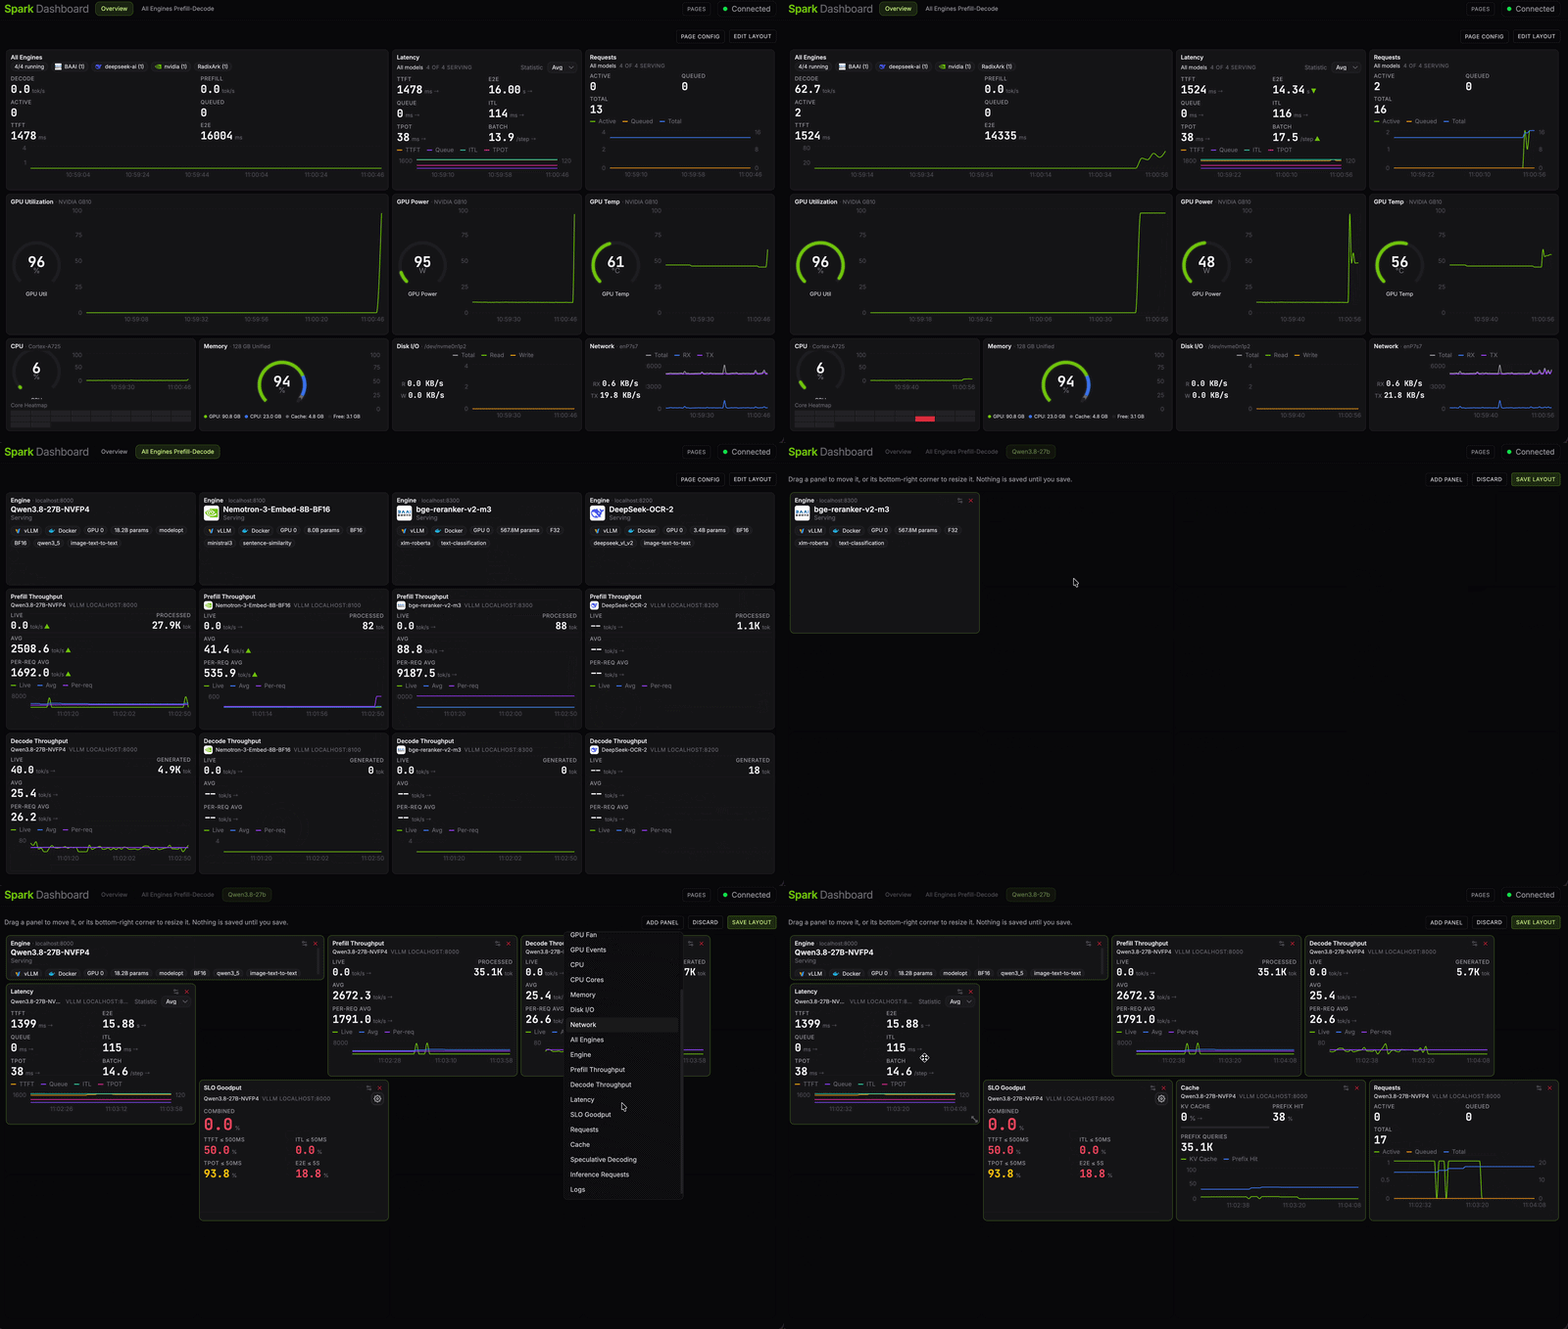
Real-time hardware and LLM inference monitoring for Linux systems with NVIDIA GPUs. Developed and tested on the NVIDIA DGX Spark, but works on any Linux host with NVIDIA drivers — discrete-GPU workstations, DGX boxes, cloud VMs. A Rust backend collects GPU, CPU, memory, disk, and network metrics alongside vLLM engine statistics and streams them over WebSocket to a React frontend.




Quick Start
Install on your Linux host
Run as your normal user on any Linux host with NVIDIA drivers (requires Rust 1.95+):
cargo install spark-dashboard
sudo ~/.cargo/bin/spark-dashboard service install
systemctl status spark-dashboard
The dashboard is now served on port 3000. See Install on your Linux host for the full guide, config overrides, and uninstall.
Run with Docker
Prefer containers? Run the published multi-arch image (needs the NVIDIA Container Toolkit):
docker run --rm --gpus all --pid=host -p 3000:3000 \
  -v /var/run/docker.sock:/var/run/docker.sock:ro \
  -v spark-dashboard-state:/var/lib/spark-dashboard \
  --group-add "$(getent group docker | cut -d: -f3)" \
  ghcr.io/niklasfrick/spark-dashboard:latest
--group-add puts the container in the host's docker group so it can read the
mounted socket and discover vLLM containers. Skip it (or get the GID wrong)
and engine discovery silently falls back to host processes only — containerized
engines won't appear. The named volume keeps saved dashboards across container
replacement; without it they die with the container.
Or with Compose (host networking + GPU + socket mount preconfigured):
curl -fsSLO https://raw.githubusercontent.com/niklasfrick/spark-dashboard/main/deploy/docker/docker-compose.yml
curl -fsSL https://raw.githubusercontent.com/niklasfrick/spark-dashboard/main/deploy/docker/.env.docker.example -o .env
# set DOCKER_GID to your host's docker group: getent group docker | cut -d: -f3
docker compose up -d
See deploy/docker/docker.md for networking modes, GPU
passthrough, env vars, and troubleshooting.
Develop locally
git clone https://github.com/niklasfrick/spark-dashboard.git
cd spark-dashboard
cp dev/.env.example .env           # edit with your remote host's user/host
./dev/dev.sh
Open http://localhost:5173 in your browser. See dev/README.md
for details on what each script does.
Features
Hardware Monitoring (1s polling via NVML, sysinfo, procfs)
- GPU utilization, temperature, power draw, clock frequencies, fan speed
- GPU event detection — thermal throttling, hardware slowdown, power brake
- CPU aggregate and per-core utilization with heatmap
- Memory breakdown — CPU RAM and GPU VRAM separately on discrete-GPU hosts, or a single unified pool on systems where CPU and GPU share memory (e.g. DGX Spark GB10, GH200)
- Disk and network I/O throughput
LLM Engine Monitoring (vLLM via Prometheus metrics)
- Tokens per second (generation + prompt)
- Time to first token, inter-token latency, end-to-end latency, queue time
- Active/queued requests, batch size
- KV cache utilization, prefix cache hit rate
- Automatic engine discovery via process scan and Docker API
- SLO Goodput
Multi-Engine Support
- Run and monitor any number of inference engines side by side — each vLLM process or container is detected automatically
- Every engine panel follows the page's engine selection by default, so one layout works whether the host runs one engine or four
- Pin a panel to a specific engine to watch two of them at once; a pinned panel whose engine is gone says so and keeps its place rather than silently showing a different one
- With several engines on a host, each panel names the one it is showing and marks the provider of the model it is serving
Dashboard (arranged by you, stored on the server)
Not a fixed layout with a few toggles: every metric is a panel you place, and a page is whatever set of panels you choose to put on it.
- Edit mode — Edit layout to drag, resize, add and remove; live motion freezes while you work, and Save layout or Discard ends the session. Outside it panels are fully interactive and never move
- A palette of every metric — click a type and it lands in the first free slot; in edit mode, click a panel's frame to take it off the page again
- Named pages, each with its own URL — a training view and an idle health view kept side by side rather than one compromise. Point a wall display at a page's URL and it returns to that page after a reboot
- Per-page model selection — a page can show one engine, every engine combined, or whatever the host happens to be serving. See Configuring what a page shows
- Per-panel settings — retitle it, choose its time window (5m / 10m / 15m), or pin it to a specific GPU or engine instead of following the page
- Fits the viewport on desktop with no scrolling; stacks into one column on a phone, derived from your desktop arrangement rather than authored twice
- Saved on the server, shared by everyone who opens the instance, and outliving restarts, upgrades and container replacement
- 15-minute rolling history with circular buffers, arc gauges, time-series charts, per-core heatmap
- Connection status badge, staleness detection, auto-reconnect
Every panel the palette offers:
| Group | Binds to | Panels |
|---|---|---|
| Per-GPU hardware | One GPU, by NVML index | GPU Utilization, GPU Temp, GPU Power, GPU Clock, GPU Memory, GPU Fan, GPU Events |
| Host-wide hardware | Nothing | CPU, CPU Cores, Memory, Disk I/O, Network |
| Engines | One engine, by endpoint | Engine, Prefill Throughput, Decode Throughput, Latency, SLO Goodput, Requests, Cache, Speculative Decoding, Inference Requests, Logs |
| Engines | Nothing — every engine at once | All Engines |
Architecture
┌──────────────────────┐         WebSocket (JSON)         ┌────────────────────┐
│     Rust Backend     │ ──────────────────────────────▶  │  React Frontend    │
│                      │                                  │                    │
│  Tokio tasks:        │                                  │  useMetrics hook   │
│  ├─ metrics_collector│  broadcast channel (capacity 16) │  ├─ WebSocket conn │
│  │  (GPU/CPU/mem/…) ─┼──▶ tx ──▶ ws_handler ──▶ client  │  ├─ batch flush 2s │
│  └─ engine_collector │                                  │  └─ circular bufs  │
│     (vLLM/Docker)    │                                  │                    │
│                      │  Static files (rust-embed)       │  Recharts, Tailwind│
│  Axum router         │ ◀──── production only ─────────  │  shadcn/ui         │
└──────────────────────┘                                  └────────────────────┘
  Linux host (e.g. DGX Spark)                                  Browser
Two independent Tokio tasks run in parallel — one for hardware metrics (NVML,
sysinfo, procfs) and one for engine detection/polling. Both feed into a
broadcast channel that fans out to all connected WebSocket clients. In
production the frontend is embedded in the binary via rust-embed; in
development, Vite serves the frontend locally and proxies API/WebSocket
traffic to the remote backend.
Configuration
All operator config lives in a repo-root .env file. Copy the template and
edit:
cp dev/.env.example .env
| Variable | Purpose |
|---|---|
DEPLOY_USER | SSH user on the remote host (required) |
DEPLOY_HOST | Hostname or IP of the remote host (required) |
DEPLOY_DIR | Project path on the remote host, relative to remote home (default spark-dashboard) |
VITE_BACKEND_URL | Where Vite proxies /ws and /api (default http://localhost:3000) |
Legacy SPARK_USER / SPARK_HOST / SPARK_DIR are still accepted as a
fallback when DEPLOY_* are unset — dev.sh prints a one-line deprecation
note. The scripts in dev/ source this file; Vite picks up VITE_* variables
automatically. .env is gitignored — never commit it.
Install on your Linux host
The dashboard runs as a supervised systemd service. Two install paths; both
build from source on the host.
Option A — via cargo (recommended)
# On the host. Requires Rust 1.95+, NVIDIA drivers, and internet access.
cargo install spark-dashboard
sudo ~/.cargo/bin/spark-dashboard service install
systemctl status spark-dashboard
cargo install pulls the crate from crates.io
and compiles it locally. service install copies the binary to
/usr/local/bin, creates a locked-down spark-dashboard system user (added
to video, render, docker groups for NVML and Docker access), writes the
systemd unit, and enables it.
Why the explicit
~/.cargo/bin/path?cargo installdrops the binary in~/.cargo/bin, which isn't onsudo's sanitizedsecure_pathand isn't always on the user's interactive PATH either (depends on how Rust was installed). Passing the absolute path makes the command work regardless. Afterservice installcopies the binary to/usr/local/bin, subsequentsudo spark-dashboard …calls (e.g.service status,service uninstall) resolve normally.
Option B — from a local checkout
Use this when you want to install without crates.io (audit the source, air-gapped install, or deploy an unreleased commit).
# On the host. Run as your normal user — the script escalates to sudo
# only for the systemd wiring step.
git clone https://github.com/niklasfrick/spark-dashboard.git
cd spark-dashboard
./deploy/host/install.sh
This builds the frontend (npm run build) and the Rust binary
(cargo build --release), then hands off to the same service install
logic as Option A. You'll be prompted for your sudo password once, when
the service is installed.
Managing the service
sudo systemctl {start|stop|restart} spark-dashboard
journalctl -u spark-dashboard -f          # follow logs
sudo spark-dashboard service status       # same as `systemctl status`
Optional overrides live in /etc/spark-dashboard/config.env — set
SPARK_DASHBOARD_PORT, SPARK_DASHBOARD_BIND, SPARK_DASHBOARD_POLL_INTERVAL,
SPARK_DASHBOARD_GPU_INDEX, SPARK_DASHBOARD_STATE_DIR,
SPARK_DASHBOARD_PROVIDER_API_KEY, or RUST_LOG, then
sudo systemctl restart spark-dashboard.
Upgrade
# Option A
cargo install --force spark-dashboard && sudo ~/.cargo/bin/spark-dashboard service install

# Option B
cd spark-dashboard && git pull && ./deploy/host/install.sh
Re-running service install is idempotent: it stops the service, swaps the
binary, and starts it again, preserving /etc/spark-dashboard/config.env.
Uninstall
sudo spark-dashboard service uninstall         # keep /etc/spark-dashboard
sudo spark-dashboard service uninstall --purge # also remove /etc/spark-dashboard
Neither form touches /var/lib/spark-dashboard, so saved dashboards survive an
uninstall/reinstall cycle. Remove that directory by hand to start clean.
CLI options
spark-dashboard [OPTIONS]                 run the server (default)
spark-dashboard service install [--prefix /usr/local]
spark-dashboard service uninstall [--purge]
spark-dashboard service status

  -p, --port <PORT>           Listen port [default: 3000] [env: SPARK_DASHBOARD_PORT]
  -b, --bind <BIND>           Bind address [default: 0.0.0.0] [env: SPARK_DASHBOARD_BIND]
      --poll-interval <MS>    Polling interval ms [default: 1000] [env: SPARK_DASHBOARD_POLL_INTERVAL]
      --state-dir <DIR>       Directory for saved state [default: /var/lib/spark-dashboard] [env: SPARK_DASHBOARD_STATE_DIR]
      --gpu-index <IDX>       Optional NVML GPU index to monitor [env: SPARK_DASHBOARD_GPU_INDEX]
      --simulate-gpus <N>     Append N fictive GPUs with simulated data (dev aid) [env: SPARK_DASHBOARD_SIMULATE_GPUS]
      --engine <TYPE>         Manual engine type (e.g. vllm) [env: SPARK_DASHBOARD_ENGINE]
      --engine-url <URL>      Manual engine endpoint (requires --engine) [env: SPARK_DASHBOARD_ENGINE_URL]
      --engine-api-key <KEY>  API key for an endpoint, paired by index with --engine-url [env: SPARK_DASHBOARD_ENGINE_API_KEY]
      --provider-api-key <KEY> Fallback API key for any endpoint [env: SPARK_DASHBOARD_PROVIDER_API_KEY]
      --enable-log-viewer     Stream engine container logs at /ws/logs (Linux only, off by default) [env: SPARK_DASHBOARD_ENABLE_LOG_VIEWER]
On multi-GPU hosts, Spark Dashboard monitors all available NVIDIA GPUs by
default. Use --gpu-index to focus on one device. Engines are auto-detected via
process scan and Docker API. Use --engine and --engine-url to override when
auto-detection doesn't work. For a host-systemd installation, put the same
values in /etc/spark-dashboard/config.env as SPARK_DASHBOARD_ENGINE and
SPARK_DASHBOARD_ENGINE_URL; comma-separated engine and URL values are paired
by position.
For auth-gated deployments (e.g. vLLM started with --api-key), pass
--engine-api-key (index-paired with --engine-url) or set
SPARK_DASHBOARD_PROVIDER_API_KEY as a global fallback covering auto-detected
engines too. Model info is resolved from /v1/models once and cached —
re-resolved only on engine restart or every 10 minutes — so an auth-gated
engine is no longer hit on every poll tick.
Dashboard configuration API
The dashboard configuration is a single document shared by everyone who opens
the instance, stored at <state-dir>/dashboards.json. The server keeps it as
opaque bytes — it never parses or validates the contents, and enforces only a
1 MiB size cap. Writes are atomic, and last write wins.
Both deployments arrange for <state-dir> to be /var/lib/spark-dashboard, the
binary's default:
| Deployment | Where it lives | Provided by |
|---|---|---|
| systemd | /var/lib/spark-dashboard | the unit's StateDirectory= grant, created and chowned to the service user on start |
| Docker | the spark-dashboard-state volume | the Compose named volume; survives everything short of down -v |
The document therefore outlives restarts, upgrades and container replacement.
Override the location with --state-dir / SPARK_DASHBOARD_STATE_DIR — under
systemd that also needs a unit override, since ProtectSystem=strict leaves the
granted state directory the only writable path.
Backing it up is copying the file. There is deliberately no import/export feature; the location is documented instead, so an operator can copy a configuration to another host or keep a snapshot before experimenting:
# systemd
sudo cp /var/lib/spark-dashboard/dashboards.json ~/dashboards.backup.json
sudo systemctl stop spark-dashboard                                   # restore
sudo install -o spark-dashboard -g spark-dashboard -m 644 \
  ~/dashboards.backup.json /var/lib/spark-dashboard/dashboards.json
sudo systemctl start spark-dashboard

# Docker — see deploy/docker/docker.md for the volume commands
Stop the service first so the copy cannot land under a write, and reload any open dashboard afterwards: a browser still holding the pre-restore document would put it straight back on its next save.
The document's format is internal and subject to change. It is the frontend's own versioned state, not a stable contract (ADR-0002) — copy the file whole, don't generate or hand-edit it. A document written by a newer build is refused by an older one, which falls back to the default preset with a banner rather than failing.
GET    /api/dashboard   the document, or 204 when none is stored
PUT    /api/dashboard   replaces it wholesale (204 on success)
DELETE /api/dashboard   removes it, resetting to the default preset (204)
204 on read means "nothing saved" rather than an error — a fresh install and
a reset look identical, and the dashboard renders its default preset for both.
A write over the cap is rejected with 413, leaving the stored document
untouched.
Every response carries x-spark-dashboard-read-only. It is true when the
state directory was not writable at startup, in which case reads still work,
writes are refused with 503, and the dashboard shows a read-only banner
instead of pretending a save succeeded. A write that fails for some other
reason — a full disk, say — returns 500 and leaves the header false.
curl -i localhost:3000/api/dashboard                       # read
curl -X PUT localhost:3000/api/dashboard -d '{"pages":[]}' # save
curl -X DELETE localhost:3000/api/dashboard                # reset
Unmatched paths under /api return 404 rather than the app shell.
Dashboard pages and kiosk URLs
A configuration holds any number of named pages — separate arrangements of panels, kept side by side rather than one being chosen permanently. They are created, renamed and deleted from the Pages menu in the header, and switched between from the tabs beside it; tabs that do not fit the header move into an overflow menu rather than pushing it out of shape.
Each page has its own URL, built from a stable id plus a readable slug:
/pages/<id>            e.g. /pages/overview
/pages/<id>/<slug>     e.g. /pages/overview/wall-display
The id is fixed when the page is created and never changes again; the slug is whatever the page is called now, and is omitted when it would only repeat the id. The second example above is the page created as Overview and since renamed to Wall Display.
Only the id is matched — the slug is decoration. Renaming a page rewrites the slug and leaves the id alone, so a kiosk browser or a bookmark pointed at the old URL still lands on the same page. Pointing a wall display at one page's URL is what makes it come back to that page after a reboot with no interaction.
Resetting is two-tiered: deleting a single page from the Pages menu takes that
page only, while Reset everything asks for confirmation and then removes the
stored document outright — which is the same DELETE /api/dashboard above, and
leaves the dashboard rendering its default preset. The dashboard always keeps at
least one page, so the last one cannot be deleted; resetting is the way to start
over.
Configuring what a page shows
Panels do not each carry their own engine. A panel is created following the page, and the page answers what it follows — which is what lets one saved arrangement be correct on a laptop running a single engine and on a server running four.
You choose that answer from Page config, beside Edit layout in the header:
| Choice | What following panels show |
|---|---|
| Automatic | Whatever the host is serving — the first running engine. What every page starts as, and what the shipped preset uses |
| One model | That engine, named by its endpoint, for as long as the page exists — a Qwen page that opens on Qwen for every colleague and every kiosk |
| All models | Every engine at once, combined: throughput and counters sum, latencies are request-weighted means. A panel rendering the combination says so, since a combined figure wearing one engine's name would misread |
Two things this is not:
- Not part of an edit session. Choosing what a page shows is a deliberate, named request like renaming a page, so it is written the moment you choose it — no Save layout required, and no need to open a session first.
- Not binding on pinned panels. A panel pinned to a specific engine goes on showing that engine whatever the page says. Pin one panel and leave the rest following, and a page shows a chosen engine beside the aggregate.
Per-engine things never aggregate: logs, engine identity, and anything pinned address one engine by endpoint. An engine that has gone away is still offered as a choice and marked as absent rather than hidden — hiding it is how a page silently ends up showing something else — and a pinned panel whose engine is gone keeps its slot and says the target is missing.
Log viewer (--enable-log-viewer, Linux only, opt-in)
--enable-log-viewer (or the SPARK_DASHBOARD_ENABLE_LOG_VIEWER=1 env var)
registers an extra /ws/logs WebSocket endpoint that streams the tracked
engine container's Docker logs directly to the dashboard, using the bollard
Docker API (no docker CLI or shell required — works in distroless images).
- Off by default. Nothing is exposed unless the flag is passed.
/ws/logsis unauthenticated. The dashboard binds0.0.0.0by default and the WebSocket has no auth layer, so anyone who can reach the port can read the stream.- Engine logs can contain sensitive data. Inference-engine logs commonly
include prompts, request payloads, and API keys passed on the command line.
Treat the endpoint as equivalent to
docker logsaccess. - Recommendation: only enable on trusted networks. Put the dashboard behind
a reverse proxy with auth, bind to
127.0.0.1/--bind 127.0.0.1, or restrict the port with a firewall. Do not enable on a public-facing host.
Logs are a panel, added from the palette and bound to an engine like any other engine panel — following the page's selection, or pinned to one engine so two log panels can watch two engines side by side. The default preset places none; add one when you want it. (Before 0.14.0 this was a fixed drawer at the bottom of the page that followed the selected engine tab.)
The panel passes its resolved engine's endpoint as /ws/logs?engine=<endpoint>,
which is validated against the tracked engine state — only containers the
dashboard knows as engines can be streamed. Per container, one background Docker
log stream fans out to every panel watching it (same pattern as metrics) and
stops when the last viewer disconnects. stdout and stderr are line-buffered so
split frames don't produce partial lines.
Development
Prerequisites
- Local machine (macOS or Linux): Node.js 20+, npm, rsync, ssh
- Remote host: Linux + NVIDIA drivers, Rust 1.95+, SSH access with key-based auth (no password prompts)
- Optional:
brew install fswatchfor instant file-change detection (the watcher falls back to 2s polling without it)
Running the dev environment
./dev/dev.sh
The script handles everything:
- Syncs the full project to the remote host via rsync
- Builds the Rust backend on the remote host (
cargo build --release) - Starts the backend on the remote host (port 3000)
- Starts the Vite dev server locally (port 5173)
- Watches
src/andCargo.tomlfor Rust changes — auto-syncs and rebuilds on the remote host
| What you edit | What happens |
|---|---|
Frontend files (frontend/src/) | Vite hot-reloads instantly in the browser |
Backend files (src/, Cargo.toml) | Auto-detected → rsync to remote host → rebuild → restart (~compile time) |
Useful while dev.sh is running:
# Watch backend logs in another terminal
ssh "${DEPLOY_USER}@${DEPLOY_HOST}" tail -f /tmp/spark-dashboard.log

# Press Ctrl+C in the dev.sh terminal to stop everything (cleans up the remote process too)
How the proxy works
By default, Vite proxies /ws and /api to localhost:3000 — this works out
of the box with any SSH tunnel that maps the remote host's port 3000 to your
local machine.
Browser → localhost:5173/ws  → Vite proxy → localhost:3000/ws (forwarded to remote)
Browser → localhost:5173/api → Vite proxy → localhost:3000/api (forwarded to remote)
To connect directly over the network instead, set in .env:
VITE_BACKEND_URL=http://${DEPLOY_HOST}:3000
The frontend connects to the WebSocket using window.location.host, so the
proxy is transparent — no code changes between dev and production.
Releases
Releases are cut from main via release-please —
conventional commits drive the version bump, merging the release PR tags
vX.Y.Z and triggers cargo publish to crates.io. main always reflects
the latest stable version; see CHANGELOG.md for release notes.
Testing
# Frontend (jsdom)
cd frontend && npm test

# Frontend layout-dependent specs (headless chromium)
cd frontend && npx playwright install chromium && npm run test:browser

# Backend (on Linux)
cargo test
Backend tests include platform-aware stubs — GPU and memory tests validate real NVML/procfs parsing on Linux, with compile-time stubs on other platforms.
Project Structure
├── src/
│   ├── main.rs                 CLI args, task spawning, server startup
│   ├── server.rs               Axum router, static file serving
│   ├── ws.rs                   WebSocket handler
│   ├── metrics/
│   │   ├── mod.rs              MetricsSnapshot, collector loop
│   │   ├── gpu.rs              NVML GPU metrics + event detection
│   │   ├── cpu.rs              CPU aggregate + per-core
│   │   ├── memory.rs           System RAM + GPU VRAM + unified-memory detection
│   │   ├── disk.rs             Disk I/O rates
│   │   └── network.rs          Network I/O rates
│   └── engines/
│       ├── mod.rs              Engine trait, state machine, collector
│       ├── detector.rs         Process scan + Docker discovery
│       ├── vllm.rs             vLLM adapter (Prometheus parsing)
│       └── prometheus.rs       Prometheus text-format parser
├── frontend/
│   └── src/
│       ├── hooks/              useMetrics, metrics store, configuration
│       ├── components/
│       │   ├── grid/           GridPage, palette, panel settings
│       │   │   └── panels/     One component per panel type
│       │   ├── pages/          Header page tabs and page settings
│       │   ├── engines/        Engine tiles, gauges and per-panel controls
│       │   ├── charts/         TimeSeriesChart, CoreHeatmap
│       │   └── gauges/         ArcGauge, HBar
│       ├── types/              TypeScript type definitions
│       └── lib/
│           ├── dashboard/      Schema, migrations, preset, grid, routes
│           └── …               Circular buffer, formatting, theme
├── deploy/                     Deployment & install artifacts, by type
│   ├── docker/                 Container install
│   │   ├── Dockerfile          Multi-stage container build
│   │   ├── docker-compose.yml  Host-network compose (+ bridge override)
│   │   ├── .env.docker.example Compose configuration template
│   │   └── docker.md           Container deployment guide
│   └── host/                   Cargo + systemd source install
│       ├── install.sh          Source-build + systemd installer
│       ├── systemd/            spark-dashboard.service unit
│       └── config.env.example  /etc/spark-dashboard/config.env template
├── dev/
│   ├── dev.sh                  Dev loop (local frontend + remote backend)
│   ├── docker-dev.sh           Containerized build/deploy harness
│   ├── .env.example            Dev configuration template
│   └── README.md               Operator docs
├── docs/
│   ├── adr/                    Architecture decision records
│   └── agents/                 Agent-facing workflow docs
├── CONTEXT.md                  Domain glossary, and what is out of scope
├── LICENSE                     MIT
├── CONTRIBUTING.md
└── Cargo.toml
Contributing
See CONTRIBUTING.md.
License
MIT — see LICENSE.
Contributors


Similar repos


Languages
TypeScript
69.9%
Rust
26.2%
Shell
2.9%
Real-time hardware and LLM inference monitoring — GPU, CPU, memory, and vLLM metrics streamed to a dashboard.
TypeScript
121
212 commits
updated Sep 10, 2026
README
Spark Dashboard
Real-time hardware and LLM inference monitoring for Linux systems with NVIDIA GPUs. Developed and tested on the NVIDIA DGX Spark, but works on any Linux host with NVIDIA drivers — discrete-GPU workstations, DGX boxes, cloud VMs. A Rust backend collects GPU, CPU, memory, disk, and network metrics alongside vLLM engine statistics and streams them over WebSocket to a React frontend.
Quick Start
Install on your Linux host
Run as your normal user on any Linux host with NVIDIA drivers (requires Rust 1.95+):
cargo install spark-dashboard
sudo ~/.cargo/bin/spark-dashboard service install
systemctl status spark-dashboard
The dashboard is now served on port 3000. See Install on your Linux host for the full guide, config overrides, and uninstall.
Run with Docker
Prefer containers? Run the published multi-arch image (needs the NVIDIA Container Toolkit):
docker run --rm --gpus all --pid=host -p 3000:3000 \
  -v /var/run/docker.sock:/var/run/docker.sock:ro \
  -v spark-dashboard-state:/var/lib/spark-dashboard \
  --group-add "$(getent group docker | cut -d: -f3)" \
  ghcr.io/niklasfrick/spark-dashboard:latest
--group-add puts the container in the host's docker group so it can read the
mounted socket and discover vLLM containers. Skip it (or get the GID wrong)
and engine discovery silently falls back to host processes only — containerized
engines won't appear. The named volume keeps saved dashboards across container
replacement; without it they die with the container.
Or with Compose (host networking + GPU + socket mount preconfigured):
curl -fsSLO https://raw.githubusercontent.com/niklasfrick/spark-dashboard/main/deploy/docker/docker-compose.yml
curl -fsSL https://raw.githubusercontent.com/niklasfrick/spark-dashboard/main/deploy/docker/.env.docker.example -o .env
# set DOCKER_GID to your host's docker group: getent group docker | cut -d: -f3
docker compose up -d
See deploy/docker/docker.md for networking modes, GPU
passthrough, env vars, and troubleshooting.
Develop locally
git clone https://github.com/niklasfrick/spark-dashboard.git
cd spark-dashboard
cp dev/.env.example .env           # edit with your remote host's user/host
./dev/dev.sh
Open http://localhost:5173 in your browser. See dev/README.md
for details on what each script does.
Features
Hardware Monitoring (1s polling via NVML, sysinfo, procfs)
- GPU utilization, temperature, power draw, clock frequencies, fan speed
- GPU event detection — thermal throttling, hardware slowdown, power brake
- CPU aggregate and per-core utilization with heatmap
- Memory breakdown — CPU RAM and GPU VRAM separately on discrete-GPU hosts, or a single unified pool on systems where CPU and GPU share memory (e.g. DGX Spark GB10, GH200)
- Disk and network I/O throughput
LLM Engine Monitoring (vLLM via Prometheus metrics)
- Tokens per second (generation + prompt)
- Time to first token, inter-token latency, end-to-end latency, queue time
- Active/queued requests, batch size
- KV cache utilization, prefix cache hit rate
- Automatic engine discovery via process scan and Docker API
- SLO Goodput
Multi-Engine Support
- Run and monitor any number of inference engines side by side — each vLLM process or container is detected automatically
- Every engine panel follows the page's engine selection by default, so one layout works whether the host runs one engine or four
- Pin a panel to a specific engine to watch two of them at once; a pinned panel whose engine is gone says so and keeps its place rather than silently showing a different one
- With several engines on a host, each panel names the one it is showing and marks the provider of the model it is serving
Dashboard (arranged by you, stored on the server)
Not a fixed layout with a few toggles: every metric is a panel you place, and a page is whatever set of panels you choose to put on it.
- Edit mode — Edit layout to drag, resize, add and remove; live motion freezes while you work, and Save layout or Discard ends the session. Outside it panels are fully interactive and never move
- A palette of every metric — click a type and it lands in the first free slot; in edit mode, click a panel's frame to take it off the page again
- Named pages, each with its own URL — a training view and an idle health view kept side by side rather than one compromise. Point a wall display at a page's URL and it returns to that page after a reboot
- Per-page model selection — a page can show one engine, every engine combined, or whatever the host happens to be serving. See Configuring what a page shows
- Per-panel settings — retitle it, choose its time window (5m / 10m / 15m), or pin it to a specific GPU or engine instead of following the page
- Fits the viewport on desktop with no scrolling; stacks into one column on a phone, derived from your desktop arrangement rather than authored twice
- Saved on the server, shared by everyone who opens the instance, and outliving restarts, upgrades and container replacement
- 15-minute rolling history with circular buffers, arc gauges, time-series charts, per-core heatmap
- Connection status badge, staleness detection, auto-reconnect
Every panel the palette offers:
| Group | Binds to | Panels |
|---|---|---|
| Per-GPU hardware | One GPU, by NVML index | GPU Utilization, GPU Temp, GPU Power, GPU Clock, GPU Memory, GPU Fan, GPU Events |
| Host-wide hardware | Nothing | CPU, CPU Cores, Memory, Disk I/O, Network |
| Engines | One engine, by endpoint | Engine, Prefill Throughput, Decode Throughput, Latency, SLO Goodput, Requests, Cache, Speculative Decoding, Inference Requests, Logs |
| Engines | Nothing — every engine at once | All Engines |
Architecture
┌──────────────────────┐         WebSocket (JSON)         ┌────────────────────┐
│     Rust Backend     │ ──────────────────────────────▶  │  React Frontend    │
│                      │                                  │                    │
│  Tokio tasks:        │                                  │  useMetrics hook   │
│  ├─ metrics_collector│  broadcast channel (capacity 16) │  ├─ WebSocket conn │
│  │  (GPU/CPU/mem/…) ─┼──▶ tx ──▶ ws_handler ──▶ client  │  ├─ batch flush 2s │
│  └─ engine_collector │                                  │  └─ circular bufs  │
│     (vLLM/Docker)    │                                  │                    │
│                      │  Static files (rust-embed)       │  Recharts, Tailwind│
│  Axum router         │ ◀──── production only ─────────  │  shadcn/ui         │
└──────────────────────┘                                  └────────────────────┘
  Linux host (e.g. DGX Spark)                                  Browser
Two independent Tokio tasks run in parallel — one for hardware metrics (NVML,
sysinfo, procfs) and one for engine detection/polling. Both feed into a
broadcast channel that fans out to all connected WebSocket clients. In
production the frontend is embedded in the binary via rust-embed; in
development, Vite serves the frontend locally and proxies API/WebSocket
traffic to the remote backend.
Configuration
All operator config lives in a repo-root .env file. Copy the template and
edit:
cp dev/.env.example .env
| Variable | Purpose |
|---|---|
DEPLOY_USER | SSH user on the remote host (required) |
DEPLOY_HOST | Hostname or IP of the remote host (required) |
DEPLOY_DIR | Project path on the remote host, relative to remote home (default spark-dashboard) |
VITE_BACKEND_URL | Where Vite proxies /ws and /api (default http://localhost:3000) |
Legacy SPARK_USER / SPARK_HOST / SPARK_DIR are still accepted as a
fallback when DEPLOY_* are unset — dev.sh prints a one-line deprecation
note. The scripts in dev/ source this file; Vite picks up VITE_* variables
automatically. .env is gitignored — never commit it.
Install on your Linux host
The dashboard runs as a supervised systemd service. Two install paths; both
build from source on the host.
Option A — via cargo (recommended)
# On the host. Requires Rust 1.95+, NVIDIA drivers, and internet access.
cargo install spark-dashboard
sudo ~/.cargo/bin/spark-dashboard service install
systemctl status spark-dashboard
cargo install pulls the crate from crates.io
and compiles it locally. service install copies the binary to
/usr/local/bin, creates a locked-down spark-dashboard system user (added
to video, render, docker groups for NVML and Docker access), writes the
systemd unit, and enables it.
Why the explicit
~/.cargo/bin/path?cargo installdrops the binary in~/.cargo/bin, which isn't onsudo's sanitizedsecure_pathand isn't always on the user's interactive PATH either (depends on how Rust was installed). Passing the absolute path makes the command work regardless. Afterservice installcopies the binary to/usr/local/bin, subsequentsudo spark-dashboard …calls (e.g.service status,service uninstall) resolve normally.
Option B — from a local checkout
Use this when you want to install without crates.io (audit the source, air-gapped install, or deploy an unreleased commit).
# On the host. Run as your normal user — the script escalates to sudo
# only for the systemd wiring step.
git clone https://github.com/niklasfrick/spark-dashboard.git
cd spark-dashboard
./deploy/host/install.sh
This builds the frontend (npm run build) and the Rust binary
(cargo build --release), then hands off to the same service install
logic as Option A. You'll be prompted for your sudo password once, when
the service is installed.
Managing the service
sudo systemctl {start|stop|restart} spark-dashboard
journalctl -u spark-dashboard -f          # follow logs
sudo spark-dashboard service status       # same as `systemctl status`
Optional overrides live in /etc/spark-dashboard/config.env — set
SPARK_DASHBOARD_PORT, SPARK_DASHBOARD_BIND, SPARK_DASHBOARD_POLL_INTERVAL,
SPARK_DASHBOARD_GPU_INDEX, SPARK_DASHBOARD_STATE_DIR,
SPARK_DASHBOARD_PROVIDER_API_KEY, or RUST_LOG, then
sudo systemctl restart spark-dashboard.
Upgrade
# Option A
cargo install --force spark-dashboard && sudo ~/.cargo/bin/spark-dashboard service install

# Option B
cd spark-dashboard && git pull && ./deploy/host/install.sh
Re-running service install is idempotent: it stops the service, swaps the
binary, and starts it again, preserving /etc/spark-dashboard/config.env.
Uninstall
sudo spark-dashboard service uninstall         # keep /etc/spark-dashboard
sudo spark-dashboard service uninstall --purge # also remove /etc/spark-dashboard
Neither form touches /var/lib/spark-dashboard, so saved dashboards survive an
uninstall/reinstall cycle. Remove that directory by hand to start clean.
CLI options
spark-dashboard [OPTIONS]                 run the server (default)
spark-dashboard service install [--prefix /usr/local]
spark-dashboard service uninstall [--purge]
spark-dashboard service status

  -p, --port <PORT>           Listen port [default: 3000] [env: SPARK_DASHBOARD_PORT]
  -b, --bind <BIND>           Bind address [default: 0.0.0.0] [env: SPARK_DASHBOARD_BIND]
      --poll-interval <MS>    Polling interval ms [default: 1000] [env: SPARK_DASHBOARD_POLL_INTERVAL]
      --state-dir <DIR>       Directory for saved state [default: /var/lib/spark-dashboard] [env: SPARK_DASHBOARD_STATE_DIR]
      --gpu-index <IDX>       Optional NVML GPU index to monitor [env: SPARK_DASHBOARD_GPU_INDEX]
      --simulate-gpus <N>     Append N fictive GPUs with simulated data (dev aid) [env: SPARK_DASHBOARD_SIMULATE_GPUS]
      --engine <TYPE>         Manual engine type (e.g. vllm) [env: SPARK_DASHBOARD_ENGINE]
      --engine-url <URL>      Manual engine endpoint (requires --engine) [env: SPARK_DASHBOARD_ENGINE_URL]
      --engine-api-key <KEY>  API key for an endpoint, paired by index with --engine-url [env: SPARK_DASHBOARD_ENGINE_API_KEY]
      --provider-api-key <KEY> Fallback API key for any endpoint [env: SPARK_DASHBOARD_PROVIDER_API_KEY]
      --enable-log-viewer     Stream engine container logs at /ws/logs (Linux only, off by default) [env: SPARK_DASHBOARD_ENABLE_LOG_VIEWER]
On multi-GPU hosts, Spark Dashboard monitors all available NVIDIA GPUs by
default. Use --gpu-index to focus on one device. Engines are auto-detected via
process scan and Docker API. Use --engine and --engine-url to override when
auto-detection doesn't work. For a host-systemd installation, put the same
values in /etc/spark-dashboard/config.env as SPARK_DASHBOARD_ENGINE and
SPARK_DASHBOARD_ENGINE_URL; comma-separated engine and URL values are paired
by position.
For auth-gated deployments (e.g. vLLM started with --api-key), pass
--engine-api-key (index-paired with --engine-url) or set
SPARK_DASHBOARD_PROVIDER_API_KEY as a global fallback covering auto-detected
engines too. Model info is resolved from /v1/models once and cached —
re-resolved only on engine restart or every 10 minutes — so an auth-gated
engine is no longer hit on every poll tick.
Dashboard configuration API
The dashboard configuration is a single document shared by everyone who opens
the instance, stored at <state-dir>/dashboards.json. The server keeps it as
opaque bytes — it never parses or validates the contents, and enforces only a
1 MiB size cap. Writes are atomic, and last write wins.
Both deployments arrange for <state-dir> to be /var/lib/spark-dashboard, the
binary's default:
| Deployment | Where it lives | Provided by |
|---|---|---|
| systemd | /var/lib/spark-dashboard | the unit's StateDirectory= grant, created and chowned to the service user on start |
| Docker | the spark-dashboard-state volume | the Compose named volume; survives everything short of down -v |
The document therefore outlives restarts, upgrades and container replacement.
Override the location with --state-dir / SPARK_DASHBOARD_STATE_DIR — under
systemd that also needs a unit override, since ProtectSystem=strict leaves the
granted state directory the only writable path.
Backing it up is copying the file. There is deliberately no import/export feature; the location is documented instead, so an operator can copy a configuration to another host or keep a snapshot before experimenting:
# systemd
sudo cp /var/lib/spark-dashboard/dashboards.json ~/dashboards.backup.json
sudo systemctl stop spark-dashboard                                   # restore
sudo install -o spark-dashboard -g spark-dashboard -m 644 \
  ~/dashboards.backup.json /var/lib/spark-dashboard/dashboards.json
sudo systemctl start spark-dashboard

# Docker — see deploy/docker/docker.md for the volume commands
Stop the service first so the copy cannot land under a write, and reload any open dashboard afterwards: a browser still holding the pre-restore document would put it straight back on its next save.
The document's format is internal and subject to change. It is the frontend's own versioned state, not a stable contract (ADR-0002) — copy the file whole, don't generate or hand-edit it. A document written by a newer build is refused by an older one, which falls back to the default preset with a banner rather than failing.
GET    /api/dashboard   the document, or 204 when none is stored
PUT    /api/dashboard   replaces it wholesale (204 on success)
DELETE /api/dashboard   removes it, resetting to the default preset (204)
204 on read means "nothing saved" rather than an error — a fresh install and
a reset look identical, and the dashboard renders its default preset for both.
A write over the cap is rejected with 413, leaving the stored document
untouched.
Every response carries x-spark-dashboard-read-only. It is true when the
state directory was not writable at startup, in which case reads still work,
writes are refused with 503, and the dashboard shows a read-only banner
instead of pretending a save succeeded. A write that fails for some other
reason — a full disk, say — returns 500 and leaves the header false.
curl -i localhost:3000/api/dashboard                       # read
curl -X PUT localhost:3000/api/dashboard -d '{"pages":[]}' # save
curl -X DELETE localhost:3000/api/dashboard                # reset
Unmatched paths under /api return 404 rather than the app shell.
Dashboard pages and kiosk URLs
A configuration holds any number of named pages — separate arrangements of panels, kept side by side rather than one being chosen permanently. They are created, renamed and deleted from the Pages menu in the header, and switched between from the tabs beside it; tabs that do not fit the header move into an overflow menu rather than pushing it out of shape.
Each page has its own URL, built from a stable id plus a readable slug:
/pages/<id>            e.g. /pages/overview
/pages/<id>/<slug>     e.g. /pages/overview/wall-display
The id is fixed when the page is created and never changes again; the slug is whatever the page is called now, and is omitted when it would only repeat the id. The second example above is the page created as Overview and since renamed to Wall Display.
Only the id is matched — the slug is decoration. Renaming a page rewrites the slug and leaves the id alone, so a kiosk browser or a bookmark pointed at the old URL still lands on the same page. Pointing a wall display at one page's URL is what makes it come back to that page after a reboot with no interaction.
Resetting is two-tiered: deleting a single page from the Pages menu takes that
page only, while Reset everything asks for confirmation and then removes the
stored document outright — which is the same DELETE /api/dashboard above, and
leaves the dashboard rendering its default preset. The dashboard always keeps at
least one page, so the last one cannot be deleted; resetting is the way to start
over.
Configuring what a page shows
Panels do not each carry their own engine. A panel is created following the page, and the page answers what it follows — which is what lets one saved arrangement be correct on a laptop running a single engine and on a server running four.
You choose that answer from Page config, beside Edit layout in the header:
| Choice | What following panels show |
|---|---|
| Automatic | Whatever the host is serving — the first running engine. What every page starts as, and what the shipped preset uses |
| One model | That engine, named by its endpoint, for as long as the page exists — a Qwen page that opens on Qwen for every colleague and every kiosk |
| All models | Every engine at once, combined: throughput and counters sum, latencies are request-weighted means. A panel rendering the combination says so, since a combined figure wearing one engine's name would misread |
Two things this is not:
- Not part of an edit session. Choosing what a page shows is a deliberate, named request like renaming a page, so it is written the moment you choose it — no Save layout required, and no need to open a session first.
- Not binding on pinned panels. A panel pinned to a specific engine goes on showing that engine whatever the page says. Pin one panel and leave the rest following, and a page shows a chosen engine beside the aggregate.
Per-engine things never aggregate: logs, engine identity, and anything pinned address one engine by endpoint. An engine that has gone away is still offered as a choice and marked as absent rather than hidden — hiding it is how a page silently ends up showing something else — and a pinned panel whose engine is gone keeps its slot and says the target is missing.
Log viewer (--enable-log-viewer, Linux only, opt-in)
--enable-log-viewer (or the SPARK_DASHBOARD_ENABLE_LOG_VIEWER=1 env var)
registers an extra /ws/logs WebSocket endpoint that streams the tracked
engine container's Docker logs directly to the dashboard, using the bollard
Docker API (no docker CLI or shell required — works in distroless images).
- Off by default. Nothing is exposed unless the flag is passed.
/ws/logsis unauthenticated. The dashboard binds0.0.0.0by default and the WebSocket has no auth layer, so anyone who can reach the port can read the stream.- Engine logs can contain sensitive data. Inference-engine logs commonly
include prompts, request payloads, and API keys passed on the command line.
Treat the endpoint as equivalent to
docker logsaccess. - Recommendation: only enable on trusted networks. Put the dashboard behind
a reverse proxy with auth, bind to
127.0.0.1/--bind 127.0.0.1, or restrict the port with a firewall. Do not enable on a public-facing host.
Logs are a panel, added from the palette and bound to an engine like any other engine panel — following the page's selection, or pinned to one engine so two log panels can watch two engines side by side. The default preset places none; add one when you want it. (Before 0.14.0 this was a fixed drawer at the bottom of the page that followed the selected engine tab.)
The panel passes its resolved engine's endpoint as /ws/logs?engine=<endpoint>,
which is validated against the tracked engine state — only containers the
dashboard knows as engines can be streamed. Per container, one background Docker
log stream fans out to every panel watching it (same pattern as metrics) and
stops when the last viewer disconnects. stdout and stderr are line-buffered so
split frames don't produce partial lines.
Development
Prerequisites
- Local machine (macOS or Linux): Node.js 20+, npm, rsync, ssh
- Remote host: Linux + NVIDIA drivers, Rust 1.95+, SSH access with key-based auth (no password prompts)
- Optional:
brew install fswatchfor instant file-change detection (the watcher falls back to 2s polling without it)
Running the dev environment
./dev/dev.sh
The script handles everything:
- Syncs the full project to the remote host via rsync
- Builds the Rust backend on the remote host (
cargo build --release) - Starts the backend on the remote host (port 3000)
- Starts the Vite dev server locally (port 5173)
- Watches
src/andCargo.tomlfor Rust changes — auto-syncs and rebuilds on the remote host
| What you edit | What happens |
|---|---|
Frontend files (frontend/src/) | Vite hot-reloads instantly in the browser |
Backend files (src/, Cargo.toml) | Auto-detected → rsync to remote host → rebuild → restart (~compile time) |
Useful while dev.sh is running:
# Watch backend logs in another terminal
ssh "${DEPLOY_USER}@${DEPLOY_HOST}" tail -f /tmp/spark-dashboard.log

# Press Ctrl+C in the dev.sh terminal to stop everything (cleans up the remote process too)
How the proxy works
By default, Vite proxies /ws and /api to localhost:3000 — this works out
of the box with any SSH tunnel that maps the remote host's port 3000 to your
local machine.
Browser → localhost:5173/ws  → Vite proxy → localhost:3000/ws (forwarded to remote)
Browser → localhost:5173/api → Vite proxy → localhost:3000/api (forwarded to remote)
To connect directly over the network instead, set in .env:
VITE_BACKEND_URL=http://${DEPLOY_HOST}:3000
The frontend connects to the WebSocket using window.location.host, so the
proxy is transparent — no code changes between dev and production.
Releases
Releases are cut from main via release-please —
conventional commits drive the version bump, merging the release PR tags
vX.Y.Z and triggers cargo publish to crates.io. main always reflects
the latest stable version; see CHANGELOG.md for release notes.
Testing
# Frontend (jsdom)
cd frontend && npm test

# Frontend layout-dependent specs (headless chromium)
cd frontend && npx playwright install chromium && npm run test:browser

# Backend (on Linux)
cargo test
Backend tests include platform-aware stubs — GPU and memory tests validate real NVML/procfs parsing on Linux, with compile-time stubs on other platforms.
Project Structure
├── src/
│   ├── main.rs                 CLI args, task spawning, server startup
│   ├── server.rs               Axum router, static file serving
│   ├── ws.rs                   WebSocket handler
│   ├── metrics/
│   │   ├── mod.rs              MetricsSnapshot, collector loop
│   │   ├── gpu.rs              NVML GPU metrics + event detection
│   │   ├── cpu.rs              CPU aggregate + per-core
│   │   ├── memory.rs           System RAM + GPU VRAM + unified-memory detection
│   │   ├── disk.rs             Disk I/O rates
│   │   └── network.rs          Network I/O rates
│   └── engines/
│       ├── mod.rs              Engine trait, state machine, collector
│       ├── detector.rs         Process scan + Docker discovery
│       ├── vllm.rs             vLLM adapter (Prometheus parsing)
│       └── prometheus.rs       Prometheus text-format parser
├── frontend/
│   └── src/
│       ├── hooks/              useMetrics, metrics store, configuration
│       ├── components/
│       │   ├── grid/           GridPage, palette, panel settings
│       │   │   └── panels/     One component per panel type
│       │   ├── pages/          Header page tabs and page settings
│       │   ├── engines/        Engine tiles, gauges and per-panel controls
│       │   ├── charts/         TimeSeriesChart, CoreHeatmap
│       │   └── gauges/         ArcGauge, HBar
│       ├── types/              TypeScript type definitions
│       └── lib/
│           ├── dashboard/      Schema, migrations, preset, grid, routes
│           └── …               Circular buffer, formatting, theme
├── deploy/                     Deployment & install artifacts, by type
│   ├── docker/                 Container install
│   │   ├── Dockerfile          Multi-stage container build
│   │   ├── docker-compose.yml  Host-network compose (+ bridge override)
│   │   ├── .env.docker.example Compose configuration template
│   │   └── docker.md           Container deployment guide
│   └── host/                   Cargo + systemd source install
│       ├── install.sh          Source-build + systemd installer
│       ├── systemd/            spark-dashboard.service unit
│       └── config.env.example  /etc/spark-dashboard/config.env template
├── dev/
│   ├── dev.sh                  Dev loop (local frontend + remote backend)
│   ├── docker-dev.sh           Containerized build/deploy harness
│   ├── .env.example            Dev configuration template
│   └── README.md               Operator docs
├── docs/
│   ├── adr/                    Architecture decision records
│   └── agents/                 Agent-facing workflow docs
├── CONTEXT.md                  Domain glossary, and what is out of scope
├── LICENSE                     MIT
├── CONTRIBUTING.md
└── Cargo.toml
Contributing
See CONTRIBUTING.md.
License
MIT — see LICENSE.
Similar repos
Contributors
Languages
TypeScript
69.9%
Rust
26.2%
Shell
2.9%