
sparkDash ⚡ — Multi-DGX Spark Monitoring Dashboard
See the codeREADME
sparkDash ⚡ — Multi-unit monitoring dashboard for NVIDIA DGX Spark



by Mia'a AI Lab

macOS (darwin) SSH collectors authored by C. Michael Gibbs and Nyx Voss (Onyx AI Labs) — commits. sparkDash by Mia's AI Lab.
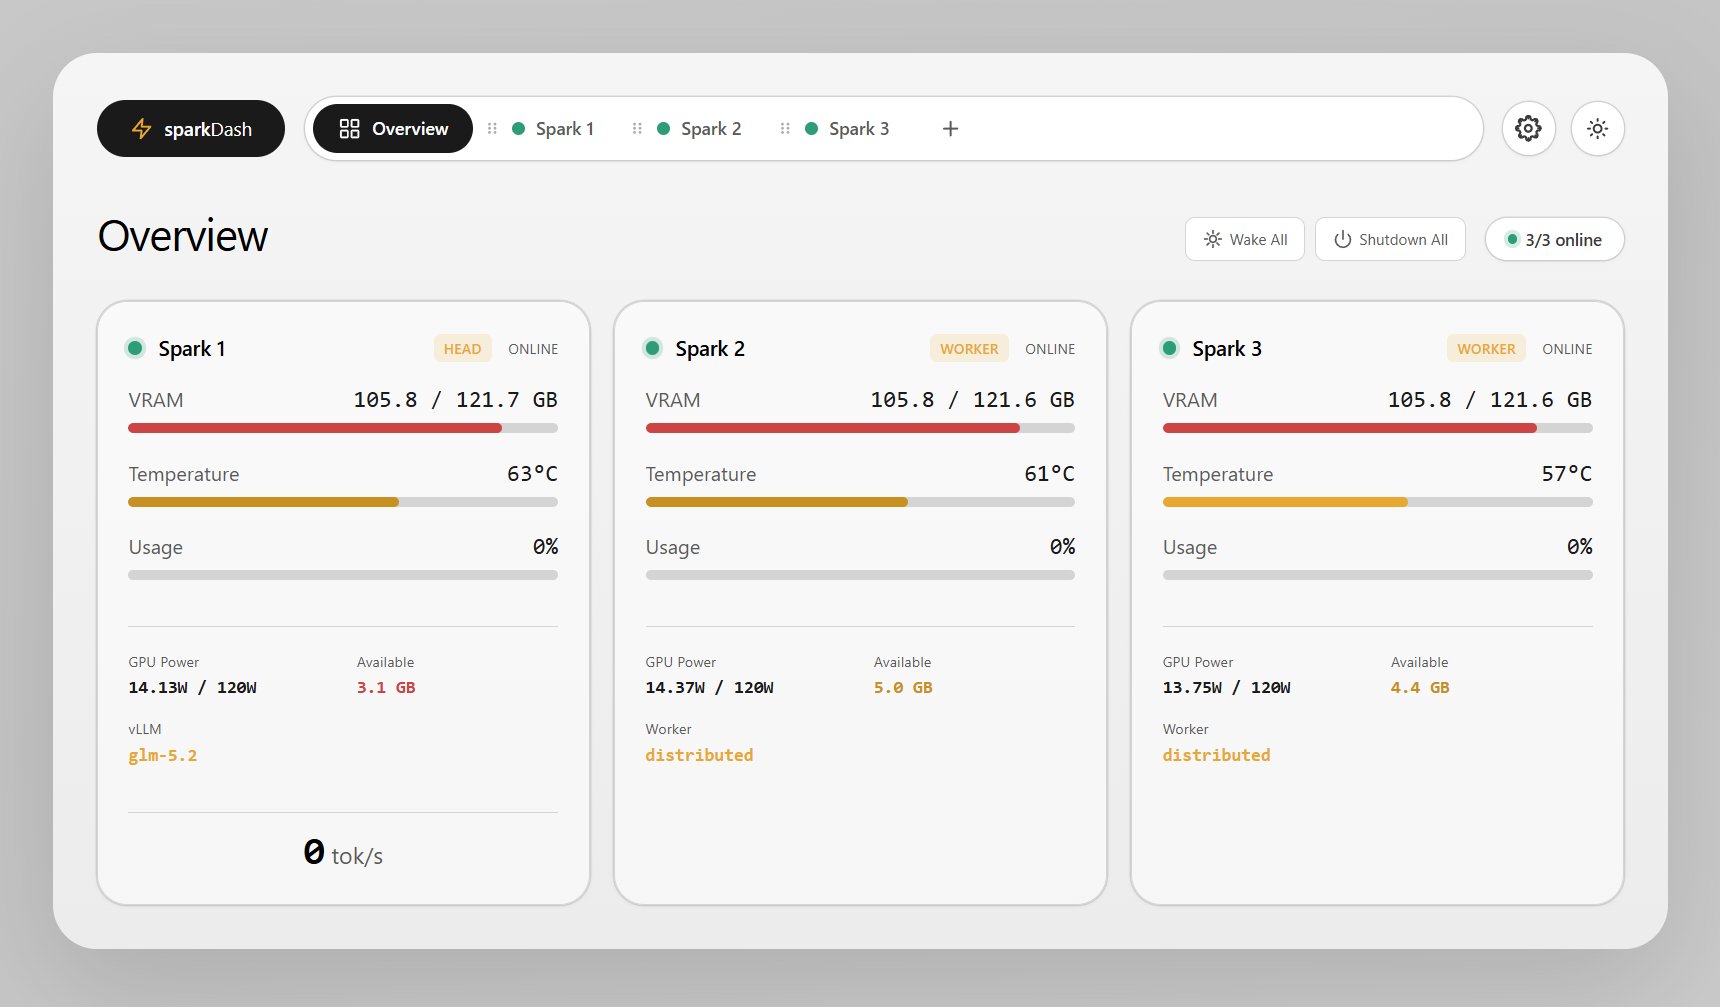
sparkDash is a real-time web dashboard for one or more NVIDIA DGX Spark (GB10) machines in a single browser window. It streams GPU, CPU, unified memory, storage, network, and local LLM metrics — and lets you add, edit, reorder, or remove Sparks from the UI without restarts or code changes.
It also supports non-Spark units: any Linux machine with an NVIDIA GPU (e.g. a workstation with a dedicated RTX/L-series card) can be added as a dedicated GPU host and monitored the same way via SSH and nvidia-smi. For these units the dashboard correctly separates RAM (system memory) from VRAM (discrete GPU memory).
LLM Prompt Showcase
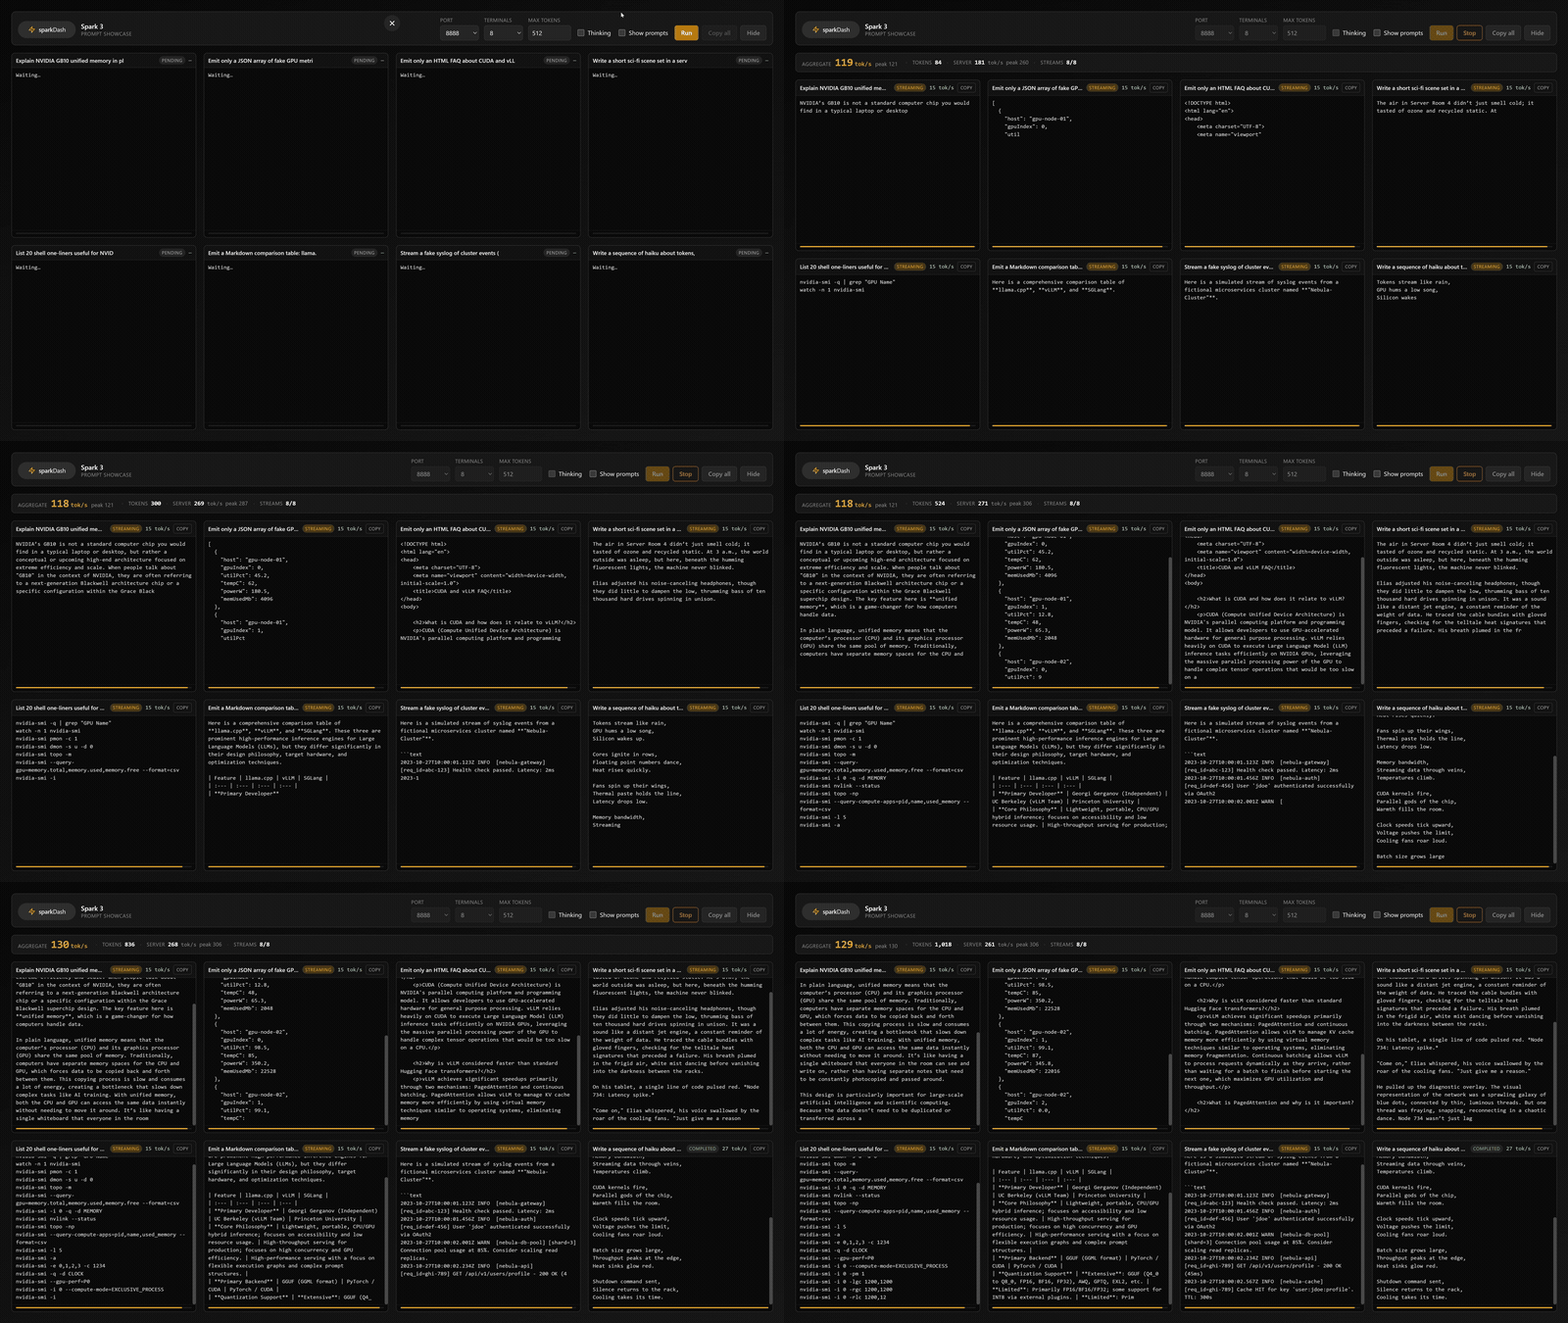
Download MP4 · also in assets/llm-showcase.mp4
Table of contents
- Latest version changelog
- Features
- ComfyUI monitoring
- Hermes Agent monitoring
- Tailnet monitoring
- Full changelog
- Quick start
- Architecture
- Tech stack
- Repository layout
- REST API
- Configuration
- Security
- Scripts
- How it works
- Contributing
- License
Latest version changelog
Version 1.8.9 — TensorFold backend
- TensorFold (ashhart/TensorFold) is detected from
/v1/models(owned_by: tensorfold) and labeled on the LLM card and Overview. Live tok/s reads cumulative token totals from/healthwhen the server publishes them; stock TensorFold does not yet, so it shows 0 tok/s until it does. Benches and the showcase work as on any OpenAI-compatible server. - q27 backend, custom prefill size, remote-Spark benches over an SSH tunnel, an on-demand Remote bench host, hide worker nodes, and a share-as-image card for bench results.
- Fixes for the decode-bench request quota and 24×/32× budget, long prefills dying at ~5 min, SGLang prefill latching,
SPARKDASH_TOKENin compose, Tailscale address classification, and remote SSH session churn.
Full history: CHANGELOG.md
Features
| Area | What you get |
|---|---|
| Multi-unit | Any number of units; each has a tabbed detail page plus a shared Overview |
| Non-Spark GPU hosts | Linux boxes with a dedicated NVIDIA GPU are first-class units: same nvidia-smi collectors over SSH, detected hardware summary, and separate RAM / VRAM panels. Detail page: GPU (left) + RAM → Network → Storage (right column); Overview cards show RAM and VRAM bars |
| Live streaming | WebSocket metrics with configurable poll intervals; central history store for sparklines across tab switches |
| Local + remote | Host metrics via sysfs/proc/nvidia-smi; remotes over SSH (key or password) |
| LLM probe | Auto-detects llama.cpp, vLLM, sglang, ds4-server, EXL3, TensorFold, or q27; live decode/prefill tok/s; cached vs uncached prefill on ds4, llama.cpp, SGLang, and q27; daily peak history on the LLM card |
| ComfyUI | Opt-in probe: queue/jobs, progress, cancel, Open link, inventory, overview chip |
| Hermes Agent | Opt-in per unit: background update check (10 min), status badges, one-click or batch hermes update |
| Tailnet | Opt-in probe: flags a unit that is healthy on the LAN but off its tailnet |
| Decode benchmark | Multi-concurrency streaming decode tok/s; type picker (Structured / Prose / Code / JSON). Code is a different Python task per stream. Lab protocol (temp 0, thinking off); persisted last run. Remote units: LAN HTTP, or SSH tunnel to loopback. Remote button for an on-demand HTTPS/host:port target |
| Prefill benchmark | Context-size sweep (1k–300k) of prefill tok/s and TTFT; unique prefix per size; persisted last run. Same remote targeting as decode |
| Prompt Showcase | Full-page multi-terminal LLM streaming demo (up to 32 prompts) with live tok/s and copy-out |
| LLM inference health | KV cache %, run/wait queue, TTFT/E2E/ITL p95, preemptions, prefix cache, MTP accept from Prometheus /metrics (vLLM and q27; q27 FIFO-queues so the Requests tile reads “N run” without a wait gauge) |
| Multiple LLM ports | Monitor several LLM servers on different ports simultaneously — each gets its own panel with independent backend detection and metrics |
| GPU processes | See the top GPU processes by VRAM usage directly in the GPU panel, including process name and memory allocation |
| Multi-GPU hosts | A dedicated GPU host with several NVIDIA cards reports each one: the header names every card, the GPU panel adds a block per card (throttle chip, usage and temperature sparklines, power, VRAM bar) and the API exposes gpu.gpus[]. The headline gpu numbers stay an aggregate of all cards, so Overview cards and alerts need no change |
| Spark uptime | System uptime displayed inline on each Spark header for at-a-glance availability |
| Power controls | Graceful shutdown (SSH host script) and Wake-on-LAN; batch actions on Overview |
| Spark roles | Head / Worker / Standalone — worker label + head link; standalone can disable LLM monitoring; optional hide workers from Overview and tabs |
| Unified memory | GB10 128 GB LPDDR5X pool (~273 GB/s), GPU/CPU split, bandwidth via nvidia-smi dmon. Non-Spark hosts show discrete VRAM (nvidia-smi) and system RAM separately |
| Themes | Dark, light, cool white, OLED — neutral palettes, persisted in localStorage |
| Secrets | SSH passwords AES-256-GCM encrypted; never in sparks.json or API responses |
| Docker-first | Single privileged container for host metrics; prod and dev Compose files |
| Hot config | Add / edit / remove / reorder Sparks from the UI with no process restart |
ComfyUI monitoring
sparkDash can optionally monitor a ComfyUI instance on each Spark — the same way it probes local LLMs, but focused on jobs and queue, not a second copy of GPU/RAM bars (those stay on the GPU / CPU panels).
What is supported
| Capability | Details |
|---|---|
| Opt-in per Spark | comfyMonitoring (default off) + comfyPort (default 8188) |
| Any role | Head, worker, and standalone can enable ComfyUI independently of LLM cluster role |
| Liveness | GET /system_stats — online, ComfyUI / PyTorch version, device type (cpu/cuda) |
| Queue / jobs | GET /queue — running + pending items; workflow title, model/LoRA filenames from the graph, footprint (resolution · steps · sampler · batch · node count) |
| Progress | Progress bar on the active job — Comfy WebSocket when events are available; otherwise elapsed / average-duration estimate |
| Last finished job | Status + duration via /api/jobs (fallback /history) |
| Queue ETA | Estimate from recent job durations × pending (+ progress remainder when known) |
| Cancel / remove | From the Comfy card: interrupt a running job or dequeue a pending one (POST /api/sparks/:id/comfy/cancel) |
| Open ComfyUI | One-click link to http://{lanIp}:{comfyPort} (LAN IP preferred so remote browsers do not hit localhost) |
| Model inventory | Checkpoints + LoRAs from /models/* (UI section only when at least one file is listed) |
| Overview chip | When monitoring is on: Comfy · idle / run / Nq / muted if unreachable |
| Layout | Under Services: primary LLM + Comfy side-by-side when both are enabled; collapsible Resources / Services sections |
Not claimed: true per-job VRAM (Comfy does not expose that cleanly over HTTP). Host GPU/VRAM remains on the GPU panel. Live step progress depends on Comfy broadcasting WS events; stock Comfy often scopes detailed progress to the client that submitted the prompt.
How to enable (per Spark)
- Open the Spark tab → Edit (pencil).
- Enable ComfyUI monitoring.
- Set port if needed (default 8188).
- Save.
The Spark page Services section shows the ComfyUI card. On Overview, a small Comfy chip appears for that unit.
Connectivity Test (in Edit) includes ComfyUI when monitoring is enabled.
ComfyUI side requirements
- ComfyUI must be reachable from the sparkDash server on the probe host:
- Local Spark (
isLocal): sparkDash probes127.0.0.1:{port}(use Dockernetwork_mode: hostif the dashboard runs in a container). - Remote Spark: probe uses the Spark LAN IP (same as LLM probes).
- Local Spark (
- For Open from another machine’s browser, Comfy should listen on a reachable interface (e.g.
--listen 0.0.0.0), not only loopback, and the Spark’s LAN IP must be set correctly in Edit.
Config fields (persisted on the Spark)
| Field | Default | Description |
|---|---|---|
comfyMonitoring | false | Probe ComfyUI and show the card / overview chip |
comfyPort | 8188 | ComfyUI HTTP port |
Related API
| Method | Path | Purpose |
|---|---|---|
| POST | /api/sparks/:id/comfy/cancel | Cancel a job ({ "promptId": "<uuid>" }) — interrupt running and/or remove from queue |
Env (optional): COMFY_PORT (default 8188), COMFY_PROBE_TIMEOUT_MS, POLL_INTERVAL_COMFY.
Hermes Agent monitoring
sparkDash can optionally monitor Hermes Agent (nousresearch/hermes-agent) on each unit and run one-click updates for you over SSH.
What is supported
| Capability | Details |
|---|---|
| Opt-in per Spark | hermesMonitoring (default off) in Edit Spark |
| Auto update check | Background hermes update --check over SSH (default every 10 min) — returns update availability + pending commits |
| Status badges | In the Spark header: Hermes (installed version), Hermes not found if the binary is missing |
| One-click update | Update Hermes button opens a dialog with live status, real pending commits, and release notes; Update now runs hermes update via SSH (non-interactive go) |
| Update state | Running / success / error surfaced live (button turns into a “Hermes updating… / failed” state) |
| Batch update | Update Hermes on Overview runs hermes update on every monitored unit, with a live per-unit progress bar |
How to enable (per Spark)
- Open the Spark tab → Edit (pencil).
- Enable Hermes Agent.
- Save — background checks start immediately.
The Update Hermes button appears in the Spark header/mobile action row; it turns warning-yellow with a commit-count badge only when an update is actually available. It also appears on Overview (batch) when at least one unit has Hermes enabled.
Connectivity check note: local units run the check as the host user (via setpriv/nsenter, never as container root); remote units run it over SSH. Either way, the logged-in user needs permission to read the Hermes repo.
Side requirements
- Hermes Agent must be installed on the target machine — sparkDash only checks & updates; it does not install it. The binary is looked up in
~/.local/binand/usr/local/bin. - SSH user must be able to run
hermes update --check/hermes updatenon-interactively (key auth recommended). - An update can take a few minutes (repo pull + dependency reinstall); a stale
*.lockfile from a crashed run is cleared before each attempt.
Config fields (persisted on the Spark)
| Field | Default | Description |
|---|---|---|
hermesMonitoring | false | Check/update Hermes Agent on this machine |
Related API
| Method | Path | Purpose |
|---|---|---|
| POST | /api/sparks/hermes/update-all | Batch hermes update on every monitored Spark (Overview button) |
| POST | /api/sparks/:id/hermes/check | Force hermes update --check now |
| POST | /api/sparks/:id/hermes/update | Run hermes update in the background (202) |
| GET | /api/sparks/:id/hermes/updates | Update preview: latest release + installed version + real pending commits + resolved view |
Env (optional): POLL_INTERVAL_HERMES (default 600000 ms), HERMES_UPDATE_TIMEOUT_MS (default 600000 ms).
Tailnet monitoring
Opt-in per unit (default off). Runs tailscale status --json on the host and shows a Tailnet card under Resources.
This closes a blind spot every LAN-based check shares, including sparkDash's own SSH liveness. When tailscaled loses its session with the coordination server, SSH/GPU/LLM can all stay healthy while the box is unreachable from off-LAN.
What is supported
| Capability | Details |
|---|---|
| Opt-in per unit | tailscaleMonitoring (default off) in Edit Spark |
| Off-tailnet detection | Self.Online — the node's own view of the coordination server |
| Reason, not just state | Tailscale Health messages, backend state, tailnet IP, DERP relay, version, expired-key warning |
Asked of each node about itself. Peer state is never the verdict. The probe is read-only (tailscale up / down / login are never run).
How to enable
- Open Edit Spark.
- Tick Tailnet monitoring.
- Save. The Tailnet card appears under Resources.
Host requirements
tailscaleCLI on the monitored host, andtailscaledrunning.- Remote units: existing SSH. Local Docker:
nsenterinto the host mount namespace (same asnvidia-smi;/host/procis already bind-mounted).
Config fields
| Field | Default | Description |
|---|---|---|
tailscaleMonitoring | false | Run tailscale status --json and show the Tailnet card |
Env (optional): POLL_INTERVAL_TAILSCALE (default 30000), TAILSCALE_PROBE_TIMEOUT_MS (default 8000).
Quick start
git clone https://github.com/MiaAI-Lab/sparkDash.git
cd sparkDash

# Production (Docker; loopback-only by default)
docker compose up --build -d

# Or development (host, with hot reload)
npm install
npm run dev
- Docker: open http://127.0.0.1:5555 on the host (arm64 image, auto-restart, host mounts for GPU/metrics access)
- Dev: Vite on http://localhost:5173 (proxies API/WS to Express)
For another computer, keep the server on loopback and use an SSH tunnel:
ssh -N -L 5555:127.0.0.1:5555 user@sparkdash-host
Then open http://127.0.0.1:5555 on that computer. For shared access, use an authenticated TLS reverse proxy, Tailscale Serve, or set BIND_HOST=0.0.0.0 and SPARKDASH_TOKEN. A direct LAN bind without a token is open by default: anyone who can reach the port can change settings and power units off, and the header shows an Open access warning. Set SPARKDASH_TOKEN to require a token, or SPARKDASH_ALLOW_OPEN_REMOTE=0 to make a tokenless LAN bind refuse to start.
When the server has SPARKDASH_TOKEN set, the dashboard asks for it: the first request or live-telemetry connection the server turns away opens an Access token dialog. Enter the token once; it is checked against the server, stored in this browser only, and the live connection reconnects with it — no reload, no devtools. Settings → Access token shows whether one is stored and lets you change or clear it.
For development with Docker (source-mounted, HMR):
docker compose -f docker-compose.dev.yml up --build
Remote units + SSH keys (Docker): SSH is executed inside the container on the sparkDash host (typically the head DGX). Configured LAN IPs are from that host’s point of view, not your laptop. OpenSSH looks for keys under /root/.ssh in the container — the host user’s ~/.ssh is not used unless you bind-mount it. Uncomment this volume in docker-compose.yml (and recreate the container):
- ${HOME}/.ssh/id_ed25519:/root/.ssh/id_ed25519:ro
If the key file has a non-default name (e.g. id_ed25519_shared), mount it as id_ed25519, or set SSH_IDENTITY_FILE to the path inside the container. Keep the file mode 600. The unit that runs sparkDash itself should be added with This host (local collectors — no SSH for metrics).
Architecture
Design principle: one Spark model, N instances. Every unit is a record in config/sparks.json with a kind field (spark or host). The same SparkMonitor, SystemCollector, and LlmProbe code runs for all of them. Adding a unit is a config change, not a code change.
┌────────────────────── Docker container (sparkDash) ────────────────────────┐
│  Express (server/)                                                         │
│  ├─ config/sparks.json        Spark registry (API read/write)              │
│  ├─ SparkRegistry             load/persist Sparks; change events           │
│  ├─ SparkMonitor (per Spark)  collector + LLM probe + rate baselines       │
│  │   ├─ SystemCollector       local sysfs/proc OR remote SSH               │
│  │   └─ LlmProbe              HTTP to host:LLM_PORT, backend autodetect    │
│  ├─ REST /api/*                                                            │
│  └─ WebSocket /ws             snapshot stream to browsers                  │
│  React SPA (src/)  — Overview + per-Spark pages, themes, dialogs           │
└────────────────────────────────────────────────────────────────────────────┘
         │ SSH (key or sshpass)                    │ HTTP :8888
         ▼                                         ▼
    remote Spark(s)                         each Spark’s LLM server
Data flow
Browser  ←→  WebSocket /ws   ←→  SparkMonitor.snapshot()  ←→  collectors
Browser  ←→  REST /api/*     ←→  SparkRegistry + SparkMonitor
Poll loops run in the background (even with no clients) so rate metrics — tokens/s, network bytes/s, disk I/O — stay correct.
Tech stack
| Layer | Stack |
|---|---|
| Frontend | React 19, TypeScript, Vite 8, Tailwind CSS v4 |
| Backend | Node.js (ESM), Express 5, ws |
| Platform | ARM64 — DGX Spark GB10 (Neoverse V2) |
| Deploy | Docker multi-stage (arm64), Compose |
| Secrets | AES-256-GCM SSH password store |
| Ports | 5555 dashboard/API; 5173 Vite (dev only) |
Repository layout
sparkDash/
├── src/                 React + TypeScript SPA
│   ├── api/             REST client + shared types
│   ├── components/      Overview, Spark pages, dialogs, UI primitives
│   ├── hooks/           WebSocket snapshot, routing
│   └── theme / CSS      Tailwind v4 + four themes
├── server/              Express + WebSocket (plain JS ESM)
│   ├── sparks/          SparkRegistry, SparkMonitor
│   ├── collectors/      SystemCollector, LlmProbe, ssh
│   ├── secretsStore.js  Encrypted password persistence
│   └── validate.js      Host/user validation (SSRF-minded)
├── config/              Runtime state (volume; secrets gitignored)
├── assets/              Screenshots
├── Dockerfile           Production multi-stage arm64
├── docker-compose.yml   Production
├── docker-compose.dev.yml
└── deploy.sh            Rebuild / recreate helpers
REST API
| Method | Path | Purpose |
|---|---|---|
| GET | /api/sparks | List Sparks (passwords redacted) |
| POST | /api/sparks | Add Spark and start its monitor |
| PATCH | /api/sparks/:id | Update Spark (hot-swap config) |
| DELETE | /api/sparks/:id | Remove Spark and drain monitor |
| PUT | /api/sparks/order | Persist tab order |
| GET | /api/sparks/:id/metrics | One-shot metrics snapshot |
| GET | /api/fleet-energy | Estimated fleet watts, rolling energy, coverage, and Wh/output-token |
| POST | /api/sparks/test | Ephemeral SSH + LLM (+ Comfy if enabled) test (no persist) |
| POST | /api/sparks/:id/test | Connectivity test (can save password) |
| POST | /api/sparks/:id/comfy/cancel | Cancel ComfyUI job by promptId |
| PUT | /api/sparks/:id/password | Save SSH password (works offline) |
| PUT | /api/sparks/:id/disabled-devices | Hide storage devices (hot) |
| PUT | /api/sparks/:id/disabled-interfaces | Hide network interfaces (hot) |
| PUT | /api/sparks/:id/llm-ports | Replace all LLM ports (hot) |
| POST | /api/sparks/:id/llm-ports | Add an LLM port (hot) |
| DELETE | /api/sparks/:id/llm-ports/:port | Remove an LLM port (hot) |
| PUT | /api/sparks/:id/llm-port | LLM port — backward-compat (hot) |
| GET | /api/sparks/:id/llm/daily | Daily busy decode/prefill tok/s (port, days) |
| POST | /api/sparks/:id/llm/bench | Start decode benchmark (202); poll/cancel/clear on the same path |
| POST | /api/sparks/:id/llm/prefill-bench | Start prefill + TTFT context sweep (202); poll/cancel/clear on the same path |
| GET | /api/settings | Global settings |
| PUT | /api/settings | Update global settings |
| WS | /ws | Real-time metrics stream |
There is no application authentication on the HTTP/WebSocket API. sparkDash therefore binds to loopback and refuses direct LAN binding. Use an SSH tunnel, authenticated TLS reverse proxy, or Tailscale Serve; see Remote access.
/api/fleet-energy samples the configured fleet independently every two seconds. It estimates
each node as GPU board draw + a CPU utilization model (5.2–65 W) + 23 W of memory/network/base
overhead, clamped to the DGX Spark power envelope. Current and hourly fleet watts require fresh,
simultaneous telemetry from every node; coverage fields make gaps explicit. Minute buckets are
persisted at mode 0600 for rolling 24-hour and 31-day windows. Wh/output-token is reported when
exactly one configured node has role head and exposes a monotonic LLM output-token counter.
These values are estimates, not wall-meter measurements. Restart sparkDash after changing fleet
membership so the persisted series has one stable node set.
Configuration
Global settings (UI or API)
Gear icon in the header, or GET/PUT /api/settings:
| Setting | Default | Description |
|---|---|---|
| Poll interval | 2000 ms | WebSocket broadcast interval (minimum 1000 ms) |
| Default LLM port | 8888 | Default for new Sparks |
| Auto-hide offline | false | Hide offline Sparks on Overview |
| Hide worker nodes | false | Hide Worker-role Sparks from Overview and the tab bar |
| Temperature unit | Celsius | Display GPU temperature in °C or °F |
| Benchmark share image | true | Decode/prefill Copy results becomes a split button: the label copies the text summary, the caret offers Copy as text / Copy as image on hover or click. Turn it off to keep the plain button. The image copies where the page has an image clipboard (HTTPS or localhost); over plain http on a LAN IP the card downloads instead |
| Detailed VRAM breakdown | true | The VRAM bar on the Overview cards and the GPU panel is split by what holds the memory — LLM engine (largest GPU process while an endpoint is serving), system/CPU (GB10 unified pool), other GPU use — over a free track, and turns amber/red on low free memory (GB10: under 8 / 4 GB; discrete GPU: under 2 / 1 GB) rather than on a high percentage. Hover or focus for the breakdown, including the engine's KV fill where the backend reports it. Turn it off for the single percentage bar |
Environment variables
Copy .env.example to .env if needed:
| Variable | Default | Description |
|---|---|---|
BIND_HOST | 127.0.0.1 | HTTP and WebSocket listen address. A non-loopback bind without SPARKDASH_TOKEN is open to anyone who can reach it (see SPARKDASH_ALLOW_OPEN_REMOTE). |
SPARKDASH_TOKEN | (empty) | Bearer token. When set, it is required for every mutation and WebSocket connection, and for REST reads on a non-loopback bind. The browser prompts for it when needed (Settings → Access token to change it). |
SPARKDASH_ALLOW_OPEN_REMOTE | 1 | Unset, empty, or 1: a non-loopback bind without SPARKDASH_TOKEN stays open. 0: refuse to start without a token (fail closed). |
SPARKDASH_ALLOWED_HOSTS | (empty) | Only for a reverse proxy on a custom domain: comma-separated names a loopback bind should also answer to. localhost, IP addresses, this machine's hostname and its Tailscale name work without it. |
PORT | 5555 | HTTP + WebSocket listen port |
LLM_PORT | 8888 | Default LLM probe port |
COMFY_PORT | 8188 | Default ComfyUI probe port |
POLL_INTERVAL_GPU | 2000 | GPU poll (ms) |
POLL_INTERVAL_COMFY | 2000 | ComfyUI probe poll (ms) |
POLL_INTERVAL_CPU | 2000 | CPU / RAM poll (ms) |
POLL_INTERVAL_NETWORK | 2000 | Network poll (ms) |
POLL_INTERVAL_STORAGE | 5000 | Storage poll (ms) |
POLL_INTERVAL_LLM | 2000 | LLM probe poll (ms) |
POLL_INTERVAL_BANDWIDTH | 2000 | Memory bandwidth / dmon poll (ms) |
POLL_INTERVAL_HERMES | 600000 | Hermes Agent update check poll (ms) |
POLL_INTERVAL_TAILSCALE | 30000 | Tailnet probe poll (ms) |
TAILSCALE_PROBE_TIMEOUT_MS | 8000 | Timeout for tailscale status --json (ms) |
POLL_INTERVAL_NVERR | 60000 | Kernel journal scan for NVRM NV_ERR_NO_MEMORY (ms) |
HERMES_UPDATE_TIMEOUT_MS | 600000 | Hard timeout for running hermes update over SSH (ms) |
POLL_INTERVAL_LIVENESS | 5000 | Online/SSH liveness check (ms) |
SPARKDASH_SECRETS_KEY | (auto) | Passphrase or 64-char hex for secret encryption |
HOST_PROC_PATH | /host/proc | Host proc mount inside container |
HOST_SYS_PATH | /host/sys | Host sys mount |
HOST_ROOT_PATH | /host/root | Host root mount |
SSH_IDENTITY_FILE | (unset) | Path inside the process to a private key (ssh -i). Use when the bind-mount is not a default OpenSSH name. |
SSH_CONTROL_PERSIST_SECONDS | 60 | Idle SSH transport persistence in seconds, capped at 3600. Set to 0 to disable multiplexing. |
FLEET_ENERGY_JSON_PATH | config/fleet-energy.json | Rolling fleet-energy persistence path |
For compatibility, SSH_CONTROL_PERSIST is accepted as a seconds-based fallback when SSH_CONTROL_PERSIST_SECONDS is unset. The existing SSH_MULTIPLEX=0 switch also disables reuse. SSH tunnels always use an independent connection.
The listener and both Compose files default to
127.0.0.1. Existing Docker users who openedhttp://<host-ip>:5555must migrate to an SSH tunnel, authenticated reverse proxy, Tailscale Serve, orBIND_HOST=0.0.0.0 SPARKDASH_TOKEN=...(without the token a0.0.0.0bind is open to the network unlessSPARKDASH_ALLOW_OPEN_REMOTE=0). Recovery:BIND_HOST=127.0.0.1 docker compose up -d --force-recreate.
Adding a unit
- Open the + tab.
- Choose Unit type:
- NVIDIA DGX Spark — the default; hardware summary shows DGX Spark specs and the CX7 IP field is available.
- Dedicated GPU host — any Linux machine with an NVIDIA GPU. It is monitored exactly like a Spark (SSH +
nvidia-smi) but is not reported as a DGX Spark: the header shows a detected hardware summary (GPU model, CPU, RAM) instead of fixed GB10 specs, and the page shows separate RAM and VRAM panels (VRAM fromnvidia-smi, RAM from system memory). On the unit page, RAM → Network → Storage stack in the right column with GPU filling the left column. A host with more than one GPU needs nothing extra: every cardnvidia-smilists is collected, the header names them all, the GPU panel shows a block per card, andmetrics.gpustays the aggregate (hottest / busiest card, summed power and VRAM) with the per-card detail undergpu.gpus[].
- Set Name and choose whether this is This host. Local units do not require a LAN IP or SSH; their optional LAN IP enables browser links and directed Wake-on-LAN. Remote units require a LAN IP/host, SSH user, and key or password. Key auth in Docker needs a key mounted into the container (see Quick start).
- Test shows pass/fail/skipped for host collectors/SSH and each enabled service (LLM, ComfyUI, Hermes Agent, Tailnet). Every enabled capability must pass; disable an unavailable optional service before saving if it should not be monitored.
- Save — a tab appears and metrics start streaming.
Power controls (shutdown / Wake-on-LAN)
-
Shutdown (per Spark or Shutdown All on Overview) runs the host helper
/usr/local/bin/spark-shutdownwith passwordless sudo. The helper contract is two invocations:Invocation Expected behaviour spark-shutdownSchedule the graceful shutdown spark-shutdown --checkPrint an acknowledgement, exit 0, change nothing --checkis what proves authorization before anything is scheduled, so a sudoers rule scoped to the helper is enough:sparky ALL=(root) NOPASSWD: /usr/local/bin/spark-shutdownA helper without
--checkstill works when sudo is granted more broadly (the authorization probe falls back tosudo -n true), but a rule limited to the helper path needs--checksupport. -
On a local unit, the helper runs on the Spark itself. When the dashboard is in Docker that means the invocation first enters the host mount namespace (
nsenter --mount=/host/proc/1/ns/mnt -- sudo -n …), using the sameHOST_PROC_PATHmount andprivileged: truethe collectors already need. A bare-host install callssudodirectly. The helper always resolves against the host filesystem, so it does not need to exist inside the container. -
Wake / Wake All send a UDP magic packet (port 9). The MAC is taken from the enP7s7 interface automatically while the Spark is online (persisted as
detectedMacAddress). Optionally set a MAC override in Edit Spark. Broadcast is derived as/24from LAN IP, or255.255.255.255if LAN IP is missing. -
Batch shutdown only targets online Sparks; offline nodes are skipped.
-
Power APIs are mutations: with
SPARKDASH_TOKENset they require it; without it they are open on loopback (local trust) and on a remote bind, unlessSPARKDASH_ALLOW_OPEN_REMOTE=0makes that bind fail closed.
Themes
Header theme control cycles:
| Theme | Notes |
|---|---|
| Dark (default) | Neutral grays, true black base, muted amber accent |
| Light | Warm paper whites |
| White | Cool neutral whites |
| OLED | True black for OLED panels |
Choice is stored in localStorage.
Security
- SSH passwords are not stored in
sparks.jsonand are never returned by the API. - Passwords are encrypted with AES-256-GCM in
config/sparks-secrets.json(survives restarts). - Encryption key:
config/.secrets-key(auto-generated) orSPARKDASH_SECRETS_KEY. Do not delete the key file or encrypted secrets become unreadable. - Target validation rejects clearly unsafe IPv4 targets (link-local
169.254.0.0/16,0.0.0.0/8, multicast/reserved ≥ 224). Private, loopback, and public addresses are allowed so LAN and remote Sparks work. - SSH and HTTP probes use short timeouts (about 5 s SSH connect, 3 s HTTP) so a hung host cannot stall the poll loop.
- Prefer SSH keys over passwords. In Docker, mount the private key into
/root/.ssh(see Quick start); passwords are the only SSH secret the app stores itself. - Loopback installs remain local-trust. A remote bind (
BIND_HOSTnot loopback) withoutSPARKDASH_TOKENis open by default: anyone who can reach the port can read telemetry, change settings and power units off, and the header shows an Open access warning (dismissible per browser). SetSPARKDASH_TOKENto require a bearer token for mutations and remote telemetry/WebSocket, andSPARKDASH_ALLOW_OPEN_REMOTE=0to refuse to start a remote bind without one.GET /api/healthreports which applies asauthMode:loopback-open,bearer,open-remote, orrequired-missing. - One-off remote benchmark hosts must be listed in
SPARKDASH_BENCH_HOSTS. - Tested operator capacity for this remediation: 12 units.
Scripts
| Command | Purpose |
|---|---|
npm run dev | Vite (5173) + Express (5555) together |
npm run dev:server | Express only (node --watch) |
npm run dev:client | Vite only |
npm run build | Production frontend → dist/ |
npm run typecheck | tsc --noEmit |
npm start | Production server (node server/index.js) |
npm run docker:up | docker compose up -d |
npm run docker:prod | Same as docker:up |
npm run docker:rebuild | docker compose up --build -d |
npm run docker:dev | Dev Compose |
npm run docker:dev:build | Dev Compose with rebuild |
./deploy.sh | Recreate container; --build, --frontend flags |
How it works
Local vs remote Sparks
One SystemCollector path for both modes. When spark.isLocal is true, metrics come from host sysfs/proc and nvidia-smi (often via nsenter into the host namespace). Remote Sparks wrap the same commands in a shared sshExec() helper (key agent or sshpass). The helper reuses an authenticated OpenSSH transport by default so frequent metric polls do not create a new SSH/PAM login lifecycle each time. Set SSH_CONTROL_PERSIST_SECONDS=0 to disable reuse. For kind: "host" units, actual hardware (GPU model, driver version, CPU, RAM) is detected once and cached in place of the static DGX Spark specs, and GPU VRAM comes straight from nvidia-smi while system RAM is read from /proc/meminfo.
Remote SSH sessions and host memory
Older sparkDash versions could create hundreds of SSH/PAM login sessions per minute on each remote host. Issue #73 documents the resulting session churn and observed polkitd memory growth. Connection reuse reduces this churn while retaining the collector refresh cadence. After updating, verify that metrics keep advancing and that new SSH authentications/PAM session opens fall after the initial connection; a new SSH client process for each collector command is still expected.
If host memory remains low, compare Linux MemAvailable and per-process resident/swap usage. Memory retained by polkitd requires separate OS investigation: polkit PR #653 fixes a reference leak in NoNewPrivileges queries. Check whether your distribution's polkit package includes that fix. SSH reuse neither applies the OS patch nor releases memory already retained by another process.
Graceful degradation
Collectors catch errors and return zero/default metrics instead of crashing the loop. After sustained liveness failures, a Spark is marked offline; the UI shows stale or empty states rather than hard errors.
Hot configuration
Name, IP, SSH credentials, LLM port, and device/interface filters update the running SparkMonitor without tearing down poll loops or losing rate baselines. Registry writes are atomic (temp file + rename).
LLM probe
Each configured LLM port gets its own LlmProbe instance running in parallel. Probes auto-detect backends:
- llama.cpp —
/slotsfor live decode rates; model from/props - ds4-server (Entrpi/ds4-on-spark) —
/v1/models(owned_by: ds4.c) + Prometheusds4_*token counters for live tok/s - EXL3 (ExLlamaV3
tools/serve_openai.py) —/v1/models(owned_by: exl3) or/health{ok, busy}; live tok/s from/healthcumulative counters - q27 (signalnine/q27 engine) —
/v1/models(owned_by: q27) or Prometheusq27_*series; live tok/s fromq27_*_processedcounter diffs (completion-based totals as fallback), exact computed-only prefill with the cached/uncached split doubling as the prefix-cache hit rate, TTFT/E2E/ITL p95 histograms, and constant-0 preemptions (FIFO admission, no wait queue) - TensorFold (ashhart/TensorFold) —
/v1/models(owned_by: tensorfold). It has no/metrics, and the CUDA server's/healthis just{ok: true}, so live tok/s appears only when/healthpublishes cumulativeprompt_tokens_total/completion_tokens_total(same contract as EXL3); otherwise the card shows the model and 0 tok/s. Decode/prefill benches and the showcase work regardless. - vLLM / sglang —
/v1/models; sglang via/server_info(last_gen_throughputwhen metrics off;/get_server_infofallback), vLLM via Prometheus/metricscounters (scientific notation supported)
Rates are derived from per-probe cumulative counter diffs (or SGLang sticky throughput while it moves). Multiple ports can be added or removed at runtime without restarting the monitor.
Live probes still use the LAN IP on remote units. Decode and prefill benches try that same HTTP target first; if it is closed they open an SSH local-forward onto the remote’s 127.0.0.1 so loopback-bound servers (ds4 start.sh default) can still be measured. The tunnel is torn down when the job finishes or is cancelled.
Contributing
Contributions are welcome. Conventions:
- Server: plain JavaScript ESM
- Client: TypeScript + React
- Prefer extending the shared Spark model over per-unit special cases
License
MIT — Copyright (c) 2026 Mia'a AI Lab
Acknowledgements
- Built for the NVIDIA DGX Spark (GB10) on ARM64
- Rebuilt from a legacy multi-unit dashboard with a single shared Spark model (no copy-pasted “Spark N” code paths)
- LLM probe behavior refined from production monitoring experience
Significant stargazers

530 followers · starred Aug 2026

986 followers · starred Sep 2026

215 followers · starred Aug 2026

561 followers · starred Aug 2026
Similar repos


sparkDash ⚡ — Multi-DGX Spark Monitoring Dashboard
See the codeREADME
sparkDash ⚡ — Multi-unit monitoring dashboard for NVIDIA DGX Spark
by Mia'a AI Lab
macOS (darwin) SSH collectors authored by C. Michael Gibbs and Nyx Voss (Onyx AI Labs) — commits. sparkDash by Mia's AI Lab.
sparkDash is a real-time web dashboard for one or more NVIDIA DGX Spark (GB10) machines in a single browser window. It streams GPU, CPU, unified memory, storage, network, and local LLM metrics — and lets you add, edit, reorder, or remove Sparks from the UI without restarts or code changes.
It also supports non-Spark units: any Linux machine with an NVIDIA GPU (e.g. a workstation with a dedicated RTX/L-series card) can be added as a dedicated GPU host and monitored the same way via SSH and nvidia-smi. For these units the dashboard correctly separates RAM (system memory) from VRAM (discrete GPU memory).
LLM Prompt Showcase
Download MP4 · also in assets/llm-showcase.mp4
Table of contents
- Latest version changelog
- Features
- ComfyUI monitoring
- Hermes Agent monitoring
- Tailnet monitoring
- Full changelog
- Quick start
- Architecture
- Tech stack
- Repository layout
- REST API
- Configuration
- Security
- Scripts
- How it works
- Contributing
- License
Latest version changelog
Version 1.8.9 — TensorFold backend
- TensorFold (ashhart/TensorFold) is detected from
/v1/models(owned_by: tensorfold) and labeled on the LLM card and Overview. Live tok/s reads cumulative token totals from/healthwhen the server publishes them; stock TensorFold does not yet, so it shows 0 tok/s until it does. Benches and the showcase work as on any OpenAI-compatible server. - q27 backend, custom prefill size, remote-Spark benches over an SSH tunnel, an on-demand Remote bench host, hide worker nodes, and a share-as-image card for bench results.
- Fixes for the decode-bench request quota and 24×/32× budget, long prefills dying at ~5 min, SGLang prefill latching,
SPARKDASH_TOKENin compose, Tailscale address classification, and remote SSH session churn.
Full history: CHANGELOG.md
Features
| Area | What you get |
|---|---|
| Multi-unit | Any number of units; each has a tabbed detail page plus a shared Overview |
| Non-Spark GPU hosts | Linux boxes with a dedicated NVIDIA GPU are first-class units: same nvidia-smi collectors over SSH, detected hardware summary, and separate RAM / VRAM panels. Detail page: GPU (left) + RAM → Network → Storage (right column); Overview cards show RAM and VRAM bars |
| Live streaming | WebSocket metrics with configurable poll intervals; central history store for sparklines across tab switches |
| Local + remote | Host metrics via sysfs/proc/nvidia-smi; remotes over SSH (key or password) |
| LLM probe | Auto-detects llama.cpp, vLLM, sglang, ds4-server, EXL3, TensorFold, or q27; live decode/prefill tok/s; cached vs uncached prefill on ds4, llama.cpp, SGLang, and q27; daily peak history on the LLM card |
| ComfyUI | Opt-in probe: queue/jobs, progress, cancel, Open link, inventory, overview chip |
| Hermes Agent | Opt-in per unit: background update check (10 min), status badges, one-click or batch hermes update |
| Tailnet | Opt-in probe: flags a unit that is healthy on the LAN but off its tailnet |
| Decode benchmark | Multi-concurrency streaming decode tok/s; type picker (Structured / Prose / Code / JSON). Code is a different Python task per stream. Lab protocol (temp 0, thinking off); persisted last run. Remote units: LAN HTTP, or SSH tunnel to loopback. Remote button for an on-demand HTTPS/host:port target |
| Prefill benchmark | Context-size sweep (1k–300k) of prefill tok/s and TTFT; unique prefix per size; persisted last run. Same remote targeting as decode |
| Prompt Showcase | Full-page multi-terminal LLM streaming demo (up to 32 prompts) with live tok/s and copy-out |
| LLM inference health | KV cache %, run/wait queue, TTFT/E2E/ITL p95, preemptions, prefix cache, MTP accept from Prometheus /metrics (vLLM and q27; q27 FIFO-queues so the Requests tile reads “N run” without a wait gauge) |
| Multiple LLM ports | Monitor several LLM servers on different ports simultaneously — each gets its own panel with independent backend detection and metrics |
| GPU processes | See the top GPU processes by VRAM usage directly in the GPU panel, including process name and memory allocation |
| Multi-GPU hosts | A dedicated GPU host with several NVIDIA cards reports each one: the header names every card, the GPU panel adds a block per card (throttle chip, usage and temperature sparklines, power, VRAM bar) and the API exposes gpu.gpus[]. The headline gpu numbers stay an aggregate of all cards, so Overview cards and alerts need no change |
| Spark uptime | System uptime displayed inline on each Spark header for at-a-glance availability |
| Power controls | Graceful shutdown (SSH host script) and Wake-on-LAN; batch actions on Overview |
| Spark roles | Head / Worker / Standalone — worker label + head link; standalone can disable LLM monitoring; optional hide workers from Overview and tabs |
| Unified memory | GB10 128 GB LPDDR5X pool (~273 GB/s), GPU/CPU split, bandwidth via nvidia-smi dmon. Non-Spark hosts show discrete VRAM (nvidia-smi) and system RAM separately |
| Themes | Dark, light, cool white, OLED — neutral palettes, persisted in localStorage |
| Secrets | SSH passwords AES-256-GCM encrypted; never in sparks.json or API responses |
| Docker-first | Single privileged container for host metrics; prod and dev Compose files |
| Hot config | Add / edit / remove / reorder Sparks from the UI with no process restart |
ComfyUI monitoring
sparkDash can optionally monitor a ComfyUI instance on each Spark — the same way it probes local LLMs, but focused on jobs and queue, not a second copy of GPU/RAM bars (those stay on the GPU / CPU panels).
What is supported
| Capability | Details |
|---|---|
| Opt-in per Spark | comfyMonitoring (default off) + comfyPort (default 8188) |
| Any role | Head, worker, and standalone can enable ComfyUI independently of LLM cluster role |
| Liveness | GET /system_stats — online, ComfyUI / PyTorch version, device type (cpu/cuda) |
| Queue / jobs | GET /queue — running + pending items; workflow title, model/LoRA filenames from the graph, footprint (resolution · steps · sampler · batch · node count) |
| Progress | Progress bar on the active job — Comfy WebSocket when events are available; otherwise elapsed / average-duration estimate |
| Last finished job | Status + duration via /api/jobs (fallback /history) |
| Queue ETA | Estimate from recent job durations × pending (+ progress remainder when known) |
| Cancel / remove | From the Comfy card: interrupt a running job or dequeue a pending one (POST /api/sparks/:id/comfy/cancel) |
| Open ComfyUI | One-click link to http://{lanIp}:{comfyPort} (LAN IP preferred so remote browsers do not hit localhost) |
| Model inventory | Checkpoints + LoRAs from /models/* (UI section only when at least one file is listed) |
| Overview chip | When monitoring is on: Comfy · idle / run / Nq / muted if unreachable |
| Layout | Under Services: primary LLM + Comfy side-by-side when both are enabled; collapsible Resources / Services sections |
Not claimed: true per-job VRAM (Comfy does not expose that cleanly over HTTP). Host GPU/VRAM remains on the GPU panel. Live step progress depends on Comfy broadcasting WS events; stock Comfy often scopes detailed progress to the client that submitted the prompt.
How to enable (per Spark)
- Open the Spark tab → Edit (pencil).
- Enable ComfyUI monitoring.
- Set port if needed (default 8188).
- Save.
The Spark page Services section shows the ComfyUI card. On Overview, a small Comfy chip appears for that unit.
Connectivity Test (in Edit) includes ComfyUI when monitoring is enabled.
ComfyUI side requirements
- ComfyUI must be reachable from the sparkDash server on the probe host:
- Local Spark (
isLocal): sparkDash probes127.0.0.1:{port}(use Dockernetwork_mode: hostif the dashboard runs in a container). - Remote Spark: probe uses the Spark LAN IP (same as LLM probes).
- Local Spark (
- For Open from another machine’s browser, Comfy should listen on a reachable interface (e.g.
--listen 0.0.0.0), not only loopback, and the Spark’s LAN IP must be set correctly in Edit.
Config fields (persisted on the Spark)
| Field | Default | Description |
|---|---|---|
comfyMonitoring | false | Probe ComfyUI and show the card / overview chip |
comfyPort | 8188 | ComfyUI HTTP port |
Related API
| Method | Path | Purpose |
|---|---|---|
| POST | /api/sparks/:id/comfy/cancel | Cancel a job ({ "promptId": "<uuid>" }) — interrupt running and/or remove from queue |
Env (optional): COMFY_PORT (default 8188), COMFY_PROBE_TIMEOUT_MS, POLL_INTERVAL_COMFY.
Hermes Agent monitoring
sparkDash can optionally monitor Hermes Agent (nousresearch/hermes-agent) on each unit and run one-click updates for you over SSH.
What is supported
| Capability | Details |
|---|---|
| Opt-in per Spark | hermesMonitoring (default off) in Edit Spark |
| Auto update check | Background hermes update --check over SSH (default every 10 min) — returns update availability + pending commits |
| Status badges | In the Spark header: Hermes (installed version), Hermes not found if the binary is missing |
| One-click update | Update Hermes button opens a dialog with live status, real pending commits, and release notes; Update now runs hermes update via SSH (non-interactive go) |
| Update state | Running / success / error surfaced live (button turns into a “Hermes updating… / failed” state) |
| Batch update | Update Hermes on Overview runs hermes update on every monitored unit, with a live per-unit progress bar |
How to enable (per Spark)
- Open the Spark tab → Edit (pencil).
- Enable Hermes Agent.
- Save — background checks start immediately.
The Update Hermes button appears in the Spark header/mobile action row; it turns warning-yellow with a commit-count badge only when an update is actually available. It also appears on Overview (batch) when at least one unit has Hermes enabled.
Connectivity check note: local units run the check as the host user (via setpriv/nsenter, never as container root); remote units run it over SSH. Either way, the logged-in user needs permission to read the Hermes repo.
Side requirements
- Hermes Agent must be installed on the target machine — sparkDash only checks & updates; it does not install it. The binary is looked up in
~/.local/binand/usr/local/bin. - SSH user must be able to run
hermes update --check/hermes updatenon-interactively (key auth recommended). - An update can take a few minutes (repo pull + dependency reinstall); a stale
*.lockfile from a crashed run is cleared before each attempt.
Config fields (persisted on the Spark)
| Field | Default | Description |
|---|---|---|
hermesMonitoring | false | Check/update Hermes Agent on this machine |
Related API
| Method | Path | Purpose |
|---|---|---|
| POST | /api/sparks/hermes/update-all | Batch hermes update on every monitored Spark (Overview button) |
| POST | /api/sparks/:id/hermes/check | Force hermes update --check now |
| POST | /api/sparks/:id/hermes/update | Run hermes update in the background (202) |
| GET | /api/sparks/:id/hermes/updates | Update preview: latest release + installed version + real pending commits + resolved view |
Env (optional): POLL_INTERVAL_HERMES (default 600000 ms), HERMES_UPDATE_TIMEOUT_MS (default 600000 ms).
Tailnet monitoring
Opt-in per unit (default off). Runs tailscale status --json on the host and shows a Tailnet card under Resources.
This closes a blind spot every LAN-based check shares, including sparkDash's own SSH liveness. When tailscaled loses its session with the coordination server, SSH/GPU/LLM can all stay healthy while the box is unreachable from off-LAN.
What is supported
| Capability | Details |
|---|---|
| Opt-in per unit | tailscaleMonitoring (default off) in Edit Spark |
| Off-tailnet detection | Self.Online — the node's own view of the coordination server |
| Reason, not just state | Tailscale Health messages, backend state, tailnet IP, DERP relay, version, expired-key warning |
Asked of each node about itself. Peer state is never the verdict. The probe is read-only (tailscale up / down / login are never run).
How to enable
- Open Edit Spark.
- Tick Tailnet monitoring.
- Save. The Tailnet card appears under Resources.
Host requirements
tailscaleCLI on the monitored host, andtailscaledrunning.- Remote units: existing SSH. Local Docker:
nsenterinto the host mount namespace (same asnvidia-smi;/host/procis already bind-mounted).
Config fields
| Field | Default | Description |
|---|---|---|
tailscaleMonitoring | false | Run tailscale status --json and show the Tailnet card |
Env (optional): POLL_INTERVAL_TAILSCALE (default 30000), TAILSCALE_PROBE_TIMEOUT_MS (default 8000).
Quick start
git clone https://github.com/MiaAI-Lab/sparkDash.git
cd sparkDash

# Production (Docker; loopback-only by default)
docker compose up --build -d

# Or development (host, with hot reload)
npm install
npm run dev
- Docker: open http://127.0.0.1:5555 on the host (arm64 image, auto-restart, host mounts for GPU/metrics access)
- Dev: Vite on http://localhost:5173 (proxies API/WS to Express)
For another computer, keep the server on loopback and use an SSH tunnel:
ssh -N -L 5555:127.0.0.1:5555 user@sparkdash-host
Then open http://127.0.0.1:5555 on that computer. For shared access, use an authenticated TLS reverse proxy, Tailscale Serve, or set BIND_HOST=0.0.0.0 and SPARKDASH_TOKEN. A direct LAN bind without a token is open by default: anyone who can reach the port can change settings and power units off, and the header shows an Open access warning. Set SPARKDASH_TOKEN to require a token, or SPARKDASH_ALLOW_OPEN_REMOTE=0 to make a tokenless LAN bind refuse to start.
When the server has SPARKDASH_TOKEN set, the dashboard asks for it: the first request or live-telemetry connection the server turns away opens an Access token dialog. Enter the token once; it is checked against the server, stored in this browser only, and the live connection reconnects with it — no reload, no devtools. Settings → Access token shows whether one is stored and lets you change or clear it.
For development with Docker (source-mounted, HMR):
docker compose -f docker-compose.dev.yml up --build
Remote units + SSH keys (Docker): SSH is executed inside the container on the sparkDash host (typically the head DGX). Configured LAN IPs are from that host’s point of view, not your laptop. OpenSSH looks for keys under /root/.ssh in the container — the host user’s ~/.ssh is not used unless you bind-mount it. Uncomment this volume in docker-compose.yml (and recreate the container):
- ${HOME}/.ssh/id_ed25519:/root/.ssh/id_ed25519:ro
If the key file has a non-default name (e.g. id_ed25519_shared), mount it as id_ed25519, or set SSH_IDENTITY_FILE to the path inside the container. Keep the file mode 600. The unit that runs sparkDash itself should be added with This host (local collectors — no SSH for metrics).
Architecture
Design principle: one Spark model, N instances. Every unit is a record in config/sparks.json with a kind field (spark or host). The same SparkMonitor, SystemCollector, and LlmProbe code runs for all of them. Adding a unit is a config change, not a code change.
┌────────────────────── Docker container (sparkDash) ────────────────────────┐
│  Express (server/)                                                         │
│  ├─ config/sparks.json        Spark registry (API read/write)              │
│  ├─ SparkRegistry             load/persist Sparks; change events           │
│  ├─ SparkMonitor (per Spark)  collector + LLM probe + rate baselines       │
│  │   ├─ SystemCollector       local sysfs/proc OR remote SSH               │
│  │   └─ LlmProbe              HTTP to host:LLM_PORT, backend autodetect    │
│  ├─ REST /api/*                                                            │
│  └─ WebSocket /ws             snapshot stream to browsers                  │
│  React SPA (src/)  — Overview + per-Spark pages, themes, dialogs           │
└────────────────────────────────────────────────────────────────────────────┘
         │ SSH (key or sshpass)                    │ HTTP :8888
         ▼                                         ▼
    remote Spark(s)                         each Spark’s LLM server
Data flow
Browser  ←→  WebSocket /ws   ←→  SparkMonitor.snapshot()  ←→  collectors
Browser  ←→  REST /api/*     ←→  SparkRegistry + SparkMonitor
Poll loops run in the background (even with no clients) so rate metrics — tokens/s, network bytes/s, disk I/O — stay correct.
Tech stack
| Layer | Stack |
|---|---|
| Frontend | React 19, TypeScript, Vite 8, Tailwind CSS v4 |
| Backend | Node.js (ESM), Express 5, ws |
| Platform | ARM64 — DGX Spark GB10 (Neoverse V2) |
| Deploy | Docker multi-stage (arm64), Compose |
| Secrets | AES-256-GCM SSH password store |
| Ports | 5555 dashboard/API; 5173 Vite (dev only) |
Repository layout
sparkDash/
├── src/                 React + TypeScript SPA
│   ├── api/             REST client + shared types
│   ├── components/      Overview, Spark pages, dialogs, UI primitives
│   ├── hooks/           WebSocket snapshot, routing
│   └── theme / CSS      Tailwind v4 + four themes
├── server/              Express + WebSocket (plain JS ESM)
│   ├── sparks/          SparkRegistry, SparkMonitor
│   ├── collectors/      SystemCollector, LlmProbe, ssh
│   ├── secretsStore.js  Encrypted password persistence
│   └── validate.js      Host/user validation (SSRF-minded)
├── config/              Runtime state (volume; secrets gitignored)
├── assets/              Screenshots
├── Dockerfile           Production multi-stage arm64
├── docker-compose.yml   Production
├── docker-compose.dev.yml
└── deploy.sh            Rebuild / recreate helpers
REST API
| Method | Path | Purpose |
|---|---|---|
| GET | /api/sparks | List Sparks (passwords redacted) |
| POST | /api/sparks | Add Spark and start its monitor |
| PATCH | /api/sparks/:id | Update Spark (hot-swap config) |
| DELETE | /api/sparks/:id | Remove Spark and drain monitor |
| PUT | /api/sparks/order | Persist tab order |
| GET | /api/sparks/:id/metrics | One-shot metrics snapshot |
| GET | /api/fleet-energy | Estimated fleet watts, rolling energy, coverage, and Wh/output-token |
| POST | /api/sparks/test | Ephemeral SSH + LLM (+ Comfy if enabled) test (no persist) |
| POST | /api/sparks/:id/test | Connectivity test (can save password) |
| POST | /api/sparks/:id/comfy/cancel | Cancel ComfyUI job by promptId |
| PUT | /api/sparks/:id/password | Save SSH password (works offline) |
| PUT | /api/sparks/:id/disabled-devices | Hide storage devices (hot) |
| PUT | /api/sparks/:id/disabled-interfaces | Hide network interfaces (hot) |
| PUT | /api/sparks/:id/llm-ports | Replace all LLM ports (hot) |
| POST | /api/sparks/:id/llm-ports | Add an LLM port (hot) |
| DELETE | /api/sparks/:id/llm-ports/:port | Remove an LLM port (hot) |
| PUT | /api/sparks/:id/llm-port | LLM port — backward-compat (hot) |
| GET | /api/sparks/:id/llm/daily | Daily busy decode/prefill tok/s (port, days) |
| POST | /api/sparks/:id/llm/bench | Start decode benchmark (202); poll/cancel/clear on the same path |
| POST | /api/sparks/:id/llm/prefill-bench | Start prefill + TTFT context sweep (202); poll/cancel/clear on the same path |
| GET | /api/settings | Global settings |
| PUT | /api/settings | Update global settings |
| WS | /ws | Real-time metrics stream |
There is no application authentication on the HTTP/WebSocket API. sparkDash therefore binds to loopback and refuses direct LAN binding. Use an SSH tunnel, authenticated TLS reverse proxy, or Tailscale Serve; see Remote access.
/api/fleet-energy samples the configured fleet independently every two seconds. It estimates
each node as GPU board draw + a CPU utilization model (5.2–65 W) + 23 W of memory/network/base
overhead, clamped to the DGX Spark power envelope. Current and hourly fleet watts require fresh,
simultaneous telemetry from every node; coverage fields make gaps explicit. Minute buckets are
persisted at mode 0600 for rolling 24-hour and 31-day windows. Wh/output-token is reported when
exactly one configured node has role head and exposes a monotonic LLM output-token counter.
These values are estimates, not wall-meter measurements. Restart sparkDash after changing fleet
membership so the persisted series has one stable node set.
Configuration
Global settings (UI or API)
Gear icon in the header, or GET/PUT /api/settings:
| Setting | Default | Description |
|---|---|---|
| Poll interval | 2000 ms | WebSocket broadcast interval (minimum 1000 ms) |
| Default LLM port | 8888 | Default for new Sparks |
| Auto-hide offline | false | Hide offline Sparks on Overview |
| Hide worker nodes | false | Hide Worker-role Sparks from Overview and the tab bar |
| Temperature unit | Celsius | Display GPU temperature in °C or °F |
| Benchmark share image | true | Decode/prefill Copy results becomes a split button: the label copies the text summary, the caret offers Copy as text / Copy as image on hover or click. Turn it off to keep the plain button. The image copies where the page has an image clipboard (HTTPS or localhost); over plain http on a LAN IP the card downloads instead |
| Detailed VRAM breakdown | true | The VRAM bar on the Overview cards and the GPU panel is split by what holds the memory — LLM engine (largest GPU process while an endpoint is serving), system/CPU (GB10 unified pool), other GPU use — over a free track, and turns amber/red on low free memory (GB10: under 8 / 4 GB; discrete GPU: under 2 / 1 GB) rather than on a high percentage. Hover or focus for the breakdown, including the engine's KV fill where the backend reports it. Turn it off for the single percentage bar |
Environment variables
Copy .env.example to .env if needed:
| Variable | Default | Description |
|---|---|---|
BIND_HOST | 127.0.0.1 | HTTP and WebSocket listen address. A non-loopback bind without SPARKDASH_TOKEN is open to anyone who can reach it (see SPARKDASH_ALLOW_OPEN_REMOTE). |
SPARKDASH_TOKEN | (empty) | Bearer token. When set, it is required for every mutation and WebSocket connection, and for REST reads on a non-loopback bind. The browser prompts for it when needed (Settings → Access token to change it). |
SPARKDASH_ALLOW_OPEN_REMOTE | 1 | Unset, empty, or 1: a non-loopback bind without SPARKDASH_TOKEN stays open. 0: refuse to start without a token (fail closed). |
SPARKDASH_ALLOWED_HOSTS | (empty) | Only for a reverse proxy on a custom domain: comma-separated names a loopback bind should also answer to. localhost, IP addresses, this machine's hostname and its Tailscale name work without it. |
PORT | 5555 | HTTP + WebSocket listen port |
LLM_PORT | 8888 | Default LLM probe port |
COMFY_PORT | 8188 | Default ComfyUI probe port |
POLL_INTERVAL_GPU | 2000 | GPU poll (ms) |
POLL_INTERVAL_COMFY | 2000 | ComfyUI probe poll (ms) |
POLL_INTERVAL_CPU | 2000 | CPU / RAM poll (ms) |
POLL_INTERVAL_NETWORK | 2000 | Network poll (ms) |
POLL_INTERVAL_STORAGE | 5000 | Storage poll (ms) |
POLL_INTERVAL_LLM | 2000 | LLM probe poll (ms) |
POLL_INTERVAL_BANDWIDTH | 2000 | Memory bandwidth / dmon poll (ms) |
POLL_INTERVAL_HERMES | 600000 | Hermes Agent update check poll (ms) |
POLL_INTERVAL_TAILSCALE | 30000 | Tailnet probe poll (ms) |
TAILSCALE_PROBE_TIMEOUT_MS | 8000 | Timeout for tailscale status --json (ms) |
POLL_INTERVAL_NVERR | 60000 | Kernel journal scan for NVRM NV_ERR_NO_MEMORY (ms) |
HERMES_UPDATE_TIMEOUT_MS | 600000 | Hard timeout for running hermes update over SSH (ms) |
POLL_INTERVAL_LIVENESS | 5000 | Online/SSH liveness check (ms) |
SPARKDASH_SECRETS_KEY | (auto) | Passphrase or 64-char hex for secret encryption |
HOST_PROC_PATH | /host/proc | Host proc mount inside container |
HOST_SYS_PATH | /host/sys | Host sys mount |
HOST_ROOT_PATH | /host/root | Host root mount |
SSH_IDENTITY_FILE | (unset) | Path inside the process to a private key (ssh -i). Use when the bind-mount is not a default OpenSSH name. |
SSH_CONTROL_PERSIST_SECONDS | 60 | Idle SSH transport persistence in seconds, capped at 3600. Set to 0 to disable multiplexing. |
FLEET_ENERGY_JSON_PATH | config/fleet-energy.json | Rolling fleet-energy persistence path |
For compatibility, SSH_CONTROL_PERSIST is accepted as a seconds-based fallback when SSH_CONTROL_PERSIST_SECONDS is unset. The existing SSH_MULTIPLEX=0 switch also disables reuse. SSH tunnels always use an independent connection.
The listener and both Compose files default to
127.0.0.1. Existing Docker users who openedhttp://<host-ip>:5555must migrate to an SSH tunnel, authenticated reverse proxy, Tailscale Serve, orBIND_HOST=0.0.0.0 SPARKDASH_TOKEN=...(without the token a0.0.0.0bind is open to the network unlessSPARKDASH_ALLOW_OPEN_REMOTE=0). Recovery:BIND_HOST=127.0.0.1 docker compose up -d --force-recreate.
Adding a unit
- Open the + tab.
- Choose Unit type:
- NVIDIA DGX Spark — the default; hardware summary shows DGX Spark specs and the CX7 IP field is available.
- Dedicated GPU host — any Linux machine with an NVIDIA GPU. It is monitored exactly like a Spark (SSH +
nvidia-smi) but is not reported as a DGX Spark: the header shows a detected hardware summary (GPU model, CPU, RAM) instead of fixed GB10 specs, and the page shows separate RAM and VRAM panels (VRAM fromnvidia-smi, RAM from system memory). On the unit page, RAM → Network → Storage stack in the right column with GPU filling the left column. A host with more than one GPU needs nothing extra: every cardnvidia-smilists is collected, the header names them all, the GPU panel shows a block per card, andmetrics.gpustays the aggregate (hottest / busiest card, summed power and VRAM) with the per-card detail undergpu.gpus[].
- Set Name and choose whether this is This host. Local units do not require a LAN IP or SSH; their optional LAN IP enables browser links and directed Wake-on-LAN. Remote units require a LAN IP/host, SSH user, and key or password. Key auth in Docker needs a key mounted into the container (see Quick start).
- Test shows pass/fail/skipped for host collectors/SSH and each enabled service (LLM, ComfyUI, Hermes Agent, Tailnet). Every enabled capability must pass; disable an unavailable optional service before saving if it should not be monitored.
- Save — a tab appears and metrics start streaming.
Power controls (shutdown / Wake-on-LAN)
-
Shutdown (per Spark or Shutdown All on Overview) runs the host helper
/usr/local/bin/spark-shutdownwith passwordless sudo. The helper contract is two invocations:Invocation Expected behaviour spark-shutdownSchedule the graceful shutdown spark-shutdown --checkPrint an acknowledgement, exit 0, change nothing --checkis what proves authorization before anything is scheduled, so a sudoers rule scoped to the helper is enough:sparky ALL=(root) NOPASSWD: /usr/local/bin/spark-shutdownA helper without
--checkstill works when sudo is granted more broadly (the authorization probe falls back tosudo -n true), but a rule limited to the helper path needs--checksupport. -
On a local unit, the helper runs on the Spark itself. When the dashboard is in Docker that means the invocation first enters the host mount namespace (
nsenter --mount=/host/proc/1/ns/mnt -- sudo -n …), using the sameHOST_PROC_PATHmount andprivileged: truethe collectors already need. A bare-host install callssudodirectly. The helper always resolves against the host filesystem, so it does not need to exist inside the container. -
Wake / Wake All send a UDP magic packet (port 9). The MAC is taken from the enP7s7 interface automatically while the Spark is online (persisted as
detectedMacAddress). Optionally set a MAC override in Edit Spark. Broadcast is derived as/24from LAN IP, or255.255.255.255if LAN IP is missing. -
Batch shutdown only targets online Sparks; offline nodes are skipped.
-
Power APIs are mutations: with
SPARKDASH_TOKENset they require it; without it they are open on loopback (local trust) and on a remote bind, unlessSPARKDASH_ALLOW_OPEN_REMOTE=0makes that bind fail closed.
Themes
Header theme control cycles:
| Theme | Notes |
|---|---|
| Dark (default) | Neutral grays, true black base, muted amber accent |
| Light | Warm paper whites |
| White | Cool neutral whites |
| OLED | True black for OLED panels |
Choice is stored in localStorage.
Security
- SSH passwords are not stored in
sparks.jsonand are never returned by the API. - Passwords are encrypted with AES-256-GCM in
config/sparks-secrets.json(survives restarts). - Encryption key:
config/.secrets-key(auto-generated) orSPARKDASH_SECRETS_KEY. Do not delete the key file or encrypted secrets become unreadable. - Target validation rejects clearly unsafe IPv4 targets (link-local
169.254.0.0/16,0.0.0.0/8, multicast/reserved ≥ 224). Private, loopback, and public addresses are allowed so LAN and remote Sparks work. - SSH and HTTP probes use short timeouts (about 5 s SSH connect, 3 s HTTP) so a hung host cannot stall the poll loop.
- Prefer SSH keys over passwords. In Docker, mount the private key into
/root/.ssh(see Quick start); passwords are the only SSH secret the app stores itself. - Loopback installs remain local-trust. A remote bind (
BIND_HOSTnot loopback) withoutSPARKDASH_TOKENis open by default: anyone who can reach the port can read telemetry, change settings and power units off, and the header shows an Open access warning (dismissible per browser). SetSPARKDASH_TOKENto require a bearer token for mutations and remote telemetry/WebSocket, andSPARKDASH_ALLOW_OPEN_REMOTE=0to refuse to start a remote bind without one.GET /api/healthreports which applies asauthMode:loopback-open,bearer,open-remote, orrequired-missing. - One-off remote benchmark hosts must be listed in
SPARKDASH_BENCH_HOSTS. - Tested operator capacity for this remediation: 12 units.
Scripts
| Command | Purpose |
|---|---|
npm run dev | Vite (5173) + Express (5555) together |
npm run dev:server | Express only (node --watch) |
npm run dev:client | Vite only |
npm run build | Production frontend → dist/ |
npm run typecheck | tsc --noEmit |
npm start | Production server (node server/index.js) |
npm run docker:up | docker compose up -d |
npm run docker:prod | Same as docker:up |
npm run docker:rebuild | docker compose up --build -d |
npm run docker:dev | Dev Compose |
npm run docker:dev:build | Dev Compose with rebuild |
./deploy.sh | Recreate container; --build, --frontend flags |
How it works
Local vs remote Sparks
One SystemCollector path for both modes. When spark.isLocal is true, metrics come from host sysfs/proc and nvidia-smi (often via nsenter into the host namespace). Remote Sparks wrap the same commands in a shared sshExec() helper (key agent or sshpass). The helper reuses an authenticated OpenSSH transport by default so frequent metric polls do not create a new SSH/PAM login lifecycle each time. Set SSH_CONTROL_PERSIST_SECONDS=0 to disable reuse. For kind: "host" units, actual hardware (GPU model, driver version, CPU, RAM) is detected once and cached in place of the static DGX Spark specs, and GPU VRAM comes straight from nvidia-smi while system RAM is read from /proc/meminfo.
Remote SSH sessions and host memory
Older sparkDash versions could create hundreds of SSH/PAM login sessions per minute on each remote host. Issue #73 documents the resulting session churn and observed polkitd memory growth. Connection reuse reduces this churn while retaining the collector refresh cadence. After updating, verify that metrics keep advancing and that new SSH authentications/PAM session opens fall after the initial connection; a new SSH client process for each collector command is still expected.
If host memory remains low, compare Linux MemAvailable and per-process resident/swap usage. Memory retained by polkitd requires separate OS investigation: polkit PR #653 fixes a reference leak in NoNewPrivileges queries. Check whether your distribution's polkit package includes that fix. SSH reuse neither applies the OS patch nor releases memory already retained by another process.
Graceful degradation
Collectors catch errors and return zero/default metrics instead of crashing the loop. After sustained liveness failures, a Spark is marked offline; the UI shows stale or empty states rather than hard errors.
Hot configuration
Name, IP, SSH credentials, LLM port, and device/interface filters update the running SparkMonitor without tearing down poll loops or losing rate baselines. Registry writes are atomic (temp file + rename).
LLM probe
Each configured LLM port gets its own LlmProbe instance running in parallel. Probes auto-detect backends:
- llama.cpp —
/slotsfor live decode rates; model from/props - ds4-server (Entrpi/ds4-on-spark) —
/v1/models(owned_by: ds4.c) + Prometheusds4_*token counters for live tok/s - EXL3 (ExLlamaV3
tools/serve_openai.py) —/v1/models(owned_by: exl3) or/health{ok, busy}; live tok/s from/healthcumulative counters - q27 (signalnine/q27 engine) —
/v1/models(owned_by: q27) or Prometheusq27_*series; live tok/s fromq27_*_processedcounter diffs (completion-based totals as fallback), exact computed-only prefill with the cached/uncached split doubling as the prefix-cache hit rate, TTFT/E2E/ITL p95 histograms, and constant-0 preemptions (FIFO admission, no wait queue) - TensorFold (ashhart/TensorFold) —
/v1/models(owned_by: tensorfold). It has no/metrics, and the CUDA server's/healthis just{ok: true}, so live tok/s appears only when/healthpublishes cumulativeprompt_tokens_total/completion_tokens_total(same contract as EXL3); otherwise the card shows the model and 0 tok/s. Decode/prefill benches and the showcase work regardless. - vLLM / sglang —
/v1/models; sglang via/server_info(last_gen_throughputwhen metrics off;/get_server_infofallback), vLLM via Prometheus/metricscounters (scientific notation supported)
Rates are derived from per-probe cumulative counter diffs (or SGLang sticky throughput while it moves). Multiple ports can be added or removed at runtime without restarting the monitor.
Live probes still use the LAN IP on remote units. Decode and prefill benches try that same HTTP target first; if it is closed they open an SSH local-forward onto the remote’s 127.0.0.1 so loopback-bound servers (ds4 start.sh default) can still be measured. The tunnel is torn down when the job finishes or is cancelled.
Contributing
Contributions are welcome. Conventions:
- Server: plain JavaScript ESM
- Client: TypeScript + React
- Prefer extending the shared Spark model over per-unit special cases
License
MIT — Copyright (c) 2026 Mia'a AI Lab
Acknowledgements
- Built for the NVIDIA DGX Spark (GB10) on ARM64
- Rebuilt from a legacy multi-unit dashboard with a single shared Spark model (no copy-pasted “Spark N” code paths)
- LLM probe behavior refined from production monitoring experience
Significant stargazers
530 followers · starred Aug 2026
986 followers · starred Sep 2026
215 followers · starred Aug 2026
561 followers · starred Aug 2026