🎯 A general-purpose protocol stack analysis and debugging tool based on eBPF 🧰
See the code
中文 · English


What's New: Analyzer module fully rewritten in Go + cilium/ebpf, replacing the original Python + BCC implementation. Lightweight redesign removes BCC runtime dependency, uses CO-RE (bpf2go) for pre-compiled eBPF, and adds MCP skill integration for each module.
PacketScope is a general-purpose protocol stack analysis and debugging tool based on eBPF. It integrates performance optimization, anomaly diagnosis, and security defense. It aims to implement fine-grained tracing and intelligent analysis of network packets at the protocol stack level on the server side. By solving three major pain points—difficult diagnosis of performance bottlenecks, unclear transmission paths, and hard-to-detect low-level attacks—PacketScope provides visualized, intelligent endpoint-side security analysis and defense capabilities.
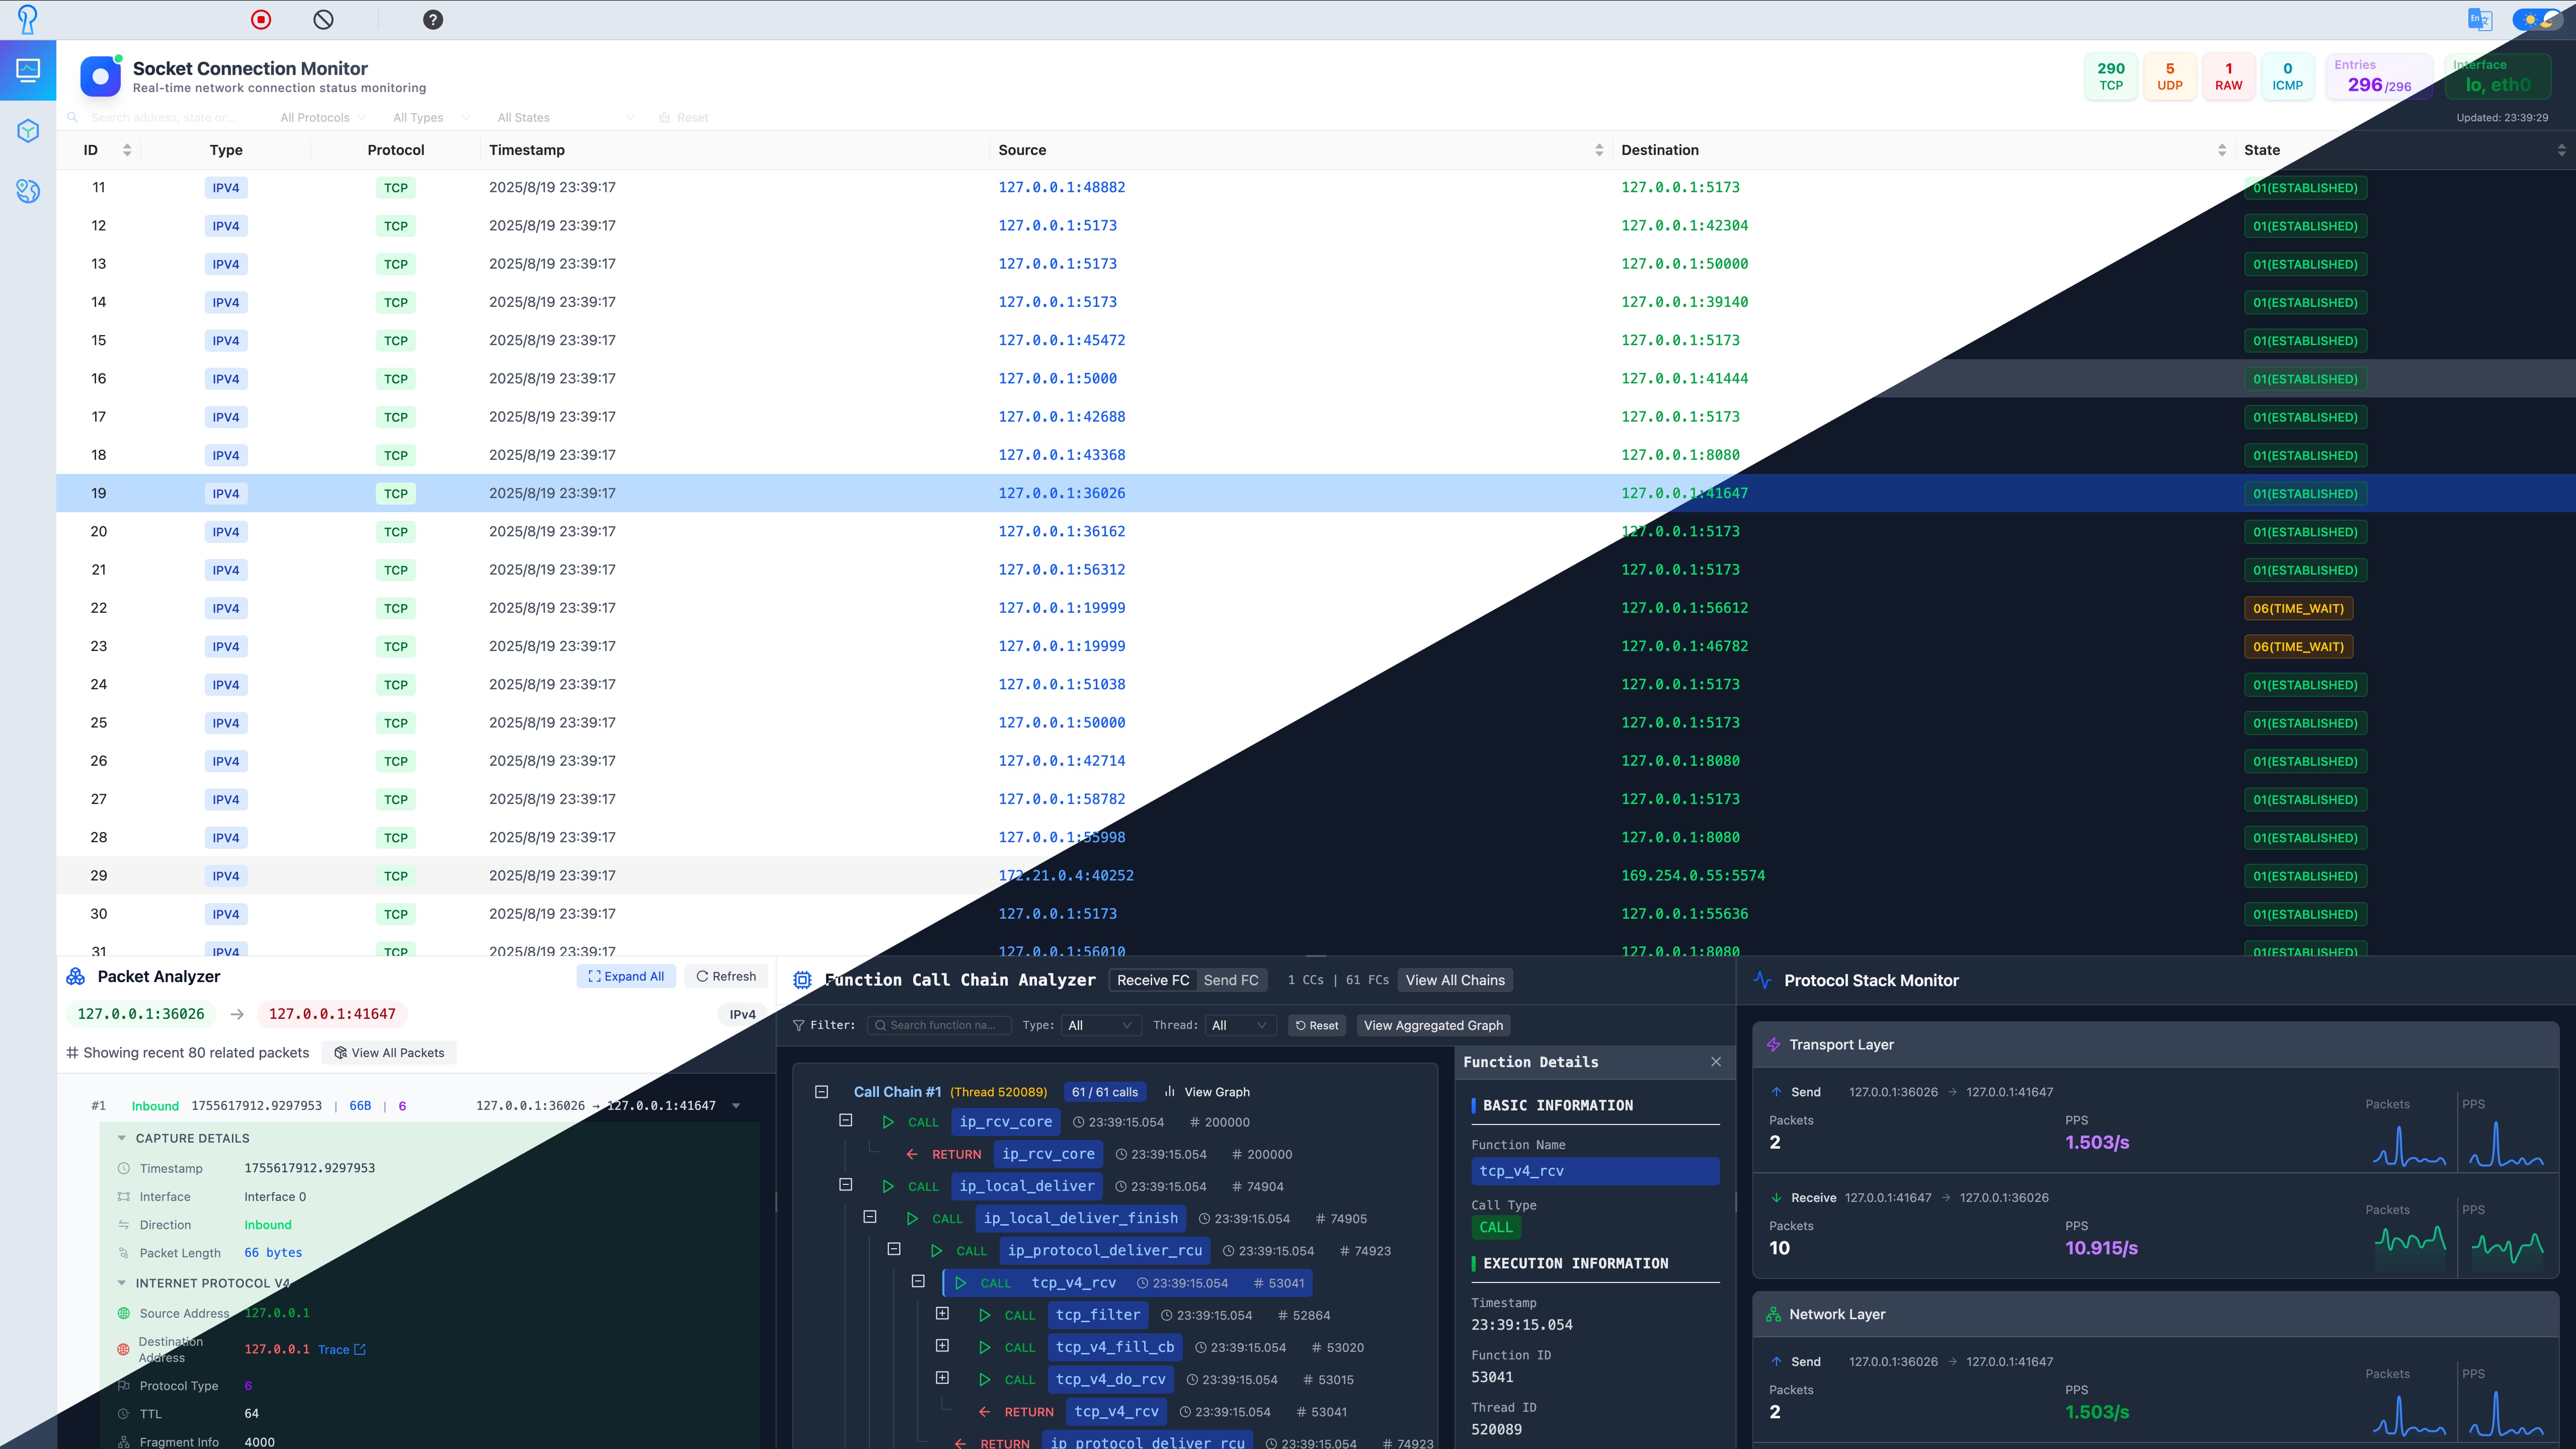
With the proliferation of social platforms, online banking, large-scale AI models, logistics, and travel services, open servers have become key execution environments. These must balance performance and security under the condition of being openly accessible. Traditional WAFs and IDS tools have blind spots in protocol stack-level defense, which PacketScope addresses:
🚨 Three Core Pain Points:
- Unclear packet paths through the protocol stack make bottlenecks and faults hard to diagnose
- Lack of fine-grained cross-domain transmission data makes routing risks invisible
- Low-level protocol stack attacks are stealthy and difficult to detect with traditional tools
Through protocol tracing, path visualization, and intelligent analysis, PacketScope builds "smart armor" for the server.
docker --version
docker compose version
International users:
git clone https://github.com/Internet-Architecture-and-Security/PacketScope.git
cd PacketScope
sudo bash starter.sh
China mainland VPS users (with mirror acceleration):
git clone https://github.com/Internet-Architecture-and-Security/PacketScope.git
cd PacketScope
bash install-cn.sh
The script will automatically install Docker (if needed), configure mirror acceleration, build all containers, and start services. Only port 80 needs to be open in your firewall/security group.
Open your browser: http://localhost
All services are served through a single nginx reverse proxy on port 80 — no need to open multiple ports.
Backend APIs are proxied through nginx at the following path prefixes:
| Prefix | Backend | Description |
|---|---|---|
/ | nginx (frontend) | React SPA dashboard |
/api/guarder/ | Guarder | Security & filtering API |
/api/tracer/ | Tracer | Route tracing API |
/api/monitor/ | Analyzer-Monitor | Packet capture & function call API |
/api/analyzer/ | Analyzer-Calculator | Cross-layer metrics (REST + WebSocket) |
sudo docker compose -f docker-compose.yml ps              # View status
sudo docker compose -f docker-compose.yml logs -f         # View logs
sudo docker compose -f docker-compose.yml down            # Stop all
sudo docker compose -f docker-compose.yml restart <name>  # Restart a service
PacketScope/
├── modules/                    # Backend service modules
│   ├── Analyzer/              # Protocol stack analysis (Go)
│   │   ├── Monitor/           # Packet capture & function call monitor (Go + eBPF)
│   │   ├── Calculator/        # Cross-layer metrics calculator (Go + eBPF)
│   │   ├── README.md          # English docs
│   │   └── README-zh.md       # Chinese docs
│   ├── Guarder/               # Security defense (Go + eBPF/XDP)
│   └── Tracer/                # Route tracing & risk analysis (Python + MCP)
├── nginx/                      # Nginx reverse proxy configuration
├── skills/                     # MCP skill packages for LLM agents
│   ├── monitor/               # Monitor MCP server & client
│   ├── tracer/                # Tracer MCP server & client
│   └── guarder/               # Guarder MCP client
├── src/                        # Frontend source (React + TypeScript)
├── docker-compose.yml          # Docker Compose (6 services)
├── Dockerfile                  # Multi-stage: node build → nginx serve
├── starter.sh                  # One-click deployment script
├── install-cn.sh               # China-friendly deployment (with mirrors)
├── README.md                   # This file
└── README-zh_CN.md             # Chinese docs
The Analyzer module has been fully rewritten in Go + cilium/ebpf, replacing the original Python + BCC implementation. This lightweight redesign removes BCC runtime dependency, uses CO-RE (bpf2go) for pre-compiled eBPF, and significantly improves deployment portability.
Monitor captures packets and tracks kernel function calls:
| Component | Technology | Port | Description |
|---|---|---|---|
| kbatch | eBPF fentry/kprobe | - | Kernel function call monitoring |
| tcxprober | eBPF TC | - | Network packet capture (ingress/egress) |
| server | Go HTTP | 8010 | RESTful API query service |
Calculator computes real-time cross-layer metrics:
| Metric | Description |
|---|---|
| PPS | Per-layer packet rate (link, network, transport) |
| LAT | Cross-layer latency (link↔network, network↔transport, link↔transport) |
| DROP | TCP packet loss rate |
Communication via WebSocket (port 8020), metrics pushed every second.
See Analyzer/README.md for details.
Maps network paths from the host to any global IP with geographic/ASN enrichment, anomaly detection, and Spamhaus-based risk scoring.
| Feature | Description |
|---|---|
| traceroute | Real-time with ICMP/TCP, per-hop streaming |
| GeoIP | City and ASN enrichment via MaxMind GeoLite2 |
| Anomaly detection | Historical path comparison, path deviation alerts |
| Risk scoring | Malicious IP detection against Spamhaus DROP/EDROP |
HTTP API on port 8000, MCP server for LLM agent integration.
See Tracer/README.md for details.
eBPF/XDP-based network security module with AI-powered filter generation.
| Feature | Description |
|---|---|
| Connection tracking | TCP/UDP/ICMP monitoring via eBPF/XDP |
| Packet filtering | Kernel-space rules (IP, port, protocol, TCP flags, ICMP type) |
| AI filter generation | LLM-powered analysis and automatic rule creation |
| PCAP analysis | Upload PCAP files for AI-driven security inspection |
HTTP API on port 8080, supports OpenAI-compatible and Anthropic-compatible endpoints.
See Guarder/README-zh.md for details.
Each backend module provides an MCP (Model Context Protocol) server, enabling LLM agents to directly invoke module capabilities:
| Skill | MCP Tools | Transport |
|---|---|---|
| monitor | get_recent_packets, query_packets, get_recent_map, get_func_table, query_func_send, query_func_recv, get_socket_list, health_check | SSE / stdio |
| tracer | trace_target, analyze_target, get_history, compare_routes, health_check, server_capabilities | SSE / stdio |
| guarder | get_connections, get_stats, create_filter, ai_analyze, ai_generate, list_filters | HTTP client |
{
  "mcpServers": {
    "packetscope-monitor": {
      "transport": "sse",
      "url": "http://localhost:8012/sse"
    },
    "packetscope-tracer": {
      "transport": "sse",
      "url": "http://localhost:8013/sse"
    }
  }
}
See skills/ for each skill's configuration and usage.
| Module | Language | eBPF Loading | Communication | Data Storage |
|---|---|---|---|---|
| nginx | — | — | HTTP (80, unified entry) | — |
| Analyzer-Monitor | Go | cilium/ebpf (bpf2go, CO-RE) | HTTP REST (8010, internal) | PostgreSQL |
| Analyzer-Calculator | Go | cilium/ebpf (bpf2go, CO-RE) | WebSocket (8020, internal) | BPF map aggregation |
| Guarder | Go | cilium/ebpf + XDP | HTTP REST (8080, internal) | In-kernel maps |
| Tracer | Python | nexttrace (external) | HTTP REST (8000, internal) | File-based cache |
| PostgreSQL | — | — | 5432 (internal) | Persistent volumes |
Deployment highlights:
postgres:16-alpine container instead of embedded in MonitorWe welcome issues and pull requests! If you find bugs or have suggestions, open an issue or PR. Please refer to CONTRIBUTING for contribution guidelines.
This project is licensed under the MIT License. See LICENSE for details.
155 followers · starred Aug 2025
43 followers · starred Jul 2025
32 followers · starred Oct 2025
🎯 A general-purpose protocol stack analysis and debugging tool based on eBPF 🧰
See the code
中文 · English
What's New: Analyzer module fully rewritten in Go + cilium/ebpf, replacing the original Python + BCC implementation. Lightweight redesign removes BCC runtime dependency, uses CO-RE (bpf2go) for pre-compiled eBPF, and adds MCP skill integration for each module.
PacketScope is a general-purpose protocol stack analysis and debugging tool based on eBPF. It integrates performance optimization, anomaly diagnosis, and security defense. It aims to implement fine-grained tracing and intelligent analysis of network packets at the protocol stack level on the server side. By solving three major pain points—difficult diagnosis of performance bottlenecks, unclear transmission paths, and hard-to-detect low-level attacks—PacketScope provides visualized, intelligent endpoint-side security analysis and defense capabilities.
With the proliferation of social platforms, online banking, large-scale AI models, logistics, and travel services, open servers have become key execution environments. These must balance performance and security under the condition of being openly accessible. Traditional WAFs and IDS tools have blind spots in protocol stack-level defense, which PacketScope addresses:
🚨 Three Core Pain Points:
- Unclear packet paths through the protocol stack make bottlenecks and faults hard to diagnose
- Lack of fine-grained cross-domain transmission data makes routing risks invisible
- Low-level protocol stack attacks are stealthy and difficult to detect with traditional tools
Through protocol tracing, path visualization, and intelligent analysis, PacketScope builds "smart armor" for the server.
docker --version
docker compose version
International users:
git clone https://github.com/Internet-Architecture-and-Security/PacketScope.git
cd PacketScope
sudo bash starter.sh
China mainland VPS users (with mirror acceleration):
git clone https://github.com/Internet-Architecture-and-Security/PacketScope.git
cd PacketScope
bash install-cn.sh
The script will automatically install Docker (if needed), configure mirror acceleration, build all containers, and start services. Only port 80 needs to be open in your firewall/security group.
Open your browser: http://localhost
All services are served through a single nginx reverse proxy on port 80 — no need to open multiple ports.
Backend APIs are proxied through nginx at the following path prefixes:
| Prefix | Backend | Description |
|---|---|---|
/ | nginx (frontend) | React SPA dashboard |
/api/guarder/ | Guarder | Security & filtering API |
/api/tracer/ | Tracer | Route tracing API |
/api/monitor/ | Analyzer-Monitor | Packet capture & function call API |
/api/analyzer/ | Analyzer-Calculator | Cross-layer metrics (REST + WebSocket) |
sudo docker compose -f docker-compose.yml ps              # View status
sudo docker compose -f docker-compose.yml logs -f         # View logs
sudo docker compose -f docker-compose.yml down            # Stop all
sudo docker compose -f docker-compose.yml restart <name>  # Restart a service
PacketScope/
├── modules/                    # Backend service modules
│   ├── Analyzer/              # Protocol stack analysis (Go)
│   │   ├── Monitor/           # Packet capture & function call monitor (Go + eBPF)
│   │   ├── Calculator/        # Cross-layer metrics calculator (Go + eBPF)
│   │   ├── README.md          # English docs
│   │   └── README-zh.md       # Chinese docs
│   ├── Guarder/               # Security defense (Go + eBPF/XDP)
│   └── Tracer/                # Route tracing & risk analysis (Python + MCP)
├── nginx/                      # Nginx reverse proxy configuration
├── skills/                     # MCP skill packages for LLM agents
│   ├── monitor/               # Monitor MCP server & client
│   ├── tracer/                # Tracer MCP server & client
│   └── guarder/               # Guarder MCP client
├── src/                        # Frontend source (React + TypeScript)
├── docker-compose.yml          # Docker Compose (6 services)
├── Dockerfile                  # Multi-stage: node build → nginx serve
├── starter.sh                  # One-click deployment script
├── install-cn.sh               # China-friendly deployment (with mirrors)
├── README.md                   # This file
└── README-zh_CN.md             # Chinese docs
The Analyzer module has been fully rewritten in Go + cilium/ebpf, replacing the original Python + BCC implementation. This lightweight redesign removes BCC runtime dependency, uses CO-RE (bpf2go) for pre-compiled eBPF, and significantly improves deployment portability.
Monitor captures packets and tracks kernel function calls:
| Component | Technology | Port | Description |
|---|---|---|---|
| kbatch | eBPF fentry/kprobe | - | Kernel function call monitoring |
| tcxprober | eBPF TC | - | Network packet capture (ingress/egress) |
| server | Go HTTP | 8010 | RESTful API query service |
Calculator computes real-time cross-layer metrics:
| Metric | Description |
|---|---|
| PPS | Per-layer packet rate (link, network, transport) |
| LAT | Cross-layer latency (link↔network, network↔transport, link↔transport) |
| DROP | TCP packet loss rate |
Communication via WebSocket (port 8020), metrics pushed every second.
See Analyzer/README.md for details.
Maps network paths from the host to any global IP with geographic/ASN enrichment, anomaly detection, and Spamhaus-based risk scoring.
| Feature | Description |
|---|---|
| traceroute | Real-time with ICMP/TCP, per-hop streaming |
| GeoIP | City and ASN enrichment via MaxMind GeoLite2 |
| Anomaly detection | Historical path comparison, path deviation alerts |
| Risk scoring | Malicious IP detection against Spamhaus DROP/EDROP |
HTTP API on port 8000, MCP server for LLM agent integration.
See Tracer/README.md for details.
eBPF/XDP-based network security module with AI-powered filter generation.
| Feature | Description |
|---|---|
| Connection tracking | TCP/UDP/ICMP monitoring via eBPF/XDP |
| Packet filtering | Kernel-space rules (IP, port, protocol, TCP flags, ICMP type) |
| AI filter generation | LLM-powered analysis and automatic rule creation |
| PCAP analysis | Upload PCAP files for AI-driven security inspection |
HTTP API on port 8080, supports OpenAI-compatible and Anthropic-compatible endpoints.
See Guarder/README-zh.md for details.
Each backend module provides an MCP (Model Context Protocol) server, enabling LLM agents to directly invoke module capabilities:
| Skill | MCP Tools | Transport |
|---|---|---|
| monitor | get_recent_packets, query_packets, get_recent_map, get_func_table, query_func_send, query_func_recv, get_socket_list, health_check | SSE / stdio |
| tracer | trace_target, analyze_target, get_history, compare_routes, health_check, server_capabilities | SSE / stdio |
| guarder | get_connections, get_stats, create_filter, ai_analyze, ai_generate, list_filters | HTTP client |
{
  "mcpServers": {
    "packetscope-monitor": {
      "transport": "sse",
      "url": "http://localhost:8012/sse"
    },
    "packetscope-tracer": {
      "transport": "sse",
      "url": "http://localhost:8013/sse"
    }
  }
}
See skills/ for each skill's configuration and usage.
| Module | Language | eBPF Loading | Communication | Data Storage |
|---|---|---|---|---|
| nginx | — | — | HTTP (80, unified entry) | — |
| Analyzer-Monitor | Go | cilium/ebpf (bpf2go, CO-RE) | HTTP REST (8010, internal) | PostgreSQL |
| Analyzer-Calculator | Go | cilium/ebpf (bpf2go, CO-RE) | WebSocket (8020, internal) | BPF map aggregation |
| Guarder | Go | cilium/ebpf + XDP | HTTP REST (8080, internal) | In-kernel maps |
| Tracer | Python | nexttrace (external) | HTTP REST (8000, internal) | File-based cache |
| PostgreSQL | — | — | 5432 (internal) | Persistent volumes |
Deployment highlights:
postgres:16-alpine container instead of embedded in MonitorWe welcome issues and pull requests! If you find bugs or have suggestions, open an issue or PR. Please refer to CONTRIBUTING for contribution guidelines.
This project is licensed under the MIT License. See LICENSE for details.
155 followers · starred Aug 2025
43 followers · starred Jul 2025
32 followers · starred Oct 2025



