
Real-time network traffic visualizer — see every connection your computer makes. Privacy-first, 100% local. / Visualiseur de trafic réseau en temps réel, 100% local.
See the codeSee what people are saying
README
Snitch
Track every hidden flow. / Traquez chaque flux masqué.
⭐ If Snitch helps you, a star means a lot! / Si Snitch vous aide, une étoile compte beaucoup ! ⭐



-blue.svg)


English
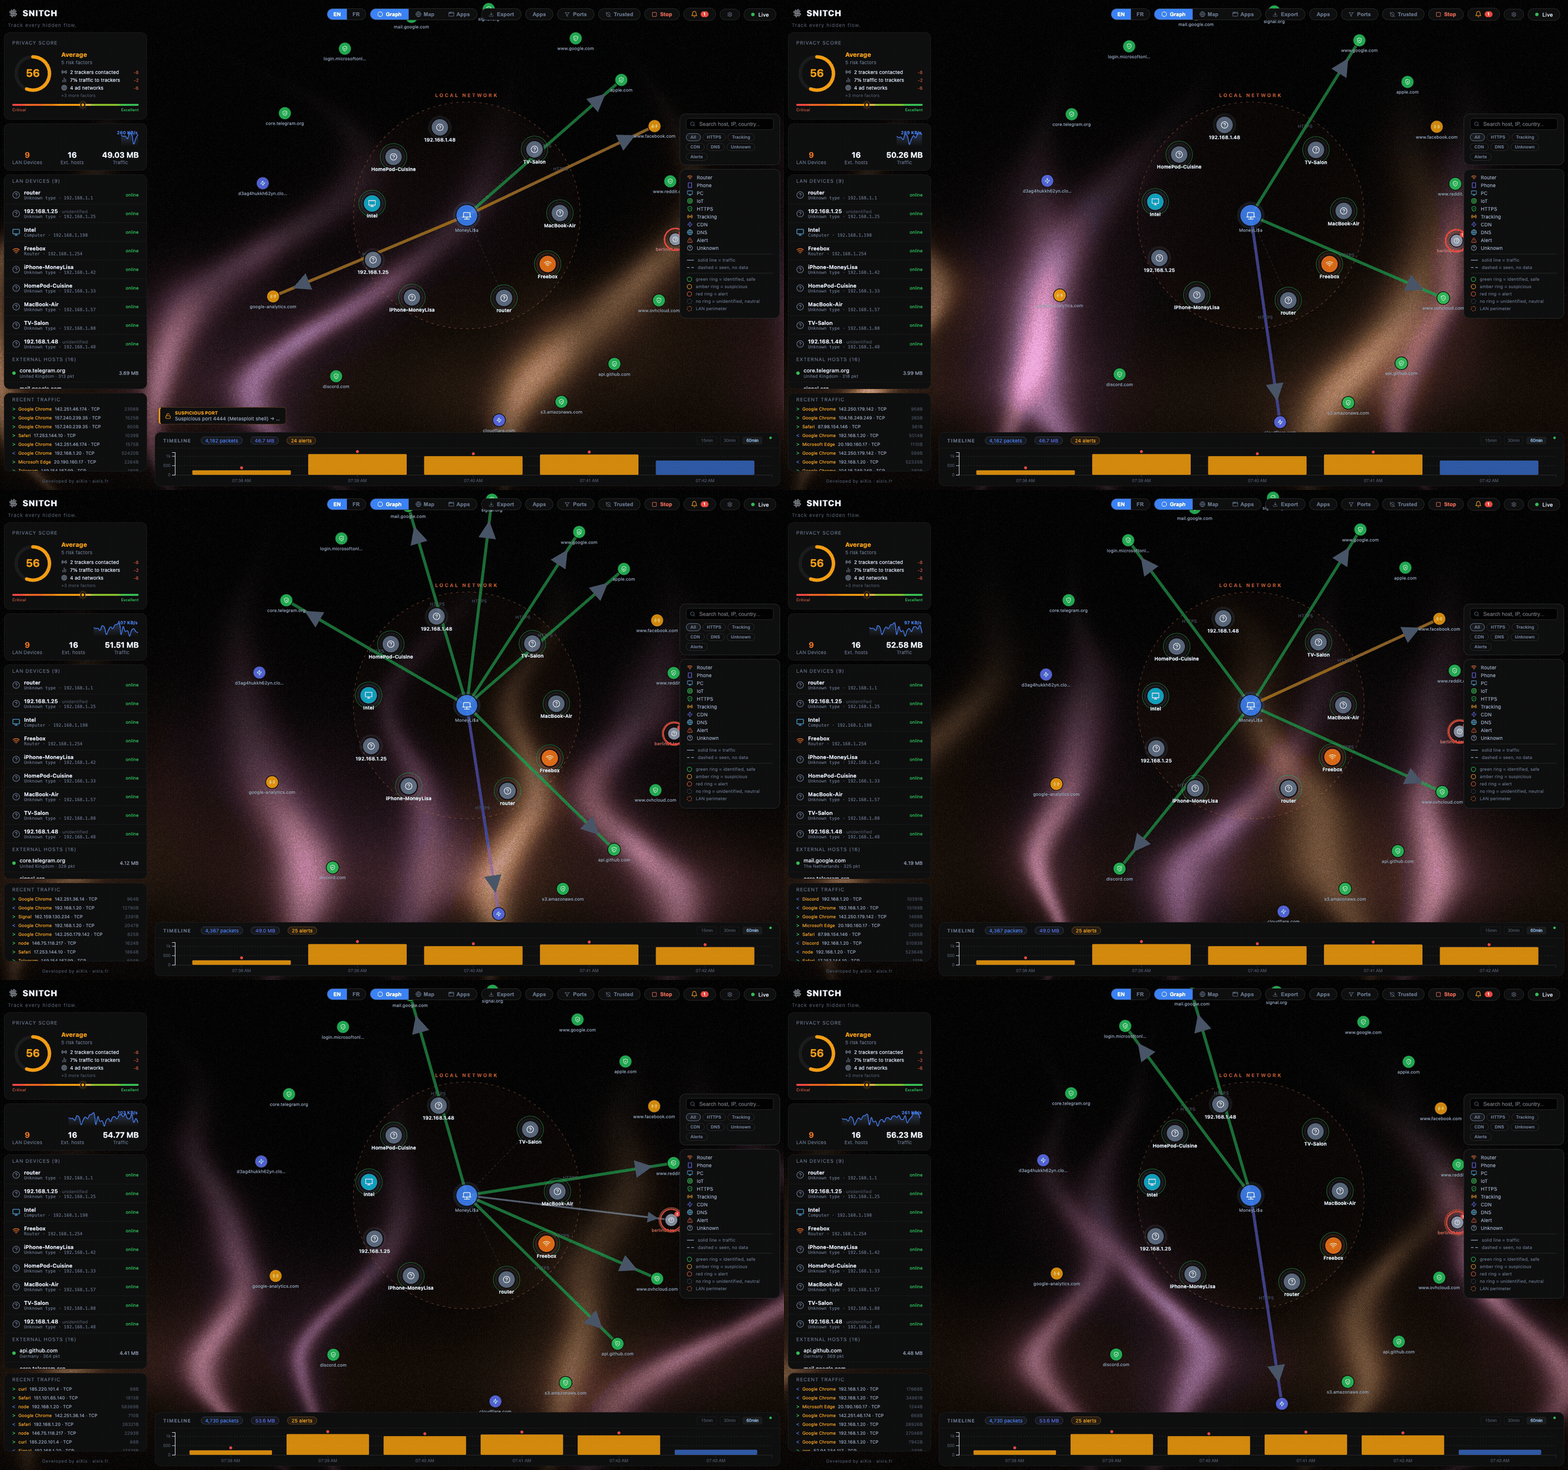
Snitch is a real-time network traffic visualizer. See every connection your computer makes — who it talks to, where they are, and which app is responsible.
The entire interface is available in English and French: use the EN / FR toggle in the top-right toolbar.
Why Snitch?
- vs Little Snitch / Lulu — those are macOS firewalls that block connections; Snitch visualizes and explains traffic, is cross-platform, free and open-source.
- vs GlassWire — Snitch is free, open-source (AGPL), requires no account and makes zero outbound calls; even geolocation is offline.
- vs Wireshark — Snitch gives a live, high-level overview anyone can read, instead of raw packet dissection.
- vs cloud-based monitors — everything runs on
127.0.0.1behind a token; your traffic data never leaves the machine.
Features
| Feature | Description |
|---|---|
| Force Graph | Live node graph — your machine at the center, every connection as a node |
| World Map | Geolocated IPs with animated arcs on an interactive globe |
| 15/30/60-min Timeline | Sliding history stored locally in SQLite (24 h retention) |
| Anomaly Detection | Flags port scans, beaconing, potential exfiltration |
| Process Attribution | Know which app generates which traffic (top 5 per connection) |
| LAN Scanner | Passive discovery via the system ARP table (no broadcast scans) |
| Privacy Score | Real-time score of your outgoing traffic exposure |
| Per-app View | Per-process destinations, volumes and 60-min history |
| Alert Suppression | Persisted "ignore host/type" rules, manageable in the UI |
| Settings Panel | Language, retention, filters, consent-gated GeoIP download, diagnostics |
| Tracker Detection | Suffix-matched domain lists shipped as editable data files (backend/classifier/lists/) |
| Bandwidth Monitor | Live MB/s sparkline |
| EN / FR UI | Full bilingual interface, one click to switch |
Download
| Platform | Package |
|---|---|
| macOS (Apple Silicon) | Snitch-1.0.0-macos-arm64.zip — unsigned build: right-click → Open |
| Linux | sudo docker compose up --build — see Docker (Linux) |
| Windows | Build from source — see Build the installer |
Or grab the latest release: github.com/aixisstudio/Snitch/releases
Stack
| Layer | Technology |
|---|---|
| Packet capture | ctypes → libpcap — Npcap (Windows) / libpcap (Linux/macOS) — own parser (IPv4/IPv6/TCP/UDP/DNS/TLS-SNI) |
| Backend API | FastAPI — WebSockets — SQLite |
| Frontend | React 18 — Vite — D3.js v7 — TopoJSON |
| Desktop wrapper | Electron 44 |
| Geolocation | Offline only — DB-IP Lite (CC BY 4.0) bundled gzip'd in backend/data/geo/, decompressed on first run; MaxMind GeoLite2 .mmdb also supported |
Security & privacy
- API token — every REST endpoint and the WebSocket require a token. Electron generates it per launch; in Docker/browser it's printed once in the backend logs and stored in
data/api_token.txt. Open the UI withhttp://localhost:8000/?token=<TOKEN>(or enter it when prompted). - Loopback-only by default — the API binds
127.0.0.1in every mode. SetSNITCH_BIND=0.0.0.0only if you explicitly want LAN access (token auth still applies). - CORS/WebSocket origin allowlist — only
localhost:5173, the backend's own origin and Electronfile://pages may connect. - Geolocation is offline-only — there is no online lookup. DB-IP Lite (CC BY 4.0) ships gzip'd in
backend/data/geo/and is auto-extracted into<data_dir>/geo/on first launch — geo works out of the box, zero network calls. You may still drop newerGeoLite2-City.mmdb/GeoLite2-ASN.mmdb(MaxMind) into<data_dir>/geo/, or download a fresh DB-IP Lite from the Settings panel (explicit consent, the only possible outbound call). - All data stays local —
snitch.db(24 h sliding window, configurable viaretention_hourssetting) anddata/logs/snitch.lognever leave the machine. No telemetry. The only possible outbound call is the opt-in DB-IP Lite download (Settings → "Download DB-IP Lite"), which requires an explicit click. - Settings persist — port filters, excluded processes, the IP whitelist, language and retention are stored in SQLite and restored on restart.
- Alert suppression — each alert has an "Ignore this type/host" action; suppression rules are persisted (
alert_suppressionstable), applied before alerts are emitted or logged, and survivable across restarts viaPOST /alerts/ignore/DELETE /alerts/ignore/GET /alerts/ignore. - History — per-minute per-host and per-process byte/packet aggregates are kept in SQLite (
host_history,process_history) for the retention window, powering the per-application view andGET /history/host/{ip}/GET /history/process/{name}. - Diagnostics —
GET /diagnosticsreturns a JSON snapshot of the runtime (capture state, geo DB status, interface, versions, paths) with no secrets; the Settings panel can export it or open the log directory (Electron). - LAN devices are discovered passively from the system ARP table — no active broadcast scanning. Device names are learned from what devices broadcast themselves: mDNS
*.local(Apple/Linux), LLMNR & NetBIOS names (Windows), DHCP hostname options, plus the full offline IEEE OUI vendor table, and your gateway is auto-detected as the router. - See docs/threat-model.md for the full threat model.
Docker (Linux)
The Docker deployment is for Linux users who want to run Snitch without installing anything beyond Docker.
Packet capture works via network_mode: host — the container sees real host traffic.
Note: Docker Desktop on Mac/Windows runs inside a VM and cannot capture traffic from the host. Use the Electron app on those platforms.
# Clone and enter the repo / Cloner puis entrer dans le dépôt
git clone <your-repo-url> snitch
cd snitch

# Optional: place your MaxMind GeoLite2-City.mmdb in data/ for offline geolocation
# Optionnel : placez votre GeoLite2-City.mmdb dans data/ pour la géolocalisation hors ligne
mkdir -p data

# Build and run (requires Docker + root/sudo for raw socket capture)
# Construire et lancer (Docker + root/sudo requis pour la capture)
sudo docker compose up --build
Get the API token (printed once at startup, or cat data/api_token.txt), then open http://localhost:8000/?token=TOKEN in your browser.
To run in the background: sudo docker compose up -d --build
Docker limitations:
- Process attribution is limited to container processes (host PIDs are not shared by default)
- LAN scanner may be unavailable on some network configurations
Development
Requirements:
- Python 3.11+
- Node.js 18+
- Npcap installed (Windows only)
- Administrator/root terminal for the backend (raw packet capture)
Demo mode / Mode démo — run the backend with
SNITCH_DEMO=1to feed synthetic traffic through the real pipeline: no root, no libpcap, no real packets touched. Ideal for screenshots, tests and previews. Lancez le backend avecSNITCH_DEMO=1pour injecter un trafic synthétique dans le pipeline réel — ni root ni libpcap ni paquets réels.
# Backend (admin terminal) — API at http://127.0.0.1:8000
cd backend
pip install -r requirements.txt
python run_backend.py   # prints the API token once

# Frontend (separate terminal) — UI at http://localhost:5173/?token=TOKEN
cd frontend
npm install
npm run dev

# Electron (optional, admin terminal) — token is injected automatically
cd electron
npm install
set VITE_DEV=1   # Windows
# VITE_DEV=1     # macOS/Linux shell
npx electron .
Tests:
cd backend && pip install -r requirements-dev.txt && python -m pytest tests/ -v
cd frontend && npm test
Build the installer
# 1 — Compile backend (PyInstaller)
cd backend
pip install pyinstaller
pyinstaller backend.spec --distpath ../dist/backend

# 2 — Build frontend
cd frontend
npm run build

# 3 — Build Electron installer
cd electron
npm run build:dir
Project structure
snitch/
├── backend/       Python FastAPI + libpcap capture engine (ctypes, own parser)
├── frontend/      React + D3.js UI (EN/FR)
├── electron/      Electron wrapper (main, splash, preload)
├── data/          Runtime data (SQLite DB, .mmdb geo DBs in geo/)
└── dist/          Compiled output (backend exe, installer)
Français
Snitch est un visualiseur de trafic réseau en temps réel. Voyez chaque connexion que votre ordinateur établit — à qui il parle, où se trouvent les serveurs, et quelle application est responsable.
Toute l'interface est disponible en français et en anglais : utilisez le sélecteur EN / FR dans la barre d'outils en haut à droite.
Pourquoi Snitch ?
- vs Little Snitch / Lulu — ce sont des pare-feux macOS qui bloquent les connexions ; Snitch visualise et explique le trafic, est multiplateforme, gratuit et open-source.
- vs GlassWire — Snitch est gratuit, open-source (AGPL), sans compte et n'effectue aucun appel sortant ; même la géolocalisation est hors ligne.
- vs Wireshark — Snitch offre une vue d'ensemble en direct lisible par tous, plutôt qu'une dissection brute de paquets.
- vs les moniteurs cloud — tout tourne sur
127.0.0.1derrière un jeton ; vos données de trafic ne quittent jamais la machine.
Fonctionnalités
| Fonctionnalité | Description |
|---|---|
| Graphe de force | Graphe de nœuds en direct — votre machine au centre, chaque connexion comme nœud |
| Carte du monde | IPs géolocalisées avec arcs animés sur un globe interactif |
| Timeline 15/30/60 min | Historique glissant stocké localement dans SQLite (rétention 24 h) |
| Détection d'anomalies | Signale scans de ports, beaconing, exfiltration potentielle |
| Attribution processus | Sachez quelle app génère quel trafic (top 5 par connexion) |
| Scanner LAN | Découverte passive via la table ARP système (aucun scan broadcast) |
| Score de confidentialité | Score en temps réel de l'exposition de votre trafic sortant |
| Vue par application | Destinations, volumes et historique 60 min par processus |
| Suppression d'alertes | Règles « ignorer hôte/type » persistées, gérables dans l'UI |
| Panneau Réglages | Langue, rétention, filtres, téléchargement GeoIP sous consentement, diagnostic |
| Détection de trackers | Listes de domaines par suffixe, livrées en fichiers de données éditables (backend/classifier/lists/) |
| Moniteur de débit | Sparkline MB/s en direct |
| UI FR / EN | Interface entièrement bilingue, bascule en un clic |
Téléchargement
| Plateforme | Paquet |
|---|---|
| macOS (Apple Silicon) | Snitch-1.0.0-macos-arm64.zip — build non signée : clic droit → Ouvrir |
| Linux | sudo docker compose up --build — voir Docker (Linux) |
| Windows | Build depuis les sources — voir Développement |
Ou récupérez la dernière release : github.com/aixisstudio/Snitch/releases
Stack technique
| Couche | Technologie |
|---|---|
| Capture de paquets | ctypes → libpcap — Npcap (Windows) / libpcap (Linux/macOS) — parseur maison (IPv4/IPv6/TCP/UDP/DNS/SNI-TLS) |
| API backend | FastAPI — WebSockets — SQLite |
| Frontend | React 18 — Vite — D3.js v7 — TopoJSON |
| Conteneur bureau | Electron 44 |
| Géolocalisation | Hors ligne uniquement — DB-IP Lite (CC BY 4.0) embarquée gzipée dans backend/data/geo/, décompressée au premier lancement ; MaxMind GeoLite2 .mmdb aussi pris en charge |
Sécurité & confidentialité
- Jeton API — chaque endpoint REST et le WebSocket exigent un jeton. Electron le génère à chaque lancement ; sous Docker/navigateur il est affiché une fois dans les logs du backend et stocké dans
data/api_token.txt. Ouvrez l'UI viahttp://localhost:8000/?token=<JETON>(ou saisissez-le à l'invite). - Loopback uniquement par défaut — l'API écoute sur
127.0.0.1dans tous les modes. Ne mettezSNITCH_BIND=0.0.0.0que pour un accès LAN explicite (le jeton reste exigé). - Liste blanche CORS/Origin WebSocket — seuls
localhost:5173, l'origine propre du backend et les pagesfile://d'Electron peuvent se connecter. - Géolocalisation 100 % hors ligne — aucune recherche en ligne. DB-IP Lite (CC BY 4.0) est embarquée gzipée dans
backend/data/geo/et auto-extraite vers<data_dir>/geo/au premier lancement — la géo fonctionne d'emblée, zéro appel réseau. Vous pouvez toujours déposer desGeoLite2-City.mmdb/GeoLite2-ASN.mmdb(MaxMind) plus récents dans<data_dir>/geo/, ou télécharger une DB-IP Lite fraîche depuis Réglages (consentement explicite, seul appel sortant possible). - Toutes les données restent locales —
snitch.db(fenêtre glissante de 24 h, configurable via le réglageretention_hours) etdata/logs/snitch.logne quittent jamais la machine. Pas de télémétrie. Le seul appel sortant possible est le téléchargement opt-in de DB-IP Lite (Réglages → « Télécharger DB-IP Lite »), qui exige un clic explicite. - Réglages persistés — filtres de ports, processus exclus, whitelist IP, langue et rétention sont stockés dans SQLite et restaurés au redémarrage.
- Suppression d'alertes — chaque alerte offre « Ignorer ce type/cet hôte » ; les règles sont persistées (
alert_suppressions), appliquées avant émission, et gérables viaPOST /alerts/ignore,DELETE /alerts/ignore,GET /alerts/ignore. - Historique — les agrégats octets/paquets par minute, par hôte et par processus sont conservés dans SQLite (
host_history,process_history) sur la fenêtre de rétention, et alimentent la vue par application ainsi queGET /history/host/{ip}etGET /history/process/{nom}. - Diagnostic —
GET /diagnosticsrenvoie un instantané JSON du runtime (état de capture, géo, interface, versions, chemins) sans secrets ; le panneau Réglages peut l'exporter ou ouvrir le dossier des logs (Electron). - Appareils LAN découverts passivement via la table ARP système — aucun scan broadcast actif. Les noms sont appris de ce que les appareils diffusent eux-mêmes : mDNS
*.local(Apple/Linux), LLMNR et noms NetBIOS (Windows), option hostname DHCP, plus la table de fabricants IEEE OUI complète hors ligne ; votre passerelle est détectée automatiquement comme routeur. - Voir docs/threat-model.md pour le modèle de menace complet.
Docker (Linux)
Le déploiement Docker est destiné aux utilisateurs Linux qui veulent lancer Snitch sans rien installer d'autre que Docker.
La capture fonctionne via network_mode: host — le conteneur voit le vrai trafic de l'hôte.
Remarque : Docker Desktop sur Mac/Windows tourne dans une VM et ne peut pas capturer le trafic de l'hôte. Utilisez l'application Electron sur ces plateformes.
git clone <url-de-votre-depot> snitch
cd snitch
mkdir -p data
sudo docker compose up --build
Récupérez le jeton API (affiché une fois au démarrage, ou cat data/api_token.txt), puis ouvrez http://localhost:8000/?token=JETON dans votre navigateur.
En arrière-plan : sudo docker compose up -d --build
Limites Docker :
- L'attribution de processus est limitée aux processus du conteneur
- Le scanner LAN peut être indisponible selon la configuration réseau
Développement
Prérequis : Python 3.11+, Node.js 18+, Npcap (Windows), terminal administrateur pour le backend.
# Backend (terminal admin)
cd backend
pip install -r requirements.txt
python run_backend.py

# Frontend (autre terminal)
cd frontend
npm install
npm run dev

# Electron (optionnel) — le jeton est injecté automatiquement
cd electron
npm install
VITE_DEV=1 npx electron .
Tests :
cd backend && pip install -r requirements-dev.txt && python -m pytest tests/ -v
cd frontend && npm test
Structure du projet
snitch/
├── backend/       Moteur de capture Python FastAPI + libpcap (ctypes, parseur maison)
├── frontend/      Interface React + D3.js (FR/EN)
├── electron/      Conteneur Electron (main, splash, preload)
├── data/          Données d'exécution (SQLite, bases .mmdb dans geo/)
└── dist/          Sortie compilée (exe backend, installateur)
License / Licence
AGPL v3 — see / voir LICENSE.
EN: Free to use, study, and modify. Derivative works must remain open source under AGPL v3. FR: Libre d'utilisation, d'étude et de modification. Les œuvres dérivées doivent rester open source sous AGPL v3.
Similar repos


Languages
Python
50.8%
JavaScript
48.1%
Real-time network traffic visualizer — see every connection your computer makes. Privacy-first, 100% local. / Visualiseur de trafic réseau en temps réel, 100% local.
See the codeSee what people are saying
README
Snitch
Track every hidden flow. / Traquez chaque flux masqué.
⭐ If Snitch helps you, a star means a lot! / Si Snitch vous aide, une étoile compte beaucoup ! ⭐
English
Snitch is a real-time network traffic visualizer. See every connection your computer makes — who it talks to, where they are, and which app is responsible.
The entire interface is available in English and French: use the EN / FR toggle in the top-right toolbar.
Why Snitch?
- vs Little Snitch / Lulu — those are macOS firewalls that block connections; Snitch visualizes and explains traffic, is cross-platform, free and open-source.
- vs GlassWire — Snitch is free, open-source (AGPL), requires no account and makes zero outbound calls; even geolocation is offline.
- vs Wireshark — Snitch gives a live, high-level overview anyone can read, instead of raw packet dissection.
- vs cloud-based monitors — everything runs on
127.0.0.1behind a token; your traffic data never leaves the machine.
Features
| Feature | Description |
|---|---|
| Force Graph | Live node graph — your machine at the center, every connection as a node |
| World Map | Geolocated IPs with animated arcs on an interactive globe |
| 15/30/60-min Timeline | Sliding history stored locally in SQLite (24 h retention) |
| Anomaly Detection | Flags port scans, beaconing, potential exfiltration |
| Process Attribution | Know which app generates which traffic (top 5 per connection) |
| LAN Scanner | Passive discovery via the system ARP table (no broadcast scans) |
| Privacy Score | Real-time score of your outgoing traffic exposure |
| Per-app View | Per-process destinations, volumes and 60-min history |
| Alert Suppression | Persisted "ignore host/type" rules, manageable in the UI |
| Settings Panel | Language, retention, filters, consent-gated GeoIP download, diagnostics |
| Tracker Detection | Suffix-matched domain lists shipped as editable data files (backend/classifier/lists/) |
| Bandwidth Monitor | Live MB/s sparkline |
| EN / FR UI | Full bilingual interface, one click to switch |
Download
| Platform | Package |
|---|---|
| macOS (Apple Silicon) | Snitch-1.0.0-macos-arm64.zip — unsigned build: right-click → Open |
| Linux | sudo docker compose up --build — see Docker (Linux) |
| Windows | Build from source — see Build the installer |
Or grab the latest release: github.com/aixisstudio/Snitch/releases
Stack
| Layer | Technology |
|---|---|
| Packet capture | ctypes → libpcap — Npcap (Windows) / libpcap (Linux/macOS) — own parser (IPv4/IPv6/TCP/UDP/DNS/TLS-SNI) |
| Backend API | FastAPI — WebSockets — SQLite |
| Frontend | React 18 — Vite — D3.js v7 — TopoJSON |
| Desktop wrapper | Electron 44 |
| Geolocation | Offline only — DB-IP Lite (CC BY 4.0) bundled gzip'd in backend/data/geo/, decompressed on first run; MaxMind GeoLite2 .mmdb also supported |
Security & privacy
- API token — every REST endpoint and the WebSocket require a token. Electron generates it per launch; in Docker/browser it's printed once in the backend logs and stored in
data/api_token.txt. Open the UI withhttp://localhost:8000/?token=<TOKEN>(or enter it when prompted). - Loopback-only by default — the API binds
127.0.0.1in every mode. SetSNITCH_BIND=0.0.0.0only if you explicitly want LAN access (token auth still applies). - CORS/WebSocket origin allowlist — only
localhost:5173, the backend's own origin and Electronfile://pages may connect. - Geolocation is offline-only — there is no online lookup. DB-IP Lite (CC BY 4.0) ships gzip'd in
backend/data/geo/and is auto-extracted into<data_dir>/geo/on first launch — geo works out of the box, zero network calls. You may still drop newerGeoLite2-City.mmdb/GeoLite2-ASN.mmdb(MaxMind) into<data_dir>/geo/, or download a fresh DB-IP Lite from the Settings panel (explicit consent, the only possible outbound call). - All data stays local —
snitch.db(24 h sliding window, configurable viaretention_hourssetting) anddata/logs/snitch.lognever leave the machine. No telemetry. The only possible outbound call is the opt-in DB-IP Lite download (Settings → "Download DB-IP Lite"), which requires an explicit click. - Settings persist — port filters, excluded processes, the IP whitelist, language and retention are stored in SQLite and restored on restart.
- Alert suppression — each alert has an "Ignore this type/host" action; suppression rules are persisted (
alert_suppressionstable), applied before alerts are emitted or logged, and survivable across restarts viaPOST /alerts/ignore/DELETE /alerts/ignore/GET /alerts/ignore. - History — per-minute per-host and per-process byte/packet aggregates are kept in SQLite (
host_history,process_history) for the retention window, powering the per-application view andGET /history/host/{ip}/GET /history/process/{name}. - Diagnostics —
GET /diagnosticsreturns a JSON snapshot of the runtime (capture state, geo DB status, interface, versions, paths) with no secrets; the Settings panel can export it or open the log directory (Electron). - LAN devices are discovered passively from the system ARP table — no active broadcast scanning. Device names are learned from what devices broadcast themselves: mDNS
*.local(Apple/Linux), LLMNR & NetBIOS names (Windows), DHCP hostname options, plus the full offline IEEE OUI vendor table, and your gateway is auto-detected as the router. - See docs/threat-model.md for the full threat model.
Docker (Linux)
The Docker deployment is for Linux users who want to run Snitch without installing anything beyond Docker.
Packet capture works via network_mode: host — the container sees real host traffic.
Note: Docker Desktop on Mac/Windows runs inside a VM and cannot capture traffic from the host. Use the Electron app on those platforms.
# Clone and enter the repo / Cloner puis entrer dans le dépôt
git clone <your-repo-url> snitch
cd snitch

# Optional: place your MaxMind GeoLite2-City.mmdb in data/ for offline geolocation
# Optionnel : placez votre GeoLite2-City.mmdb dans data/ pour la géolocalisation hors ligne
mkdir -p data

# Build and run (requires Docker + root/sudo for raw socket capture)
# Construire et lancer (Docker + root/sudo requis pour la capture)
sudo docker compose up --build
Get the API token (printed once at startup, or cat data/api_token.txt), then open http://localhost:8000/?token=TOKEN in your browser.
To run in the background: sudo docker compose up -d --build
Docker limitations:
- Process attribution is limited to container processes (host PIDs are not shared by default)
- LAN scanner may be unavailable on some network configurations
Development
Requirements:
- Python 3.11+
- Node.js 18+
- Npcap installed (Windows only)
- Administrator/root terminal for the backend (raw packet capture)
Demo mode / Mode démo — run the backend with
SNITCH_DEMO=1to feed synthetic traffic through the real pipeline: no root, no libpcap, no real packets touched. Ideal for screenshots, tests and previews. Lancez le backend avecSNITCH_DEMO=1pour injecter un trafic synthétique dans le pipeline réel — ni root ni libpcap ni paquets réels.
# Backend (admin terminal) — API at http://127.0.0.1:8000
cd backend
pip install -r requirements.txt
python run_backend.py   # prints the API token once

# Frontend (separate terminal) — UI at http://localhost:5173/?token=TOKEN
cd frontend
npm install
npm run dev

# Electron (optional, admin terminal) — token is injected automatically
cd electron
npm install
set VITE_DEV=1   # Windows
# VITE_DEV=1     # macOS/Linux shell
npx electron .
Tests:
cd backend && pip install -r requirements-dev.txt && python -m pytest tests/ -v
cd frontend && npm test
Build the installer
# 1 — Compile backend (PyInstaller)
cd backend
pip install pyinstaller
pyinstaller backend.spec --distpath ../dist/backend

# 2 — Build frontend
cd frontend
npm run build

# 3 — Build Electron installer
cd electron
npm run build:dir
Project structure
snitch/
├── backend/       Python FastAPI + libpcap capture engine (ctypes, own parser)
├── frontend/      React + D3.js UI (EN/FR)
├── electron/      Electron wrapper (main, splash, preload)
├── data/          Runtime data (SQLite DB, .mmdb geo DBs in geo/)
└── dist/          Compiled output (backend exe, installer)
Français
Snitch est un visualiseur de trafic réseau en temps réel. Voyez chaque connexion que votre ordinateur établit — à qui il parle, où se trouvent les serveurs, et quelle application est responsable.
Toute l'interface est disponible en français et en anglais : utilisez le sélecteur EN / FR dans la barre d'outils en haut à droite.
Pourquoi Snitch ?
- vs Little Snitch / Lulu — ce sont des pare-feux macOS qui bloquent les connexions ; Snitch visualise et explique le trafic, est multiplateforme, gratuit et open-source.
- vs GlassWire — Snitch est gratuit, open-source (AGPL), sans compte et n'effectue aucun appel sortant ; même la géolocalisation est hors ligne.
- vs Wireshark — Snitch offre une vue d'ensemble en direct lisible par tous, plutôt qu'une dissection brute de paquets.
- vs les moniteurs cloud — tout tourne sur
127.0.0.1derrière un jeton ; vos données de trafic ne quittent jamais la machine.
Fonctionnalités
| Fonctionnalité | Description |
|---|---|
| Graphe de force | Graphe de nœuds en direct — votre machine au centre, chaque connexion comme nœud |
| Carte du monde | IPs géolocalisées avec arcs animés sur un globe interactif |
| Timeline 15/30/60 min | Historique glissant stocké localement dans SQLite (rétention 24 h) |
| Détection d'anomalies | Signale scans de ports, beaconing, exfiltration potentielle |
| Attribution processus | Sachez quelle app génère quel trafic (top 5 par connexion) |
| Scanner LAN | Découverte passive via la table ARP système (aucun scan broadcast) |
| Score de confidentialité | Score en temps réel de l'exposition de votre trafic sortant |
| Vue par application | Destinations, volumes et historique 60 min par processus |
| Suppression d'alertes | Règles « ignorer hôte/type » persistées, gérables dans l'UI |
| Panneau Réglages | Langue, rétention, filtres, téléchargement GeoIP sous consentement, diagnostic |
| Détection de trackers | Listes de domaines par suffixe, livrées en fichiers de données éditables (backend/classifier/lists/) |
| Moniteur de débit | Sparkline MB/s en direct |
| UI FR / EN | Interface entièrement bilingue, bascule en un clic |
Téléchargement
| Plateforme | Paquet |
|---|---|
| macOS (Apple Silicon) | Snitch-1.0.0-macos-arm64.zip — build non signée : clic droit → Ouvrir |
| Linux | sudo docker compose up --build — voir Docker (Linux) |
| Windows | Build depuis les sources — voir Développement |
Ou récupérez la dernière release : github.com/aixisstudio/Snitch/releases
Stack technique
| Couche | Technologie |
|---|---|
| Capture de paquets | ctypes → libpcap — Npcap (Windows) / libpcap (Linux/macOS) — parseur maison (IPv4/IPv6/TCP/UDP/DNS/SNI-TLS) |
| API backend | FastAPI — WebSockets — SQLite |
| Frontend | React 18 — Vite — D3.js v7 — TopoJSON |
| Conteneur bureau | Electron 44 |
| Géolocalisation | Hors ligne uniquement — DB-IP Lite (CC BY 4.0) embarquée gzipée dans backend/data/geo/, décompressée au premier lancement ; MaxMind GeoLite2 .mmdb aussi pris en charge |
Sécurité & confidentialité
- Jeton API — chaque endpoint REST et le WebSocket exigent un jeton. Electron le génère à chaque lancement ; sous Docker/navigateur il est affiché une fois dans les logs du backend et stocké dans
data/api_token.txt. Ouvrez l'UI viahttp://localhost:8000/?token=<JETON>(ou saisissez-le à l'invite). - Loopback uniquement par défaut — l'API écoute sur
127.0.0.1dans tous les modes. Ne mettezSNITCH_BIND=0.0.0.0que pour un accès LAN explicite (le jeton reste exigé). - Liste blanche CORS/Origin WebSocket — seuls
localhost:5173, l'origine propre du backend et les pagesfile://d'Electron peuvent se connecter. - Géolocalisation 100 % hors ligne — aucune recherche en ligne. DB-IP Lite (CC BY 4.0) est embarquée gzipée dans
backend/data/geo/et auto-extraite vers<data_dir>/geo/au premier lancement — la géo fonctionne d'emblée, zéro appel réseau. Vous pouvez toujours déposer desGeoLite2-City.mmdb/GeoLite2-ASN.mmdb(MaxMind) plus récents dans<data_dir>/geo/, ou télécharger une DB-IP Lite fraîche depuis Réglages (consentement explicite, seul appel sortant possible). - Toutes les données restent locales —
snitch.db(fenêtre glissante de 24 h, configurable via le réglageretention_hours) etdata/logs/snitch.logne quittent jamais la machine. Pas de télémétrie. Le seul appel sortant possible est le téléchargement opt-in de DB-IP Lite (Réglages → « Télécharger DB-IP Lite »), qui exige un clic explicite. - Réglages persistés — filtres de ports, processus exclus, whitelist IP, langue et rétention sont stockés dans SQLite et restaurés au redémarrage.
- Suppression d'alertes — chaque alerte offre « Ignorer ce type/cet hôte » ; les règles sont persistées (
alert_suppressions), appliquées avant émission, et gérables viaPOST /alerts/ignore,DELETE /alerts/ignore,GET /alerts/ignore. - Historique — les agrégats octets/paquets par minute, par hôte et par processus sont conservés dans SQLite (
host_history,process_history) sur la fenêtre de rétention, et alimentent la vue par application ainsi queGET /history/host/{ip}etGET /history/process/{nom}. - Diagnostic —
GET /diagnosticsrenvoie un instantané JSON du runtime (état de capture, géo, interface, versions, chemins) sans secrets ; le panneau Réglages peut l'exporter ou ouvrir le dossier des logs (Electron). - Appareils LAN découverts passivement via la table ARP système — aucun scan broadcast actif. Les noms sont appris de ce que les appareils diffusent eux-mêmes : mDNS
*.local(Apple/Linux), LLMNR et noms NetBIOS (Windows), option hostname DHCP, plus la table de fabricants IEEE OUI complète hors ligne ; votre passerelle est détectée automatiquement comme routeur. - Voir docs/threat-model.md pour le modèle de menace complet.
Docker (Linux)
Le déploiement Docker est destiné aux utilisateurs Linux qui veulent lancer Snitch sans rien installer d'autre que Docker.
La capture fonctionne via network_mode: host — le conteneur voit le vrai trafic de l'hôte.
Remarque : Docker Desktop sur Mac/Windows tourne dans une VM et ne peut pas capturer le trafic de l'hôte. Utilisez l'application Electron sur ces plateformes.
git clone <url-de-votre-depot> snitch
cd snitch
mkdir -p data
sudo docker compose up --build
Récupérez le jeton API (affiché une fois au démarrage, ou cat data/api_token.txt), puis ouvrez http://localhost:8000/?token=JETON dans votre navigateur.
En arrière-plan : sudo docker compose up -d --build
Limites Docker :
- L'attribution de processus est limitée aux processus du conteneur
- Le scanner LAN peut être indisponible selon la configuration réseau
Développement
Prérequis : Python 3.11+, Node.js 18+, Npcap (Windows), terminal administrateur pour le backend.
# Backend (terminal admin)
cd backend
pip install -r requirements.txt
python run_backend.py

# Frontend (autre terminal)
cd frontend
npm install
npm run dev

# Electron (optionnel) — le jeton est injecté automatiquement
cd electron
npm install
VITE_DEV=1 npx electron .
Tests :
cd backend && pip install -r requirements-dev.txt && python -m pytest tests/ -v
cd frontend && npm test
Structure du projet
snitch/
├── backend/       Moteur de capture Python FastAPI + libpcap (ctypes, parseur maison)
├── frontend/      Interface React + D3.js (FR/EN)
├── electron/      Conteneur Electron (main, splash, preload)
├── data/          Données d'exécution (SQLite, bases .mmdb dans geo/)
└── dist/          Sortie compilée (exe backend, installateur)
License / Licence
AGPL v3 — see / voir LICENSE.
EN: Free to use, study, and modify. Derivative works must remain open source under AGPL v3. FR: Libre d'utilisation, d'étude et de modification. Les œuvres dérivées doivent rester open source sous AGPL v3.
Similar repos
Languages
Python
50.8%
JavaScript
48.1%