
Ask a question, get a live dashboard of your system in seconds. An Omarchy bar plugin built with yeet.
See the codeSee what people are saying
README
yeet AI: Ask a question, generate a live realtime dashboard of your system in seconds.
Ask for a chart of this host and get one, live, in the Omarchy bar. The model does not describe the reading; it writes the instrument that takes it, and the panel draws what arrives.





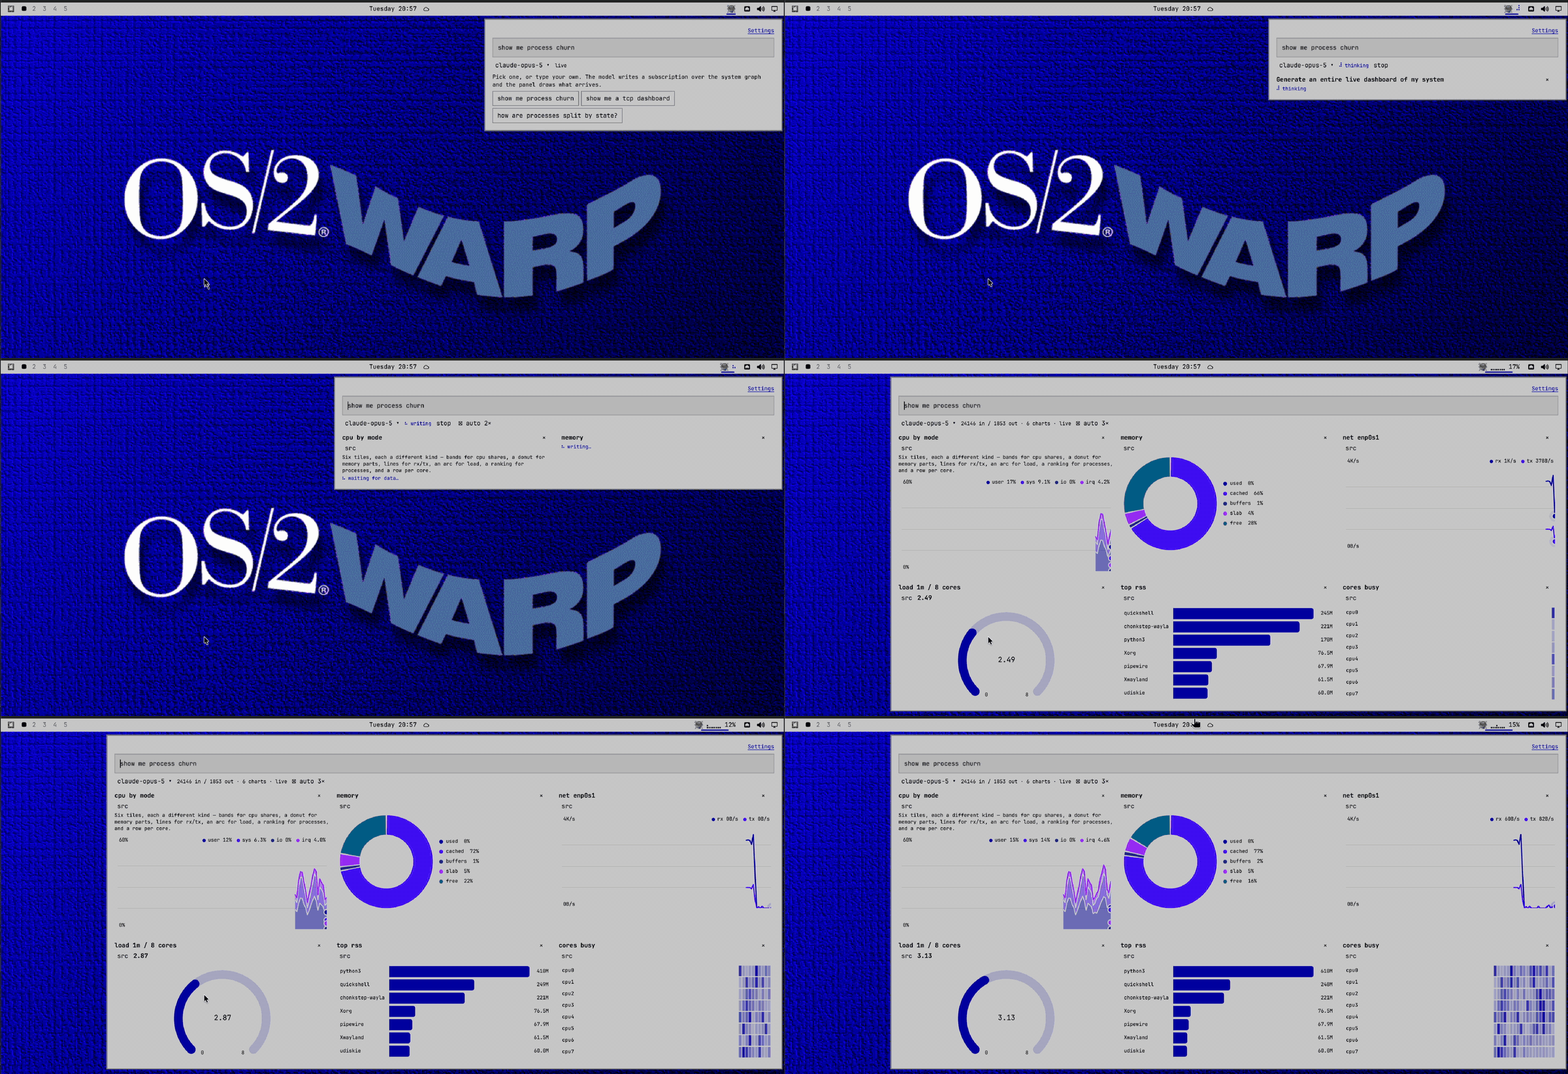
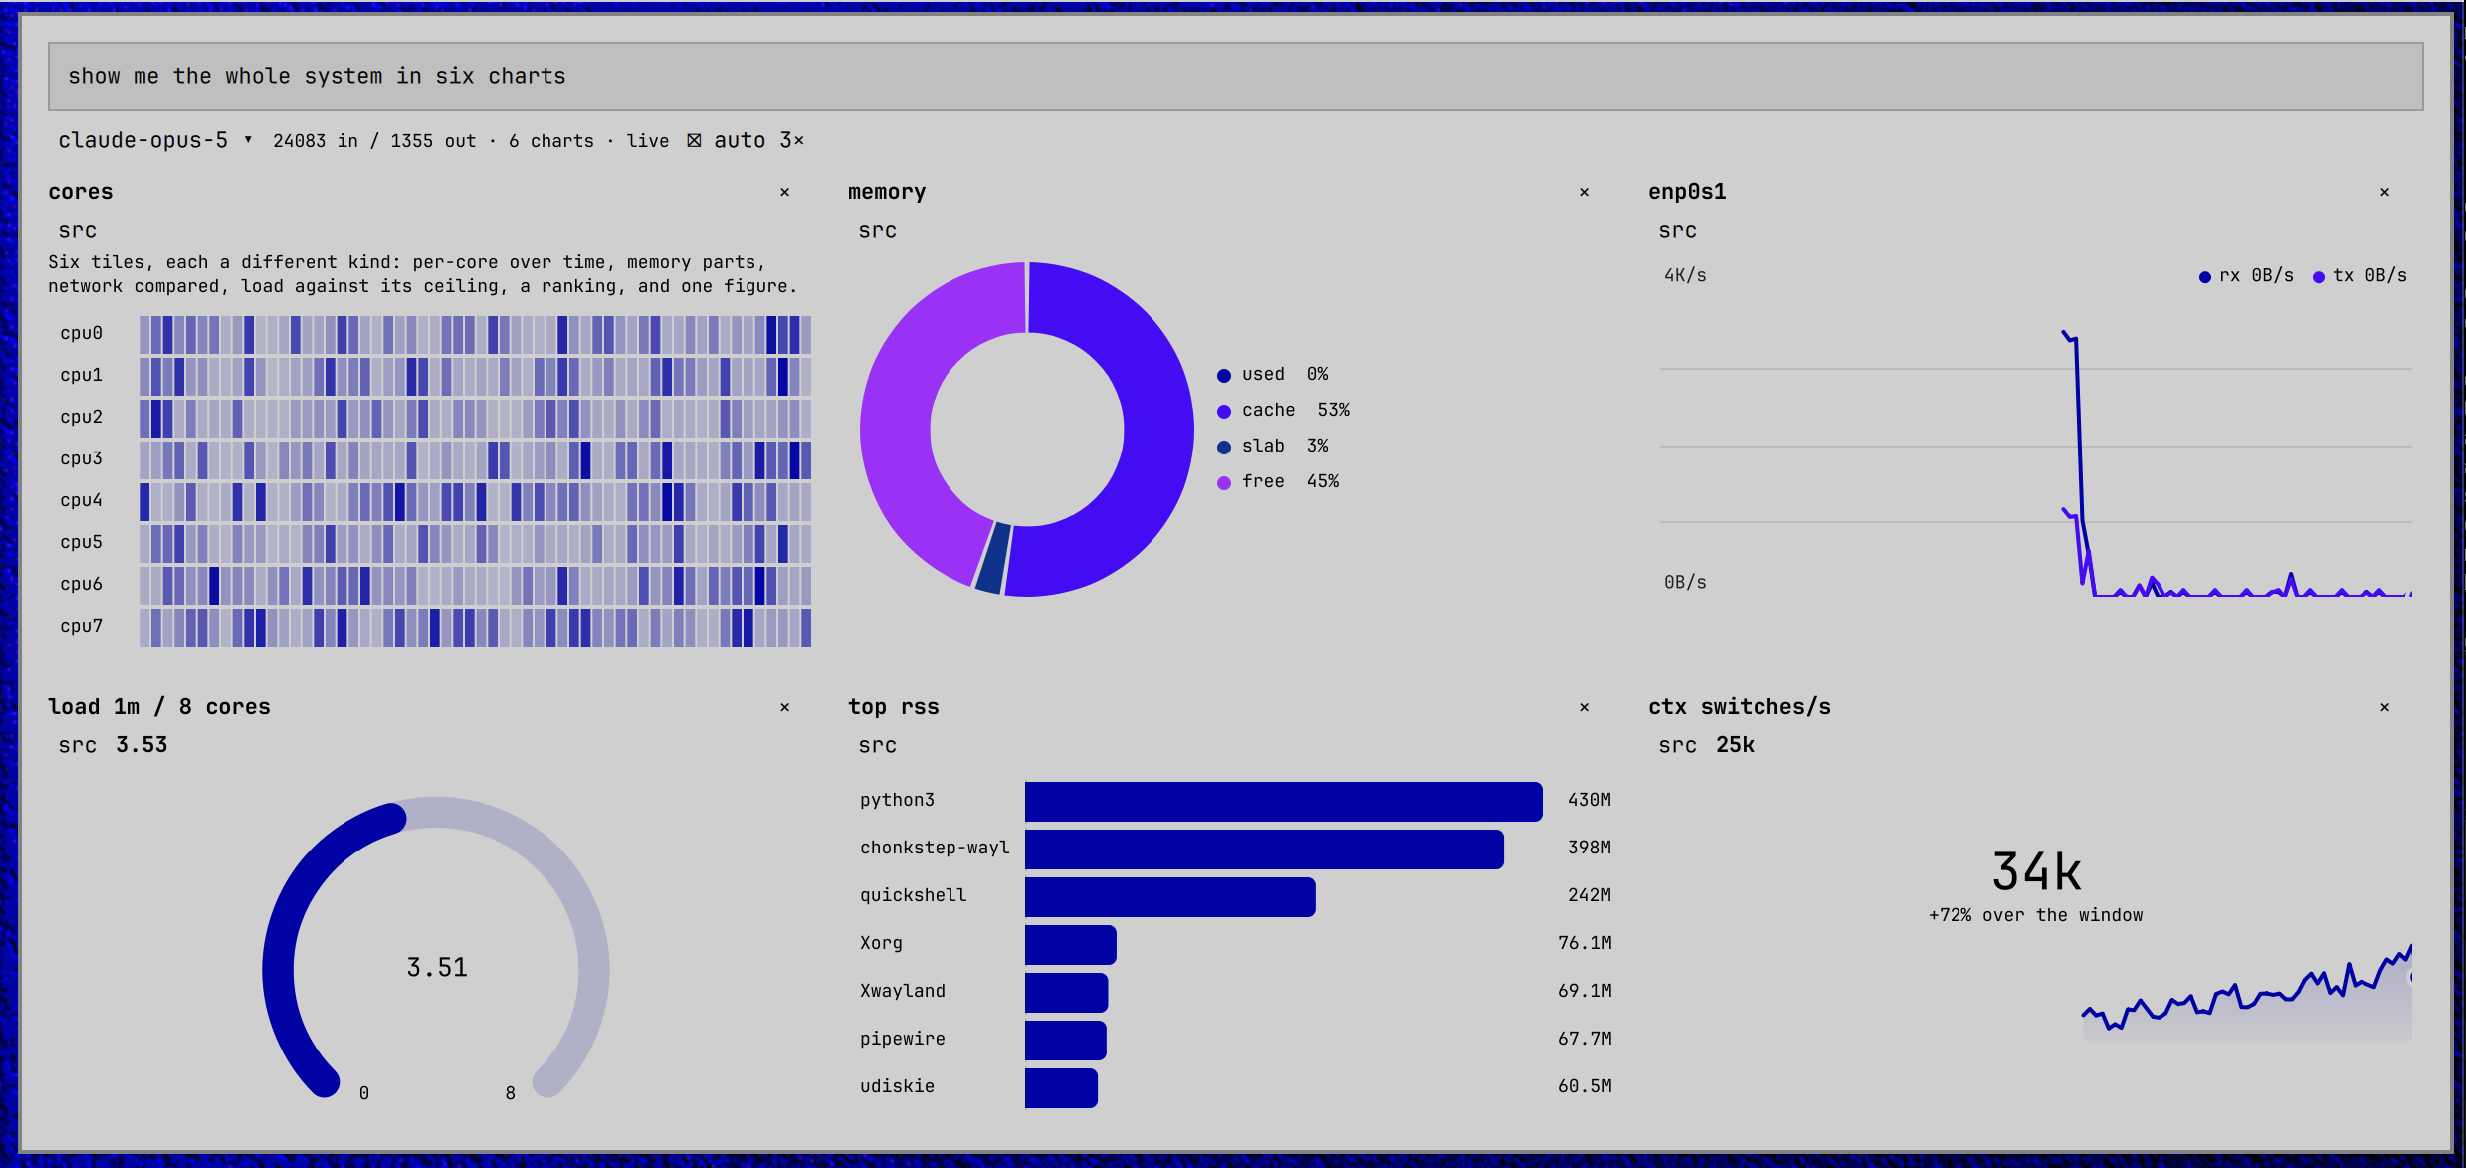
Click the yeet icon; a panel drops down with one input and three suggestions. Ask — show me the whole system in six charts, how busy is each cpu core?, which processes use the most memory? — and a subscription over the system graph starts in a yeet isolate on the machine, with a sentence on which chart was chosen and why. Twelve kinds, from gauges and heat maps to rankings and scatters, in a grid that grows with every question.
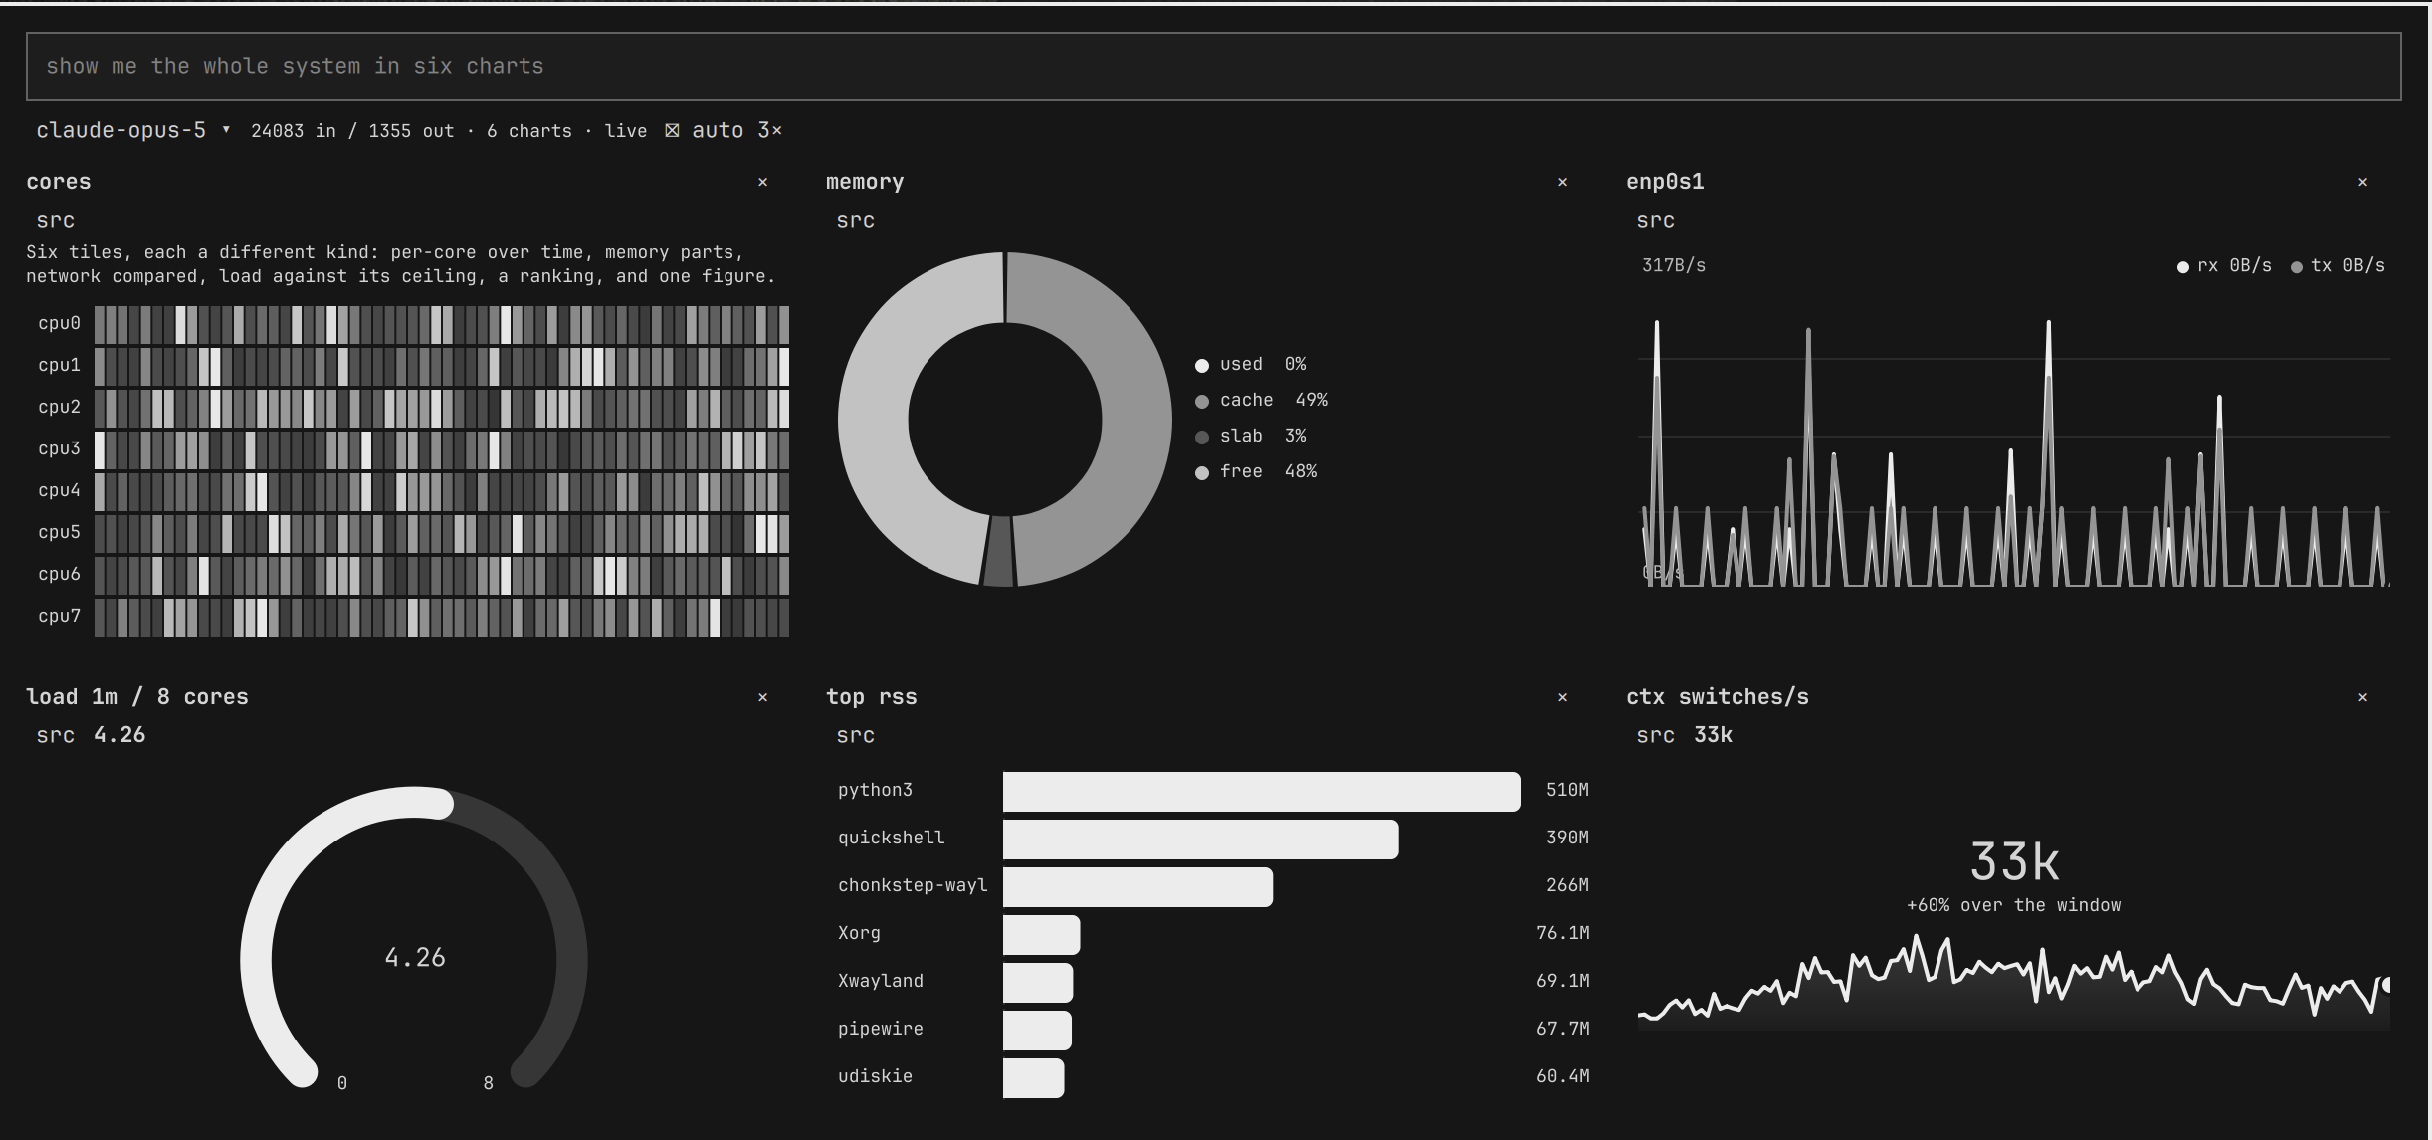
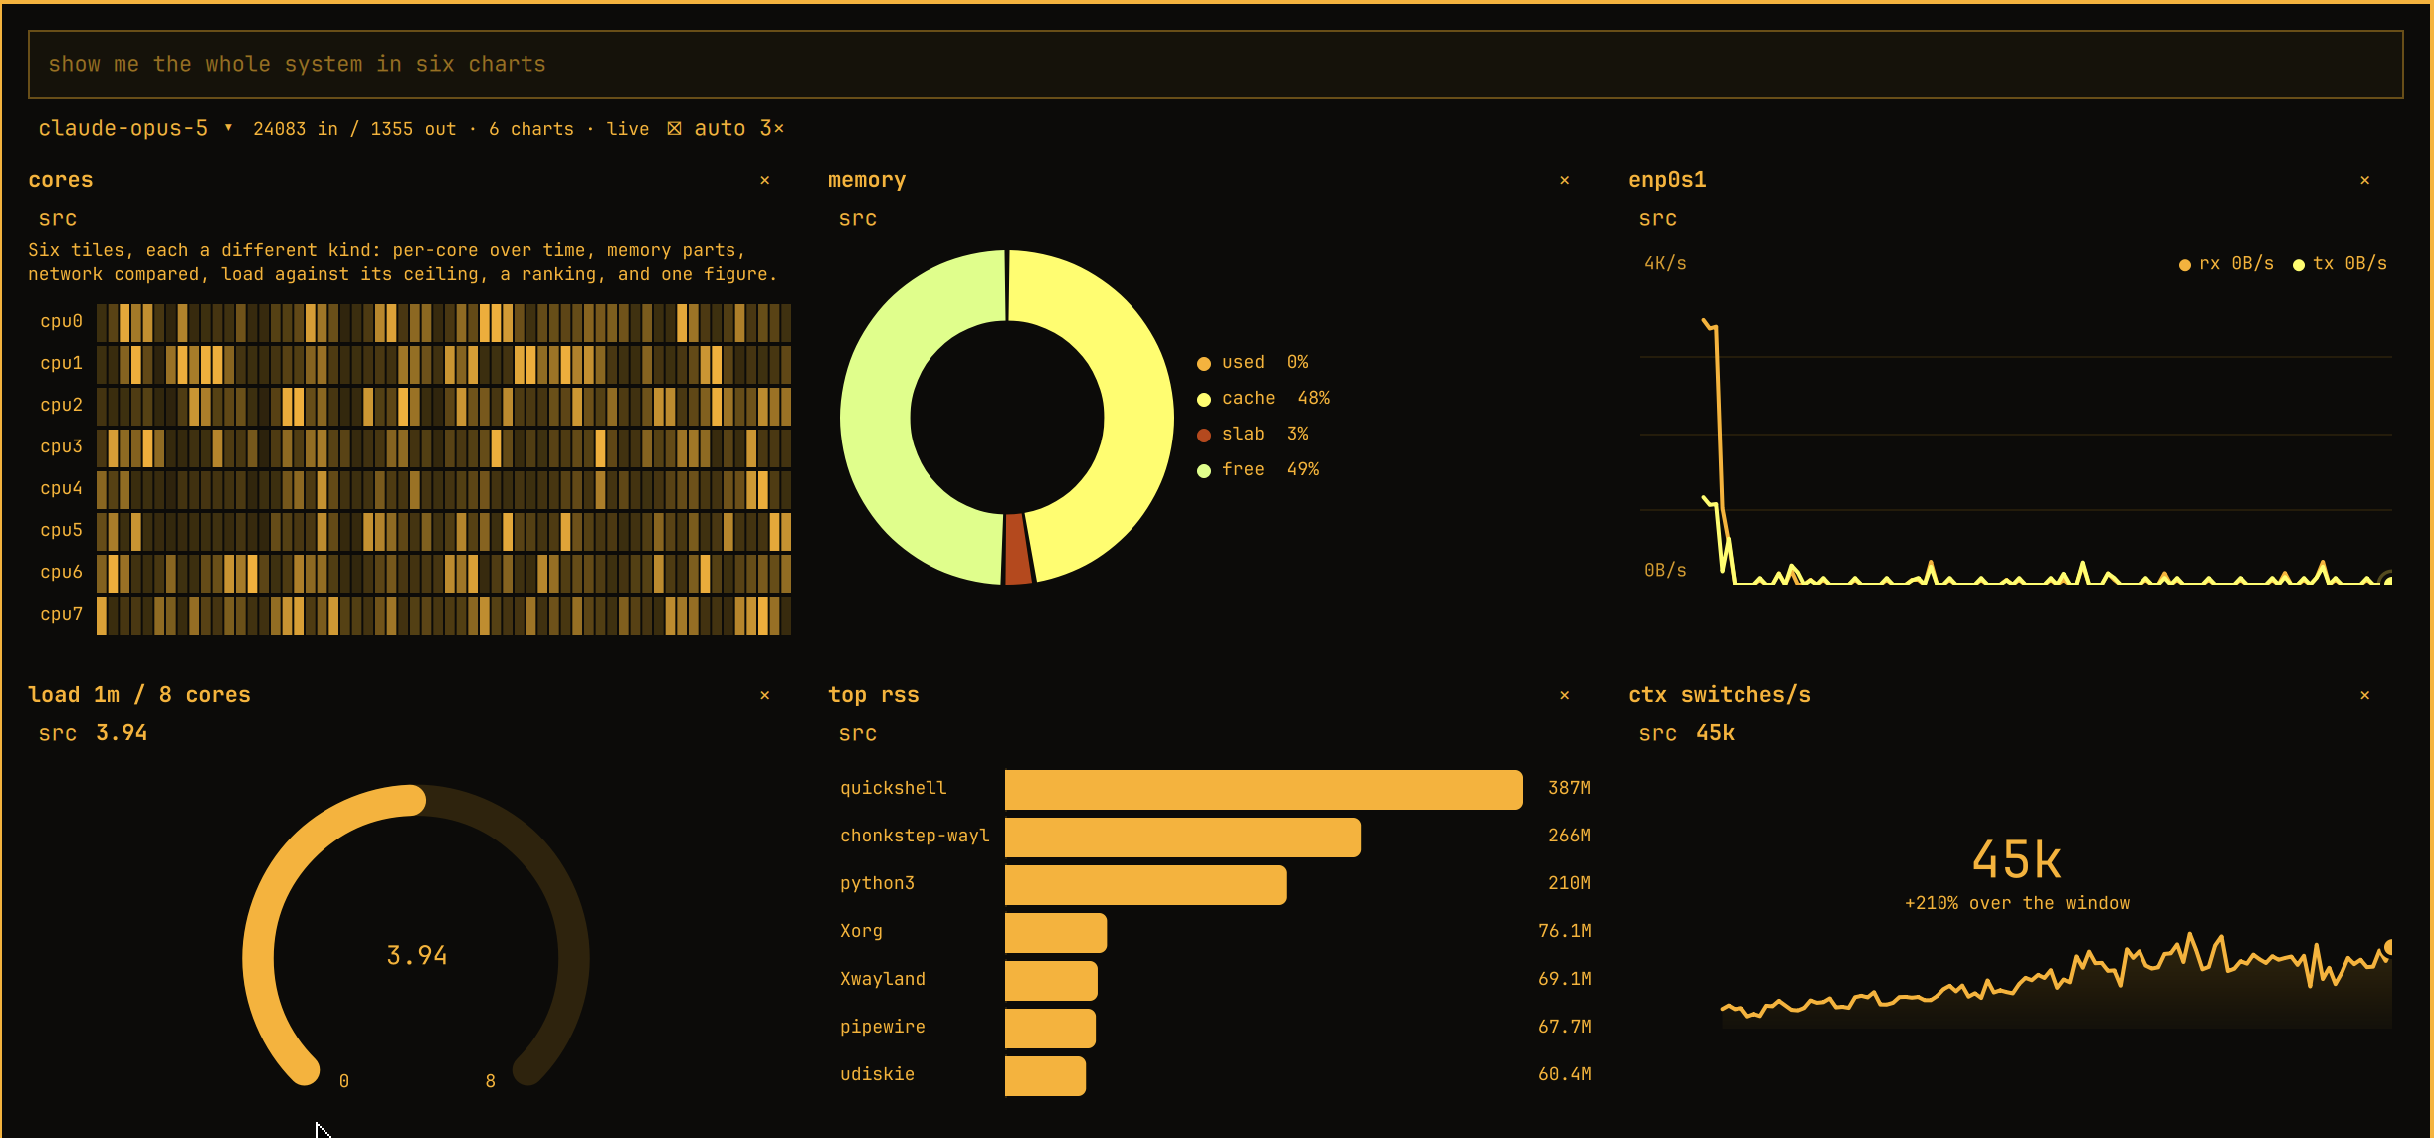
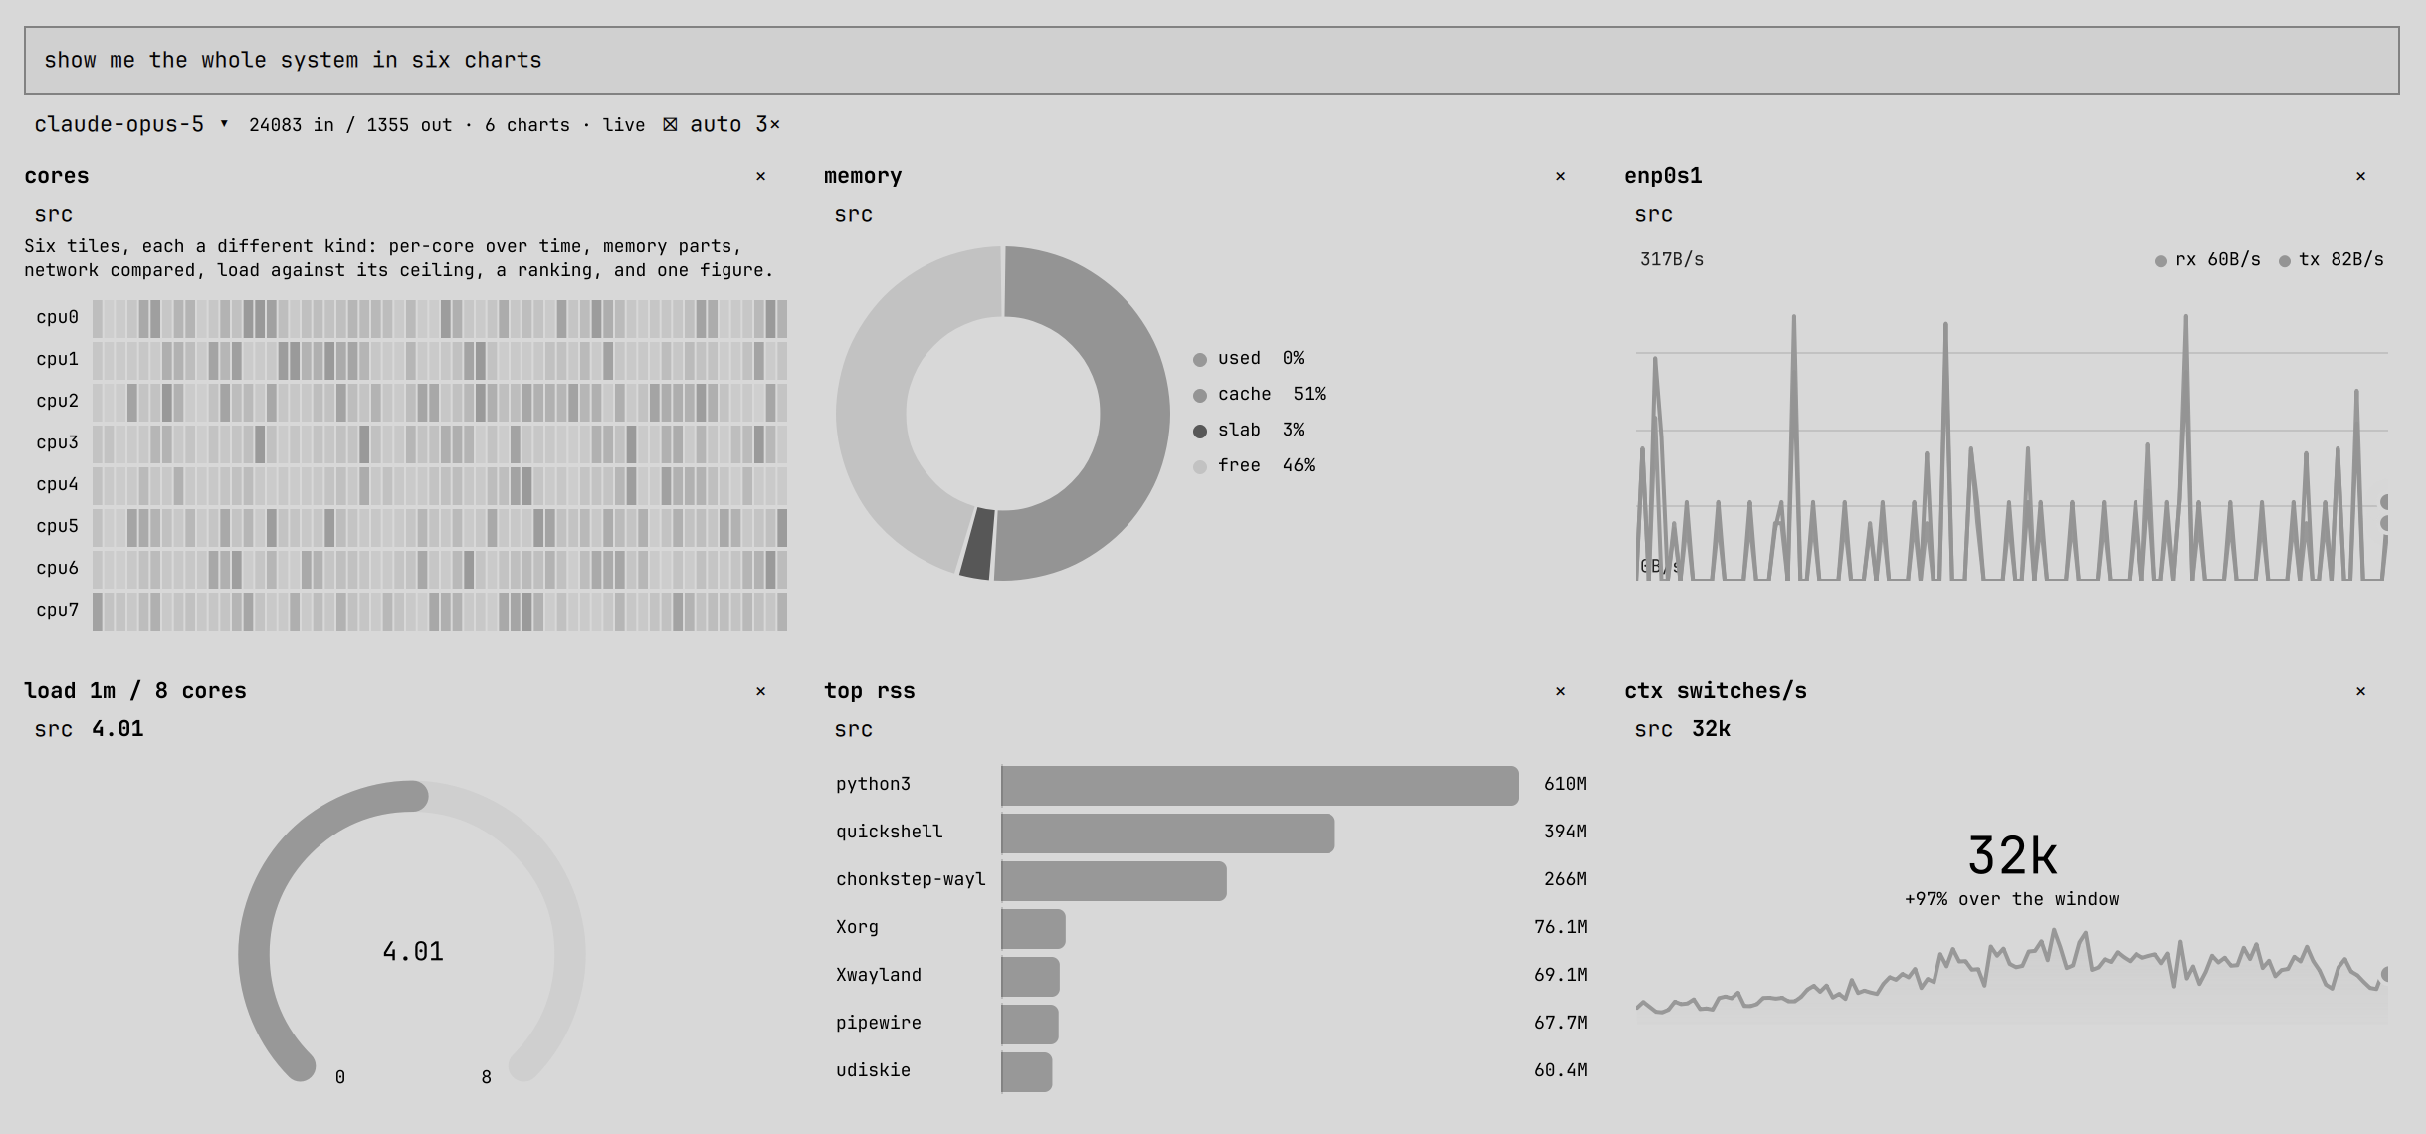
Every colour is the theme's. Series take the accent and hues turned from it — greys on a monochrome theme — so the same dashboard belongs to whatever is running, and follows a theme change on the spot:
Requirements
- yeet —
yeetonPATHwithyeetdrunning, andyeet logincompleted. Charts need the daemon; asking needs the login, since the model is reached through the platform'syeet:ai. scriptfrom util-linux, which every Arch install has
The plugin runs one isolate — yeet run app.js under script, so it has a
terminal — and talks to it over that process's stdin and stdout. No port is
opened. Charts live in that isolate, which stops a few seconds after the
last bar widget goes away, so a shell restart clears the panel.
Install
Install yeet and log this host in, then add the plugin:
curl -fsSL https://yeet.cx | sh
yeet login
omarchy plugin add https://github.com/yeet-src/omarchy-yeet-ai --enable
Other ways to install yeet are in the manual installation guide.
The model is chosen from a pull-down in the panel — claude-opus-5 by
default — from the list in MODELS at the top of app/page.jsx. The
choice lives as long as the isolate does.
Remove
omarchy plugin remove cx.yeet.yeet-ai
How a question becomes a chart
Twelve kinds: area, line, overlay, stacked, split, heat
and sparks over readings in time; gauge, stat and meters for
readings against a scale; bars and pie for a ranking or the parts
of a whole; scatter for two properties of many things. A new sample
slides in from the right, a changed bar or sector eases to its new
size, and the head of a live line pulses. Hover anything for its value.
This began as a fork of proctop
with the fixed charts taken out and the model put in.
Every reading comes from yeet's
system graph,
a typed GraphQL view of the host — processes, cpu, memory, network,
sockets, containers, sensors — where every field can be subscribed to
at an interval, so nothing here polls. The model answers in markdown,
and the part of the answer that is an instrument rather than a sentence
travels as a :::chart container directive. A modified remark
pipeline in the isolate parses the reply as it streams, lifts each
block's JavaScript out, and executes it in the yeet engine's V8
isolate on the host, where yeet.graph.subscribe
is in scope:
  Omarchy bar                       yeet isolate (V8, on the host)
  ┌───────────────────────┐          ┌───────────────────────────────────┐
  │ "how busy is the cpu?"│ ───────▶ │ agent ── prompt + schema ──▶ model│
  │                       │          │            ▲            │         │
  │  ┌──────┐ ┌────────┐  │          │   tools    │     markdown reply    │
  │  │ heat │ │ gauge  │  │          │  graph_schema        streams in   │
  │  └──────┘ └────────┘  │          │  graph_query           │          │
  │  ┌──────┐ ┌────────┐  │  patches │                        ▼          │
  │  │ bars │ │ stacked│  │ ◀─────── │ remark ── :::chart ── js body     │
  │  └──────┘ └────────┘  │          │                        │          │
  └───────────────────────┘          │             subscribe(gql, plot)  │
                                     │                        │          │
                                     └────────────────────────┼──────────┘
                                                              ▼
                                                   system graph (yeetd)
                                          procs · cpu · memory · network · …
CPU as a share of every core, one sample a second.

:::chart[cpu]{min=0 max=100 unit=%}
```js
let last = null;
subscribe(`subscription { kernel_stats(interval_ms: 1000) { total {
  user_ms nice_ms system_ms idle_ms iowait_ms irq_ms softirq_ms steal_ms } } }`, (d) => {
  const t = d.kernel_stats.total;
  const busy = t.user_ms + t.nice_ms + t.system_ms + t.irq_ms + t.softirq_ms + t.steal_ms;
  const all = busy + t.idle_ms + t.iowait_ms;
  if (last) plot(100 * (busy - last.busy) / (all - last.all));
  last = { busy, all };
});
```
::
The reply streams into the panel as it is written. The moment a block's
closing :: lands, its body is compiled and run in the isolate — while
the model may still be writing the next one — with a small scope:
subscribe(gql, cb)—yeet.graph.subscribe, torn down with the chart. Every field of the system graph has a subscription form, andinterval_mssets the rate, so nothing here polls.plot(value)— a number is a time series; an object of numbers is several series stacked on one axis; an array of{ label, value }is a ranking drawn as horizontal bars, replaced on every call.rate(key, counter)— per-second change of a cumulative counter such asrecv_bytes, which is how throughput is drawn.graph(gql)— a one-shot query, for finding a pid or a name first.state,onCleanup(fn),log(...).
Attributes on the block set the axis (min= max=), the unit (%, B,
B/s, or any suffix), the braille rows per graph (rows=), and an
id= that keeps a chart's history across a rewrite. A body that
returns a value instead of subscribing is polled on live= ms.
kind= says how the data is drawn, and the prompt walks the model
through choosing it before it writes: a reading with a ceiling is a
gauge, parts of a whole a pie now or stacked over time, a ranking
bars, one reading per thing over time a heat map, a comparison an
overlay, readings of different magnitudes a split, two properties
of many things a scatter, and one reading over time an area or
line. The drawing is the framework's <chart> node, a Canvas that
takes the data as JSON and paints it in the theme's colours.
Charts tile a single grid: one column, then two from the second chart,
three from the fifth and four from the tenth, or pinned with the ⊞
button, and never more than the screen has room for. The panel widens
to hold them and scrolls within what the screen leaves. Under each
chart sits the model's sentence; × on a heading removes its question.
The model does not guess field names. At start the isolate introspects
the system graph and renders it as compact SDL — types, arguments,
descriptions clipped to a line, and the ! marks that say which fields
can be null — and that schema rides in every prompt, with the rule that
a nullable step is guarded. graph_schema and graph_query are its
two tools for looking closer. When a block still fails (a bad selection, a field that is
null only sometimes), the error goes back to the model and the
rewritten block is substituted in place, bounded at two repairs per
question. src on any chart shows the code that is running, because
the code was written by a model and is running on your host.
The bar item shows the newest chart's last eight samples and its latest value, so a chart keeps reporting after the panel is shut.
Building from source
The installable plugin is committed at the repository root — manifest.json,
BarWidget.qml, Panel.qml, app.js and the vendored yeetkit/ runtime — so
a clone is ready to load with no build step. The source of that output is
under app/:
app/page.jsx       the panel, the bar item, and the wiring between them
app/directive.js   the :::chart parser — a streaming reply leaves the last block open
app/cells.js       a running block: compile, scope, plot, teardown
app/draw.js        the bar item's braille sparkline, axes and number formatting
app/agent.js       the turn loop over yeet:ai, tools and repairs included
app/tools.js       graph_schema and graph_query
app/prompt.js      what the model is told
app/schema.js      the system graph introspected into the SDL the prompt carries
Rebuilding needs nothing outside this repository. The framework it is built
with, yeetkit-omarchy, is
committed as a packed tarball under vendor/, and package.json depends on
that file:
npm install
npm test         # the parser, the drawing, the cell runtime and the agent loop, under Node
npm run dist     # build into plugin/, then sync it to the root
npm run check    # drive the built plugin over a real portal
scripts/ask.js asks one question from a terminal with no shell in the
loop — the same agent, prompt, tools and chart runtime the panel uses —
then runs every block the reply carries for a few seconds and prints
what it plotted, or the error the panel would have sent back for repair:
yeet run scripts/ask.js "network throughput"
npm test covers everything that does not need a host: the directive
parser against streamed and closed replies, the braille and bar drawing,
a cell fed by a scripted graph (plots, rates, failures, timeouts,
teardown) and the agent loop against a scripted stream. npm run check
needs yeet and its daemon.
The three example bubbles are drawn from a bank of thirty-two questions spanning every kind, verified to come back as a chart that draws; they move on every ten seconds and on each opening of the panel, and Enter on the empty input asks the one in the placeholder.
Logged out, the panel says so and shows the login itself: the shell
runs yeet login, and the one-time URL it prints appears with a copy
button and one that opens it in the browser. When the login completes
the input comes back. Charts already drawn keep running throughout,
since the graph needs no login.
A chart that fails says so under its header in the panel, in the theme's
urgent colour. The isolate runs under script, which folds its stderr
into the wire, so its console output never reaches the shell log; to
see a failure in a terminal, ask the same question through
scripts/ask.js.
npm run dev builds straight into ~/.config/omarchy/plugins/cx.yeet.yeet-ai
and rebuilds on change. The shell reloads app.js on its own, but
picking up a change to the QML entry files needs omarchy restart shell.
Licence
Apache-2.0. See LICENSE.
Similar repos


Languages
JavaScript
53.1%
QML
46.9%
Ask a question, get a live dashboard of your system in seconds. An Omarchy bar plugin built with yeet.
See the codeSee what people are saying
README
yeet AI: Ask a question, generate a live realtime dashboard of your system in seconds.
Ask for a chart of this host and get one, live, in the Omarchy bar. The model does not describe the reading; it writes the instrument that takes it, and the panel draws what arrives.
Click the yeet icon; a panel drops down with one input and three suggestions. Ask — show me the whole system in six charts, how busy is each cpu core?, which processes use the most memory? — and a subscription over the system graph starts in a yeet isolate on the machine, with a sentence on which chart was chosen and why. Twelve kinds, from gauges and heat maps to rankings and scatters, in a grid that grows with every question.
Every colour is the theme's. Series take the accent and hues turned from it — greys on a monochrome theme — so the same dashboard belongs to whatever is running, and follows a theme change on the spot:
Requirements
- yeet —
yeetonPATHwithyeetdrunning, andyeet logincompleted. Charts need the daemon; asking needs the login, since the model is reached through the platform'syeet:ai. scriptfrom util-linux, which every Arch install has
The plugin runs one isolate — yeet run app.js under script, so it has a
terminal — and talks to it over that process's stdin and stdout. No port is
opened. Charts live in that isolate, which stops a few seconds after the
last bar widget goes away, so a shell restart clears the panel.
Install
Install yeet and log this host in, then add the plugin:
curl -fsSL https://yeet.cx | sh
yeet login
omarchy plugin add https://github.com/yeet-src/omarchy-yeet-ai --enable
Other ways to install yeet are in the manual installation guide.
The model is chosen from a pull-down in the panel — claude-opus-5 by
default — from the list in MODELS at the top of app/page.jsx. The
choice lives as long as the isolate does.
Remove
omarchy plugin remove cx.yeet.yeet-ai
How a question becomes a chart
Twelve kinds: area, line, overlay, stacked, split, heat
and sparks over readings in time; gauge, stat and meters for
readings against a scale; bars and pie for a ranking or the parts
of a whole; scatter for two properties of many things. A new sample
slides in from the right, a changed bar or sector eases to its new
size, and the head of a live line pulses. Hover anything for its value.
This began as a fork of proctop
with the fixed charts taken out and the model put in.
Every reading comes from yeet's
system graph,
a typed GraphQL view of the host — processes, cpu, memory, network,
sockets, containers, sensors — where every field can be subscribed to
at an interval, so nothing here polls. The model answers in markdown,
and the part of the answer that is an instrument rather than a sentence
travels as a :::chart container directive. A modified remark
pipeline in the isolate parses the reply as it streams, lifts each
block's JavaScript out, and executes it in the yeet engine's V8
isolate on the host, where yeet.graph.subscribe
is in scope:
  Omarchy bar                       yeet isolate (V8, on the host)
  ┌───────────────────────┐          ┌───────────────────────────────────┐
  │ "how busy is the cpu?"│ ───────▶ │ agent ── prompt + schema ──▶ model│
  │                       │          │            ▲            │         │
  │  ┌──────┐ ┌────────┐  │          │   tools    │     markdown reply    │
  │  │ heat │ │ gauge  │  │          │  graph_schema        streams in   │
  │  └──────┘ └────────┘  │          │  graph_query           │          │
  │  ┌──────┐ ┌────────┐  │  patches │                        ▼          │
  │  │ bars │ │ stacked│  │ ◀─────── │ remark ── :::chart ── js body     │
  │  └──────┘ └────────┘  │          │                        │          │
  └───────────────────────┘          │             subscribe(gql, plot)  │
                                     │                        │          │
                                     └────────────────────────┼──────────┘
                                                              ▼
                                                   system graph (yeetd)
                                          procs · cpu · memory · network · …
CPU as a share of every core, one sample a second.

:::chart[cpu]{min=0 max=100 unit=%}
```js
let last = null;
subscribe(`subscription { kernel_stats(interval_ms: 1000) { total {
  user_ms nice_ms system_ms idle_ms iowait_ms irq_ms softirq_ms steal_ms } } }`, (d) => {
  const t = d.kernel_stats.total;
  const busy = t.user_ms + t.nice_ms + t.system_ms + t.irq_ms + t.softirq_ms + t.steal_ms;
  const all = busy + t.idle_ms + t.iowait_ms;
  if (last) plot(100 * (busy - last.busy) / (all - last.all));
  last = { busy, all };
});
```
::
The reply streams into the panel as it is written. The moment a block's
closing :: lands, its body is compiled and run in the isolate — while
the model may still be writing the next one — with a small scope:
subscribe(gql, cb)—yeet.graph.subscribe, torn down with the chart. Every field of the system graph has a subscription form, andinterval_mssets the rate, so nothing here polls.plot(value)— a number is a time series; an object of numbers is several series stacked on one axis; an array of{ label, value }is a ranking drawn as horizontal bars, replaced on every call.rate(key, counter)— per-second change of a cumulative counter such asrecv_bytes, which is how throughput is drawn.graph(gql)— a one-shot query, for finding a pid or a name first.state,onCleanup(fn),log(...).
Attributes on the block set the axis (min= max=), the unit (%, B,
B/s, or any suffix), the braille rows per graph (rows=), and an
id= that keeps a chart's history across a rewrite. A body that
returns a value instead of subscribing is polled on live= ms.
kind= says how the data is drawn, and the prompt walks the model
through choosing it before it writes: a reading with a ceiling is a
gauge, parts of a whole a pie now or stacked over time, a ranking
bars, one reading per thing over time a heat map, a comparison an
overlay, readings of different magnitudes a split, two properties
of many things a scatter, and one reading over time an area or
line. The drawing is the framework's <chart> node, a Canvas that
takes the data as JSON and paints it in the theme's colours.
Charts tile a single grid: one column, then two from the second chart,
three from the fifth and four from the tenth, or pinned with the ⊞
button, and never more than the screen has room for. The panel widens
to hold them and scrolls within what the screen leaves. Under each
chart sits the model's sentence; × on a heading removes its question.
The model does not guess field names. At start the isolate introspects
the system graph and renders it as compact SDL — types, arguments,
descriptions clipped to a line, and the ! marks that say which fields
can be null — and that schema rides in every prompt, with the rule that
a nullable step is guarded. graph_schema and graph_query are its
two tools for looking closer. When a block still fails (a bad selection, a field that is
null only sometimes), the error goes back to the model and the
rewritten block is substituted in place, bounded at two repairs per
question. src on any chart shows the code that is running, because
the code was written by a model and is running on your host.
The bar item shows the newest chart's last eight samples and its latest value, so a chart keeps reporting after the panel is shut.
Building from source
The installable plugin is committed at the repository root — manifest.json,
BarWidget.qml, Panel.qml, app.js and the vendored yeetkit/ runtime — so
a clone is ready to load with no build step. The source of that output is
under app/:
app/page.jsx       the panel, the bar item, and the wiring between them
app/directive.js   the :::chart parser — a streaming reply leaves the last block open
app/cells.js       a running block: compile, scope, plot, teardown
app/draw.js        the bar item's braille sparkline, axes and number formatting
app/agent.js       the turn loop over yeet:ai, tools and repairs included
app/tools.js       graph_schema and graph_query
app/prompt.js      what the model is told
app/schema.js      the system graph introspected into the SDL the prompt carries
Rebuilding needs nothing outside this repository. The framework it is built
with, yeetkit-omarchy, is
committed as a packed tarball under vendor/, and package.json depends on
that file:
npm install
npm test         # the parser, the drawing, the cell runtime and the agent loop, under Node
npm run dist     # build into plugin/, then sync it to the root
npm run check    # drive the built plugin over a real portal
scripts/ask.js asks one question from a terminal with no shell in the
loop — the same agent, prompt, tools and chart runtime the panel uses —
then runs every block the reply carries for a few seconds and prints
what it plotted, or the error the panel would have sent back for repair:
yeet run scripts/ask.js "network throughput"
npm test covers everything that does not need a host: the directive
parser against streamed and closed replies, the braille and bar drawing,
a cell fed by a scripted graph (plots, rates, failures, timeouts,
teardown) and the agent loop against a scripted stream. npm run check
needs yeet and its daemon.
The three example bubbles are drawn from a bank of thirty-two questions spanning every kind, verified to come back as a chart that draws; they move on every ten seconds and on each opening of the panel, and Enter on the empty input asks the one in the placeholder.
Logged out, the panel says so and shows the login itself: the shell
runs yeet login, and the one-time URL it prints appears with a copy
button and one that opens it in the browser. When the login completes
the input comes back. Charts already drawn keep running throughout,
since the graph needs no login.
A chart that fails says so under its header in the panel, in the theme's
urgent colour. The isolate runs under script, which folds its stderr
into the wire, so its console output never reaches the shell log; to
see a failure in a terminal, ask the same question through
scripts/ask.js.
npm run dev builds straight into ~/.config/omarchy/plugins/cx.yeet.yeet-ai
and rebuilds on change. The shell reloads app.js on its own, but
picking up a change to the QML entry files needs omarchy restart shell.
Licence
Apache-2.0. See LICENSE.
Similar repos
Languages
JavaScript
53.1%
QML
46.9%