

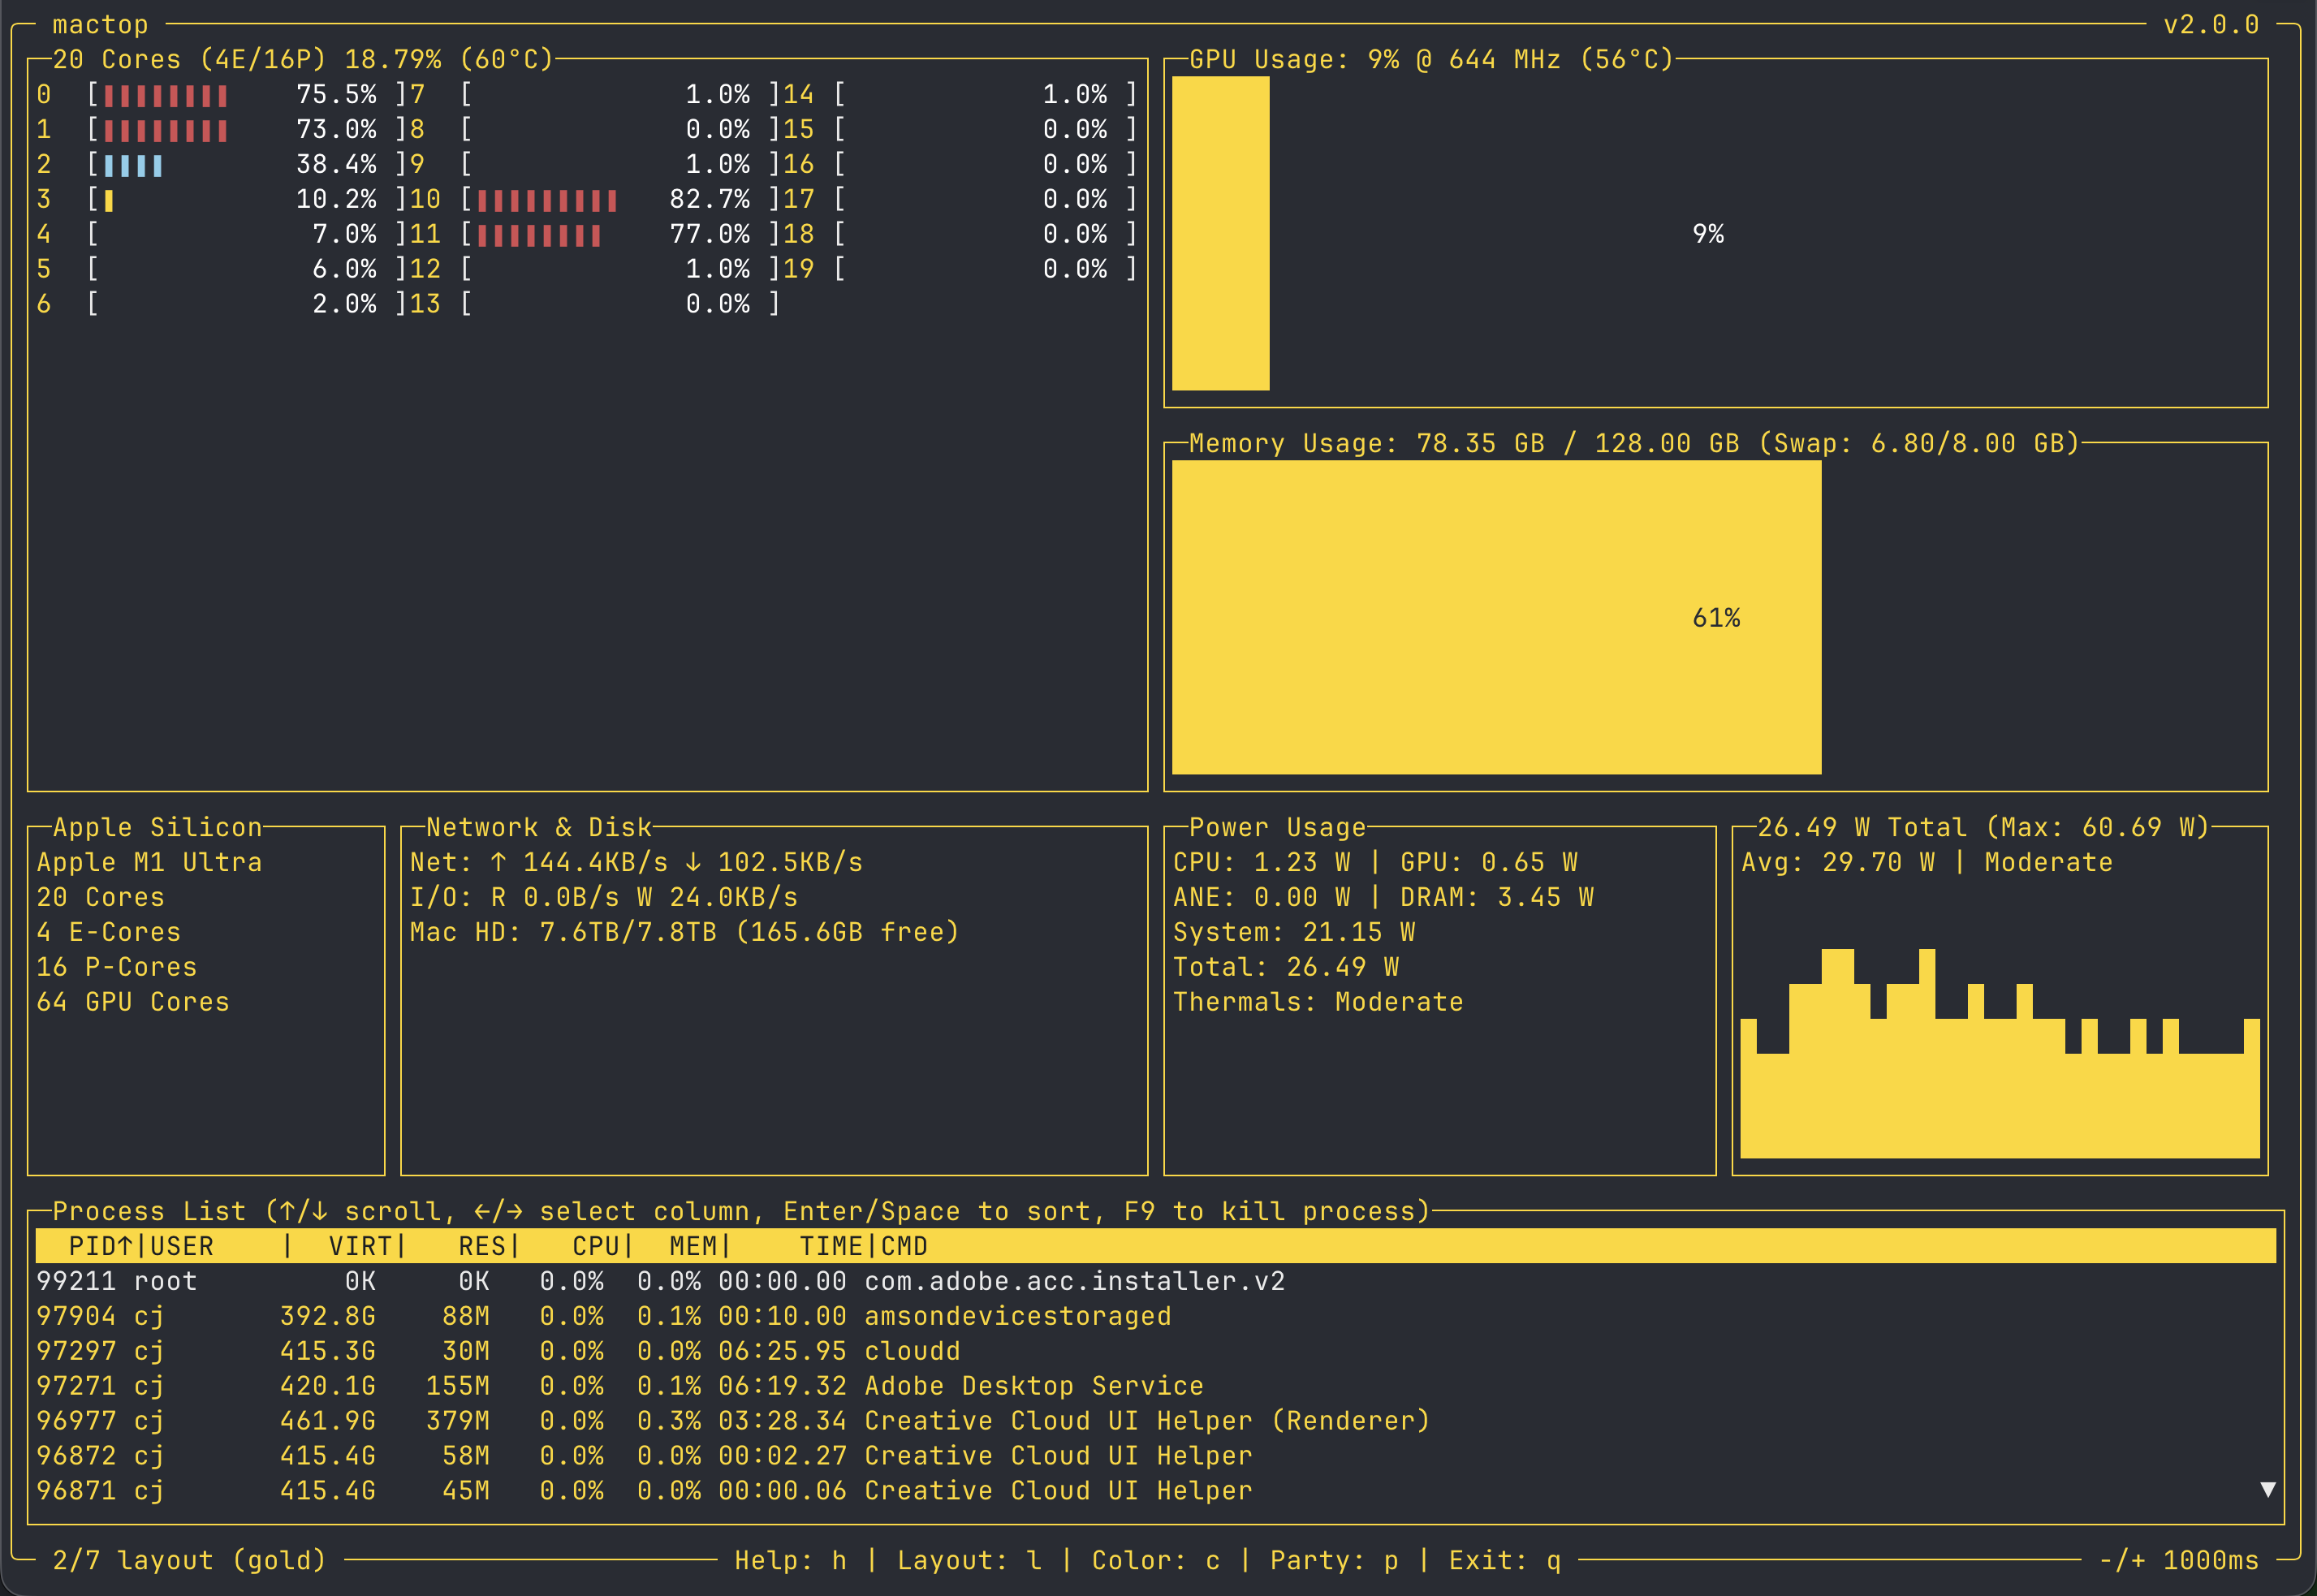
mactop is a terminal-based monitoring tool "top" designed to display real-time metrics for Apple Silicon chips written by Carsen Klock. It provides a simple and efficient way to monitor CPU and GPU usage, E-Cores and P-Cores, power consumption, GPU frequency, temperatures, and other system metrics directly from your terminal
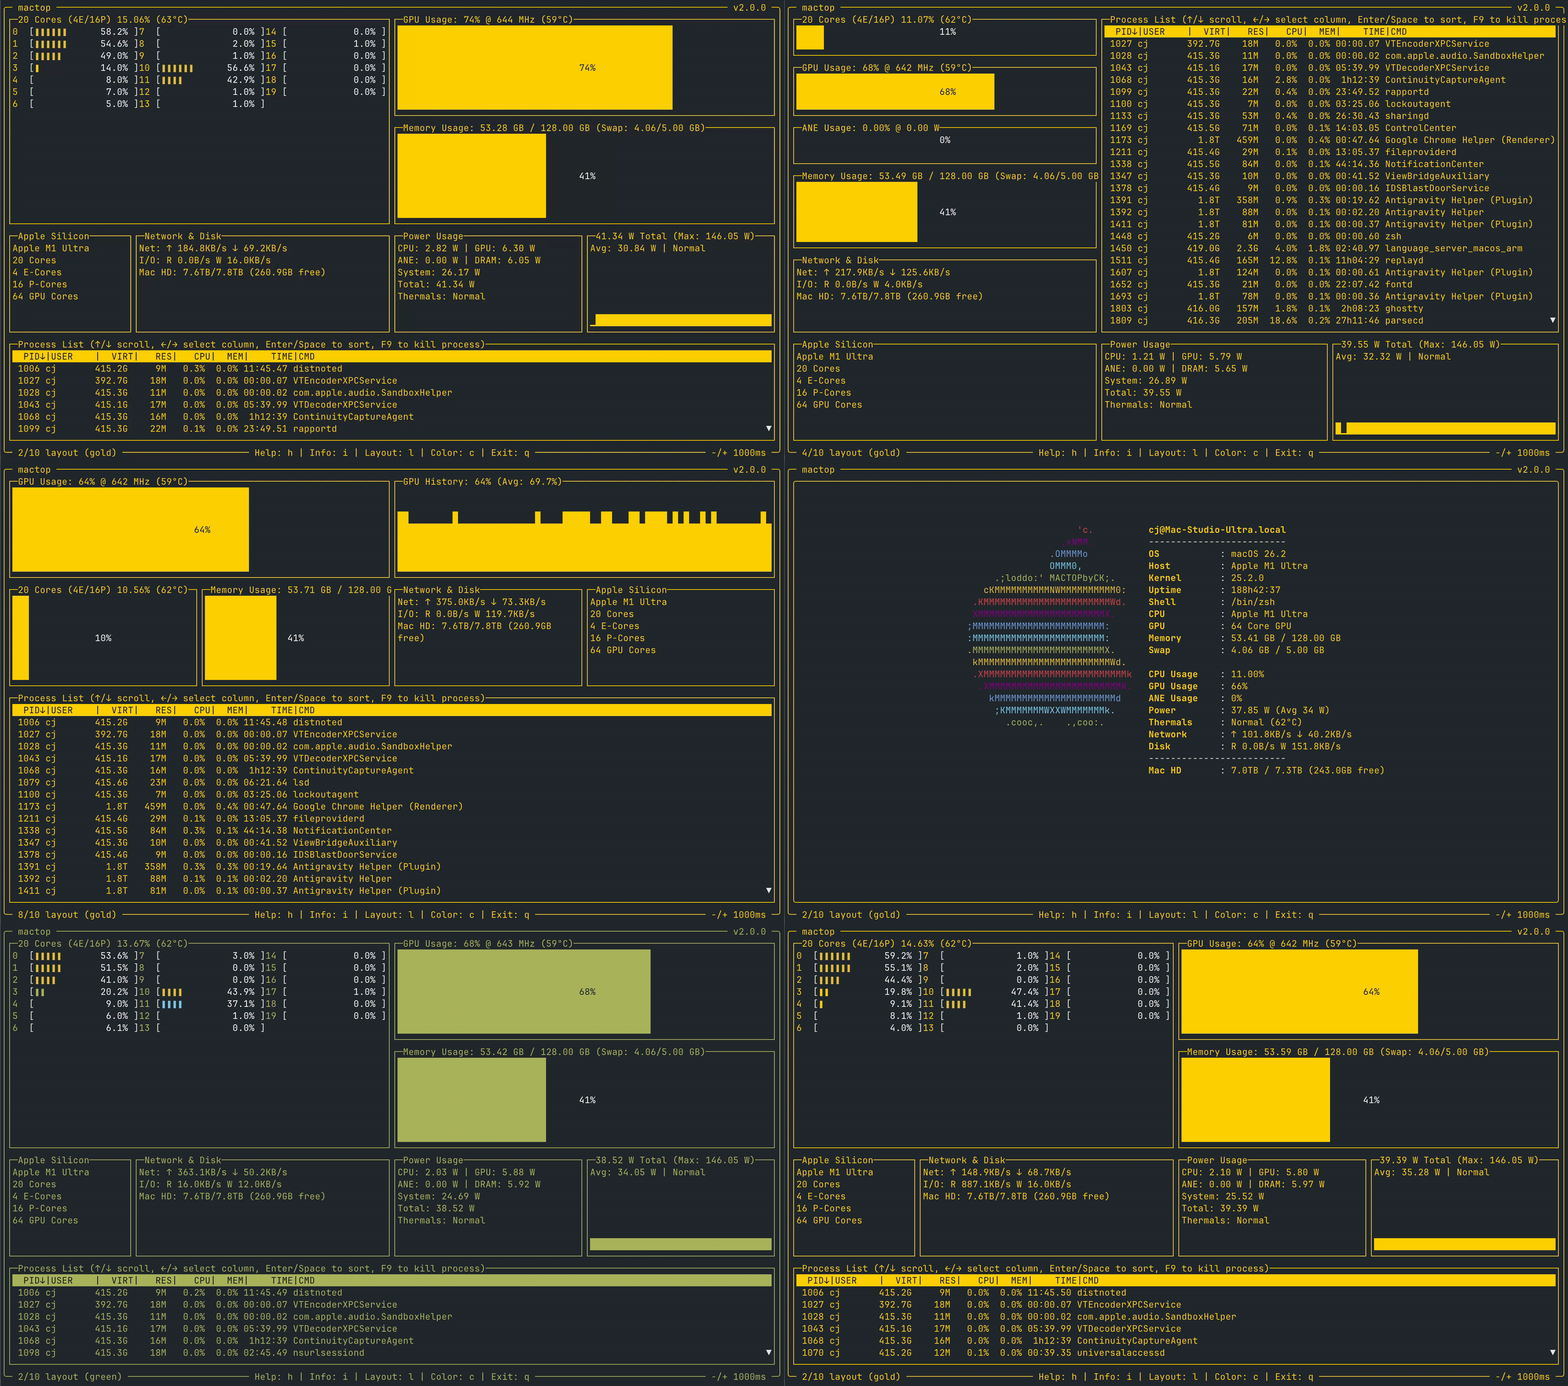
--fan-control flag (writes to SMC), plus headless one-shot commands (--fan-set, --fan-auto, --fan-status) for scripts, cron, and SSHl to cycle layouts) — includes a GPU + Memory focused layout with a DRAM read/write bandwidth history chart, a memory-pressure layout, plus a ports layout for listening TCP/UDP socketskern.memorystatus_vm_pressure_level, with approximate history for Activity Monitor-style green/yellow/red signal
history_soc layout (a to jump to it): four large history StepCharts showing CPU, GPU, ANE, and DRAM + ANE Bandwidth (Read/Write) side-by-side, with a compact process list at the bottom. Ideal for observing sustained load, on-device Neural Engine inference, and memory bandwidth behavior over time.c to cycle colors)b to cycle colors)- or = to speed up, + to slow down)/)g top, G bottom, j/k scroll)--headless)--pretty) or set collection count (--count <n>)--format <format>)f)p to toggle)-p <port> or --prometheus <port>)
--menubar) with sparkline charts, CPU/GPU/Memory gauges, power metrics, DRAM bandwidth, fan RPM, and full system stats--unit-network, --unit-disk, --unit-temp)--lang to override)You can install mactop via Homebrew! https://brew.sh
brew install mactop
mactop
brew update
brew upgrade mactop
To install mactop, follow these steps:
Ensure you have Go installed on your machine. If not, you can install it by following the instructions here: Go Installation Guide.
Clone the repository:
git clone https://github.com/metaspartan/mactop.git
cd mactop
Build the application:
go build
Run the application:
./mactop
After installation, you can start mactop by simply running:
./mactop
Example with flags:
mactop --interval 1000 --foreground green --lang ja
Built-in Themes:
# Dracula
mactop --foreground dracula --bg dracula-base

# Catppuccin
mactop --foreground mocha --bg mocha-base
Custom Hex Colors:
# Use Dracula PRO theme colors
mactop --foreground "#9580FF" --bg "#22212C"
Headless Mode (JSON Output):
# Run once and exit (great for scripts)
mactop --headless --count 1

# Run continuously with pretty printing
mactop --headless --pretty

# Run with different output formats (json, yaml, xml, toon)
mactop --headless --format toon
--headless: Run in headless mode (no TUI, output to stdout).--format: Output format for headless mode (json, yaml, xml, toon). Default is json.--count: Number of samples to collect in headless mode (0 = infinite).--pretty: Pretty print JSON output in headless mode.--interval or -i: Set the update interval in milliseconds. Default is 1000.--foreground: Set the UI foreground color. Accepts named colors (green, red, blue, etc.), full palette themes (dracula, mocha, macchiato, frappe) or hex colors (#9580FF).--bg or --background: Set the UI background color. Accepts named colors (dracula-base, mocha-base, etc.) or hex colors (#22212C).--prometheus or -p: Set and enable the local Prometheus metrics server on the given port. Default is disabled. (e.g. -p 2112 to enable Prometheus metrics on port 2112)--unit-network: Network unit: auto, byte, kb, mb, gb (default: auto)--unit-disk: Disk unit: auto, byte, kb, mb, gb (default: auto)--unit-temp: Temperature unit: celsius, fahrenheit (default: celsius)--lang: Language override (e.g., en, es, ja, zh). Auto-detects system language if not set. Priority: CLI flag > MACTOP_LANG env var > config.json > system language.--fan-control: Enable interactive fan speed control (⚠️ writes to SMC — use with caution). Requires root: writing SMC fan keys is privileged, so you must run sudo mactop --fan-control. Without root every fan write is silently rejected (kIOReturnNotPrivileged) and the controls appear to do nothing.--fan-set <value>: Headless one-shot fan control (⚠️ writes to SMC, requires sudo): pin the fans to a target and exit. Accepts an absolute RPM (3000), a percent of each fan's min–max range (60%), min, max, or auto. See Headless Fan Control.--fan-id <n>: Apply --fan-set to a single fan ID instead of all fans.--fan-auto: Restore all fans to automatic control and exit (requires sudo).--fan-status: Print current fan state as JSON to stdout and exit (no root required).--menubar: Run as a macOS menu bar status item alongside the TUI.--overlay: Run as a floating overlay HUD window with FPS metrics. (Requires Screen Recording permission — see Permissions below)--dump-fps: Diagnostic tool that dumps display info, screen recording permission status, and tests CGDisplayStream at multiple output sizes. Useful for troubleshooting FPS display issues.--dump-temps: Diagnostic: dump all raw SMC temperature keys and exit.--dump-debug: Diagnostic: dump IOReport/HID/SMC/NVMe debug info and exit.--version or -v: Print the version of mactop.--help or -h: Show a help message about these flags and how to run mactop.mactop uses native Apple APIs and does not require sudo for core functionality (CPU, GPU, power, memory, temperatures, fans).
The --overlay mode uses CGDisplayStream to track display frame rates (FPS and frame interval). On macOS 15 (Sequoia) and later, this requires Screen Recording permission for your terminal app:
Without this permission, the overlay will still work but FPS and frame interval metrics will show 0 / -.
Tip: Run
mactop --dump-fpsto verify screen recording access and test CGDisplayStream on your hardware. This is useful for troubleshooting if FPS metrics still aren't appearing.
The overlay HUD (--overlay) supports customization via ~/.mactop/config.json. You can control which metrics appear in collapsed mode, their order in expanded mode, and the overlay opacity.
Choose which metrics appear when the overlay is collapsed (default: FPS, Frame, CPU, GPU, Memory):
{
  "overlay": {
    "collapsed_sections": ["fps", "cpu", "gpu", "memory"]
  }
}
Reorder sections in expanded mode. Sections appear in the order listed:
{
  "overlay": {
    "expanded_order": [
      "fps", "frame", "cpu", "gpu", "memory",
      "power", "temps", "thermal", "fans",
      "bandwidth", "gpu_freq", "ane", "network"
    ]
  }
}
| Section | Description |
|---|---|
fps | Display FPS counter with sparkline |
frame | Frame interval (ms) with sparkline |
cpu | CPU usage bar with sparkline |
gpu | GPU usage bar with sparkline |
ane | ANE (Neural Engine) usage bar |
memory | Memory usage bar |
swap | Swap usage (only shown when swap is active) |
power | Power breakdown (Package + CPU/GPU/ANE/DRAM) |
bandwidth | DRAM bandwidth (GB/s) |
gpu_freq | GPU frequency and TFLOPs |
temps | CPU and GPU temperatures |
thermal | Thermal state |
fans | Fan RPM (only shown when fans present) |
network | Network throughput |
{
  "overlay": {
    "opacity": 0.75
  }
}
Create theme.json in mactop's config directory to customize colors:
XDG_CONFIG_HOME is set to an absolute path: $XDG_CONFIG_HOME/mactop/theme.json~/.mactop/theme.json{
"foreground": "#9580FF",
"background": "#22212C"
}
Individual component colors that override the foreground:
cpu: CPU gauge, CPU cores widget, CPU history chartgpu: GPU gauge, GPU sparkline, GPU history chartmemory: Memory gauge, Memory history chartane: ANE (Apple Neural Engine) gaugebandwidth: DRAM Bandwidth history chart (falls back to memory color)network: Network box, Network sparklinespower: Power box, Power sparkline, Power history chartthunderbolt: Thunderbolt/RDMA boxprocessList: Process list border and text colorprocessListDim: Non-current-user (root/system) process text color (default: grey)processListSelected: Selected row foreground text color (default: auto contrast)systemInfo: System info box color{
"foreground": "#B0BEC5",
"background": "#212121",
"cpu": "#FF5252",
"gpu": "#448AFF",
"memory": "#69F0AE",
"ane": "#E040FB",
"network": "#FFAB40",
"power": "#FF6E40",
"thunderbolt": "#E91E63",
"processList": "#FFEB3B",
"processListDim": "#555555",
"processListSelected": "#FFFFFF",
"systemInfo": "#00BCD4"
}
| Element | Hex |
|---|---|
| Background | #22212C |
| Foreground | #F8F8F2 |
| Purple | #9580FF |
| Cyan | #80FFEA |
| Green | #8AFF80 |
| Pink | #FF80BF |
| Orange | #FFCA80 |
| Red | #FF9580 |
Priority order: CLI flags > theme.json > saved config.
mactop supports XDG directory variables while preserving the original path layout when those variables are unset.
| File | XDG path when set | Legacy fallback |
|---|---|---|
| Config | $XDG_CONFIG_HOME/mactop/config.json | ~/.mactop/config.json |
| Theme | $XDG_CONFIG_HOME/mactop/theme.json | ~/.mactop/theme.json |
| Log | $XDG_STATE_HOME/mactop/mactop.log | ~/.mactop/mactop.log |
Relative XDG paths are ignored; XDG base directories must be absolute paths.
Use the following keys to interact with the application while its running:
q: Quit the application.r: Refresh the UI data manually.c: Cycle through the color themes.b: Cycle through the background colors.p: Party Mode (Randomly cycles through colors)i: Toggle Info layout (displays system info)F (Shift+f): Toggle Fan & Thermals layout (fan monitoring + all temperature sensors)l: Cycle through the available layouts.o: Jump to the ports layout (listening TCP/UDP ports; press again to go back).m: Jump to the memory pressure layout (press again to go back).e: On the ports layout, toggle external-only filter.+ or =: Increase update interval (slower updates).-: Decrease update interval (faster updates).F9: Kill the currently selected process (pauses updates while selecting).Arrow Keys or h/j/k/l: Navigate the process list and select columns.g / G: Jump to the top or bottom of the process list./: Search/Filter the process list by name (Esc to clear).Enter or Space: Sort by the selected column.h or ?: Toggle the help menu.--fan-control flag + sudo, only active in Fan layout)Fan control writes to the SMC, which is privileged — run with
sudo mactop --fan-control. Without root the keys below have no effect (mactop will show a warning in the Fan panel). Note: on recent macOS the system thermal governor may also override manual fan targets.
+ or =: Increase fan speed (+100 RPM)-: Decrease fan speed (-100 RPM)a: Toggle auto/manual fan mode0: Set all fans to minimum speed9: Set all fans to maximum speedR (Shift+r): Reset all fans to automatic controlFan control also works without the TUI — from scripts, cron jobs, or over SSH:
# Read fan state (no root needed) — JSON on stdout
mactop --fan-status

# Pin all fans to 3000 RPM (or a percent of each fan's min–max range, or min/max)
sudo mactop --fan-set 3000
sudo mactop --fan-set 60%
sudo mactop --fan-set max

# Pin only fan 1
sudo mactop --fan-set 2500 --fan-id 1

# Restore automatic fan control
sudo mactop --fan-auto        # (equivalent: sudo mactop --fan-set auto)
Each command performs its SMC writes, prints the resulting fan state as JSON to stdout (human-readable messages go to stderr; --pretty is honored), and exits — exit code 0 on success, 1 on failure. After writing, mactop reads the fan state back and fails with a warning if the OS silently rejected the write.
⚠️ Unlike the interactive TUI,
--fan-setintentionally leaves the fans pinned in manual mode after mactop exits — that's what makes it usable headlessly. Nothing will restore automatic control until you runsudo mactop --fan-auto(or reboot). Pinning fans below their automatic speed under load can cause thermal throttling; the macOS thermal governor may also override manual targets on recent macOS versions.
[{
  "timestamp": "2025-12-22T18:16:57-07:00",
  "soc_metrics": {
    "cpu_power": 2.1959999999999997,
    "gpu_power": 5.38552801,
    "ane_power": 0,
    "dram_power": 5.702,
    "gpu_sram_power": 0.158,
    "system_power": 37.47166092432617,
    "total_power": 50.91318893432617,
    "gpu_freq_mhz": 643,
    "soc_temp": 62.562572,
    "cpu_temp": 62.562572,
    "gpu_temp": 58.38886
  },
  "memory": {
    "total": 137438953472,
    "used": 74062512128,
    "available": 63376441344,
    "swap_total": 5368709120,
    "swap_used": 4094689280
  },
  "net_disk": {
    "out_packets_per_sec": 589.4371024829012,
    "out_bytes_per_sec": 196028.18012655922,
    "in_packets_per_sec": 593.3256375185223,
    "in_bytes_per_sec": 74461.55739710879,
    "read_ops_per_sec": 0.32404458630175986,
    "write_ops_per_sec": 40.18152870141822,
    "read_kbytes_per_sec": 1.2961783452070395,
    "write_kbytes_per_sec": 308.4904461592754
  },
  "cpu_usage": 15.140564910346725,
  "gpu_usage": 53.51970510465884,
  "core_usages": [
    42.244224422442244,
    37.17105263157895,
    55.26315789473685,
    37.704918032786885,
    27.21311475409836,
    21.241830065359476,
    14.563106796116504,
    6.148867313915858,
    4.193548387096775,
    1.9417475728155338,
    30.718954248366014,
    20.846905537459286,
    1.9417475728155338,
    1.2944983818770228,
    0.3236245954692557,
    0,
    0,
    0,
    0,
    0
  ],
  "system_info": {
    "name": "Apple M1 Ultra",
    "core_count": 20,
    "e_core_count": 4,
    "p_core_count": 16,
    "gpu_core_count": 64
  },
  "thermal_state": "Normal",
  "thunderbolt_info": {
    "buses": [
      {
        "name": "TB4 Bus 5",
        "status": "Active (USB)",
        "icon": "⏺",
        "speed": "Up to 40 Gb/s",
        "domain_uuid": "9FDBA52F-DF7C-425E-B67B-FB80F9E1DCD6",
        "switch_uid": "0x05AC38BE5E390FE5",
        "receptacle_id": "6",
        "devices": [
          {
            "name": "ASM236X NVME",
            "mode": "USB",
            "info_string": "USB, SSD"
          }
        ],
        "network_stats": {
          "interface_name": "en7",
          "bytes_in": 0,
          "bytes_out": 0,
          "bytes_in_per_sec": 0,
          "bytes_out_per_sec": 0,
          "packets_in": 0,
          "packets_out": 0
        }
      },
      {
        "name": "TB4 Bus 4",
        "status": "Inactive",
        "icon": "○",
        "speed": "Up to 40 Gb/s",
        "domain_uuid": "5DD6DE43-051D-4B32-B044-23E57AA0EEC8",
        "switch_uid": "0x05AC38BE5E390FE4",
        "receptacle_id": "5",
        "network_stats": {
          "interface_name": "en6",
          "bytes_in": 0,
          "bytes_out": 0,
          "bytes_in_per_sec": 0,
          "bytes_out_per_sec": 0,
          "packets_in": 0,
          "packets_out": 0
        }
      },
      {
        "name": "TB4 @ TB3 Bus 3",
        "status": "Active",
        "icon": "ϟ",
        "speed": "20 Gb/s",
        "domain_uuid": "AF4CE493-9005-4E9D-8B8B-0198D27BABA3",
        "switch_uid": "0x05AC38BE5E390FE3",
        "receptacle_id": "4",
        "devices": [
          {
            "name": "Studio Display",
            "vendor": "Apple Inc.",
            "vendor_id": "0x0001",
            "mode": "TB3",
            "switch_uid": "0x0001AFBD0C588A00",
            "device_id": "0x801F",
            "info_string": "Apple Inc., TB3"
          }
        ],
        "network_stats": {
          "interface_name": "en5",
          "bytes_in": 0,
          "bytes_out": 0,
          "bytes_in_per_sec": 0,
          "bytes_out_per_sec": 0,
          "packets_in": 0,
          "packets_out": 0
        }
      },
      {
        "name": "TB4 Bus 2",
        "status": "Inactive",
        "icon": "○",
        "speed": "Up to 40 Gb/s",
        "domain_uuid": "D589EEFE-98CF-42EC-A729-6C3E523AA321",
        "switch_uid": "0x05AC38BE5E390FE2",
        "receptacle_id": "3",
        "network_stats": {
          "interface_name": "en4",
          "bytes_in": 0,
          "bytes_out": 0,
          "bytes_in_per_sec": 0,
          "bytes_out_per_sec": 0,
          "packets_in": 0,
          "packets_out": 0
        }
      },
      {
        "name": "TB4 Bus 1",
        "status": "Inactive",
        "icon": "○",
        "speed": "Up to 40 Gb/s",
        "domain_uuid": "6DAC6FCD-E102-4CCD-9D01-A75540E660CA",
        "switch_uid": "0x05AC38BE5E390FE1",
        "receptacle_id": "2",
        "network_stats": {
          "interface_name": "en3",
          "bytes_in": 0,
          "bytes_out": 0,
          "bytes_in_per_sec": 0,
          "bytes_out_per_sec": 0,
          "packets_in": 0,
          "packets_out": 0
        }
      },
      {
        "name": "TB4 Bus 0",
        "status": "Inactive",
        "icon": "○",
        "speed": "Up to 40 Gb/s",
        "domain_uuid": "63A80A32-E70C-4F22-84BE-EDE632A5BA3E",
        "switch_uid": "0x05AC38BE5E390FE0",
        "receptacle_id": "1",
        "network_stats": {
          "interface_name": "en2",
          "bytes_in": 0,
          "bytes_out": 0,
          "bytes_in_per_sec": 0,
          "bytes_out_per_sec": 0,
          "packets_in": 0,
          "packets_out": 0
        }
      }
    ]
  },
  "tb_net_total_bytes_in_per_sec": 0,
  "tb_net_total_bytes_out_per_sec": 0,
  "rdma_status": {
    "available": false,
    "status": "RDMA Disabled (use rdma_ctl enable in Recovery Mode)"
  },
  "cpu_temp": 62.562572,
  "gpu_temp": 58.38886
}
]
(If you have a confirmed working Apple Silicon chip that is not listed, please open an issue, so we may add it here!)
Contributions are what make the open-source community such an amazing place to learn, inspire, and create. Any contributions you make are greatly appreciated.
git checkout -b feature/AmazingFeature)git commit -m 'Add some AmazingFeature')git push origin feature/AmazingFeature)DCS BW / AMCC RD|WR|RD+WR histograms (M4 Pro/Max; AMC Stats does not subscribe on those chips). DRAM power is also used for auto-calibrated bandwidth estimation on M5+ chipspmgr devicehost_processor_info): For CPU metrics (E-cores, P-cores, and S-cores on M5+) via CGODistributed under the MIT License. See LICENSE for more information.
Carsen Klock - @carsenklock
Project Link: https://github.com/metaspartan/mactop
This tool is not officially supported by Apple. It is provided as is, and may not work as expected. Use at your own risk.

(top 24 of 42)
2,241 followers · starred Dec 2025
1,422 followers · starred Apr 2026
26 followers · starred Mar 2026
706 followers · starred Jan 2026
mactop is a terminal-based monitoring tool "top" designed to display real-time metrics for Apple Silicon chips written by Carsen Klock. It provides a simple and efficient way to monitor CPU and GPU usage, E-Cores and P-Cores, power consumption, GPU frequency, temperatures, and other system metrics directly from your terminal
--fan-control flag (writes to SMC), plus headless one-shot commands (--fan-set, --fan-auto, --fan-status) for scripts, cron, and SSHl to cycle layouts) — includes a GPU + Memory focused layout with a DRAM read/write bandwidth history chart, a memory-pressure layout, plus a ports layout for listening TCP/UDP socketskern.memorystatus_vm_pressure_level, with approximate history for Activity Monitor-style green/yellow/red signal
history_soc layout (a to jump to it): four large history StepCharts showing CPU, GPU, ANE, and DRAM + ANE Bandwidth (Read/Write) side-by-side, with a compact process list at the bottom. Ideal for observing sustained load, on-device Neural Engine inference, and memory bandwidth behavior over time.c to cycle colors)b to cycle colors)- or = to speed up, + to slow down)/)g top, G bottom, j/k scroll)--headless)--pretty) or set collection count (--count <n>)--format <format>)f)p to toggle)-p <port> or --prometheus <port>)
--menubar) with sparkline charts, CPU/GPU/Memory gauges, power metrics, DRAM bandwidth, fan RPM, and full system stats--unit-network, --unit-disk, --unit-temp)--lang to override)You can install mactop via Homebrew! https://brew.sh
brew install mactop
mactop
brew update
brew upgrade mactop
To install mactop, follow these steps:
Ensure you have Go installed on your machine. If not, you can install it by following the instructions here: Go Installation Guide.
Clone the repository:
git clone https://github.com/metaspartan/mactop.git
cd mactop
Build the application:
go build
Run the application:
./mactop
After installation, you can start mactop by simply running:
./mactop
Example with flags:
mactop --interval 1000 --foreground green --lang ja
Built-in Themes:
# Dracula
mactop --foreground dracula --bg dracula-base

# Catppuccin
mactop --foreground mocha --bg mocha-base
Custom Hex Colors:
# Use Dracula PRO theme colors
mactop --foreground "#9580FF" --bg "#22212C"
Headless Mode (JSON Output):
# Run once and exit (great for scripts)
mactop --headless --count 1

# Run continuously with pretty printing
mactop --headless --pretty

# Run with different output formats (json, yaml, xml, toon)
mactop --headless --format toon
--headless: Run in headless mode (no TUI, output to stdout).--format: Output format for headless mode (json, yaml, xml, toon). Default is json.--count: Number of samples to collect in headless mode (0 = infinite).--pretty: Pretty print JSON output in headless mode.--interval or -i: Set the update interval in milliseconds. Default is 1000.--foreground: Set the UI foreground color. Accepts named colors (green, red, blue, etc.), full palette themes (dracula, mocha, macchiato, frappe) or hex colors (#9580FF).--bg or --background: Set the UI background color. Accepts named colors (dracula-base, mocha-base, etc.) or hex colors (#22212C).--prometheus or -p: Set and enable the local Prometheus metrics server on the given port. Default is disabled. (e.g. -p 2112 to enable Prometheus metrics on port 2112)--unit-network: Network unit: auto, byte, kb, mb, gb (default: auto)--unit-disk: Disk unit: auto, byte, kb, mb, gb (default: auto)--unit-temp: Temperature unit: celsius, fahrenheit (default: celsius)--lang: Language override (e.g., en, es, ja, zh). Auto-detects system language if not set. Priority: CLI flag > MACTOP_LANG env var > config.json > system language.--fan-control: Enable interactive fan speed control (⚠️ writes to SMC — use with caution). Requires root: writing SMC fan keys is privileged, so you must run sudo mactop --fan-control. Without root every fan write is silently rejected (kIOReturnNotPrivileged) and the controls appear to do nothing.--fan-set <value>: Headless one-shot fan control (⚠️ writes to SMC, requires sudo): pin the fans to a target and exit. Accepts an absolute RPM (3000), a percent of each fan's min–max range (60%), min, max, or auto. See Headless Fan Control.--fan-id <n>: Apply --fan-set to a single fan ID instead of all fans.--fan-auto: Restore all fans to automatic control and exit (requires sudo).--fan-status: Print current fan state as JSON to stdout and exit (no root required).--menubar: Run as a macOS menu bar status item alongside the TUI.--overlay: Run as a floating overlay HUD window with FPS metrics. (Requires Screen Recording permission — see Permissions below)--dump-fps: Diagnostic tool that dumps display info, screen recording permission status, and tests CGDisplayStream at multiple output sizes. Useful for troubleshooting FPS display issues.--dump-temps: Diagnostic: dump all raw SMC temperature keys and exit.--dump-debug: Diagnostic: dump IOReport/HID/SMC/NVMe debug info and exit.--version or -v: Print the version of mactop.--help or -h: Show a help message about these flags and how to run mactop.mactop uses native Apple APIs and does not require sudo for core functionality (CPU, GPU, power, memory, temperatures, fans).
The --overlay mode uses CGDisplayStream to track display frame rates (FPS and frame interval). On macOS 15 (Sequoia) and later, this requires Screen Recording permission for your terminal app:
Without this permission, the overlay will still work but FPS and frame interval metrics will show 0 / -.
Tip: Run
mactop --dump-fpsto verify screen recording access and test CGDisplayStream on your hardware. This is useful for troubleshooting if FPS metrics still aren't appearing.
The overlay HUD (--overlay) supports customization via ~/.mactop/config.json. You can control which metrics appear in collapsed mode, their order in expanded mode, and the overlay opacity.
Choose which metrics appear when the overlay is collapsed (default: FPS, Frame, CPU, GPU, Memory):
{
  "overlay": {
    "collapsed_sections": ["fps", "cpu", "gpu", "memory"]
  }
}
Reorder sections in expanded mode. Sections appear in the order listed:
{
  "overlay": {
    "expanded_order": [
      "fps", "frame", "cpu", "gpu", "memory",
      "power", "temps", "thermal", "fans",
      "bandwidth", "gpu_freq", "ane", "network"
    ]
  }
}
| Section | Description |
|---|---|
fps | Display FPS counter with sparkline |
frame | Frame interval (ms) with sparkline |
cpu | CPU usage bar with sparkline |
gpu | GPU usage bar with sparkline |
ane | ANE (Neural Engine) usage bar |
memory | Memory usage bar |
swap | Swap usage (only shown when swap is active) |
power | Power breakdown (Package + CPU/GPU/ANE/DRAM) |
bandwidth | DRAM bandwidth (GB/s) |
gpu_freq | GPU frequency and TFLOPs |
temps | CPU and GPU temperatures |
thermal | Thermal state |
fans | Fan RPM (only shown when fans present) |
network | Network throughput |
{
  "overlay": {
    "opacity": 0.75
  }
}
Create theme.json in mactop's config directory to customize colors:
XDG_CONFIG_HOME is set to an absolute path: $XDG_CONFIG_HOME/mactop/theme.json~/.mactop/theme.json{
"foreground": "#9580FF",
"background": "#22212C"
}
Individual component colors that override the foreground:
cpu: CPU gauge, CPU cores widget, CPU history chartgpu: GPU gauge, GPU sparkline, GPU history chartmemory: Memory gauge, Memory history chartane: ANE (Apple Neural Engine) gaugebandwidth: DRAM Bandwidth history chart (falls back to memory color)network: Network box, Network sparklinespower: Power box, Power sparkline, Power history chartthunderbolt: Thunderbolt/RDMA boxprocessList: Process list border and text colorprocessListDim: Non-current-user (root/system) process text color (default: grey)processListSelected: Selected row foreground text color (default: auto contrast)systemInfo: System info box color{
"foreground": "#B0BEC5",
"background": "#212121",
"cpu": "#FF5252",
"gpu": "#448AFF",
"memory": "#69F0AE",
"ane": "#E040FB",
"network": "#FFAB40",
"power": "#FF6E40",
"thunderbolt": "#E91E63",
"processList": "#FFEB3B",
"processListDim": "#555555",
"processListSelected": "#FFFFFF",
"systemInfo": "#00BCD4"
}
| Element | Hex |
|---|---|
| Background | #22212C |
| Foreground | #F8F8F2 |
| Purple | #9580FF |
| Cyan | #80FFEA |
| Green | #8AFF80 |
| Pink | #FF80BF |
| Orange | #FFCA80 |
| Red | #FF9580 |
Priority order: CLI flags > theme.json > saved config.
mactop supports XDG directory variables while preserving the original path layout when those variables are unset.
| File | XDG path when set | Legacy fallback |
|---|---|---|
| Config | $XDG_CONFIG_HOME/mactop/config.json | ~/.mactop/config.json |
| Theme | $XDG_CONFIG_HOME/mactop/theme.json | ~/.mactop/theme.json |
| Log | $XDG_STATE_HOME/mactop/mactop.log | ~/.mactop/mactop.log |
Relative XDG paths are ignored; XDG base directories must be absolute paths.
Use the following keys to interact with the application while its running:
q: Quit the application.r: Refresh the UI data manually.c: Cycle through the color themes.b: Cycle through the background colors.p: Party Mode (Randomly cycles through colors)i: Toggle Info layout (displays system info)F (Shift+f): Toggle Fan & Thermals layout (fan monitoring + all temperature sensors)l: Cycle through the available layouts.o: Jump to the ports layout (listening TCP/UDP ports; press again to go back).m: Jump to the memory pressure layout (press again to go back).e: On the ports layout, toggle external-only filter.+ or =: Increase update interval (slower updates).-: Decrease update interval (faster updates).F9: Kill the currently selected process (pauses updates while selecting).Arrow Keys or h/j/k/l: Navigate the process list and select columns.g / G: Jump to the top or bottom of the process list./: Search/Filter the process list by name (Esc to clear).Enter or Space: Sort by the selected column.h or ?: Toggle the help menu.--fan-control flag + sudo, only active in Fan layout)Fan control writes to the SMC, which is privileged — run with
sudo mactop --fan-control. Without root the keys below have no effect (mactop will show a warning in the Fan panel). Note: on recent macOS the system thermal governor may also override manual fan targets.
+ or =: Increase fan speed (+100 RPM)-: Decrease fan speed (-100 RPM)a: Toggle auto/manual fan mode0: Set all fans to minimum speed9: Set all fans to maximum speedR (Shift+r): Reset all fans to automatic controlFan control also works without the TUI — from scripts, cron jobs, or over SSH:
# Read fan state (no root needed) — JSON on stdout
mactop --fan-status

# Pin all fans to 3000 RPM (or a percent of each fan's min–max range, or min/max)
sudo mactop --fan-set 3000
sudo mactop --fan-set 60%
sudo mactop --fan-set max

# Pin only fan 1
sudo mactop --fan-set 2500 --fan-id 1

# Restore automatic fan control
sudo mactop --fan-auto        # (equivalent: sudo mactop --fan-set auto)
Each command performs its SMC writes, prints the resulting fan state as JSON to stdout (human-readable messages go to stderr; --pretty is honored), and exits — exit code 0 on success, 1 on failure. After writing, mactop reads the fan state back and fails with a warning if the OS silently rejected the write.
⚠️ Unlike the interactive TUI,
--fan-setintentionally leaves the fans pinned in manual mode after mactop exits — that's what makes it usable headlessly. Nothing will restore automatic control until you runsudo mactop --fan-auto(or reboot). Pinning fans below their automatic speed under load can cause thermal throttling; the macOS thermal governor may also override manual targets on recent macOS versions.
[{
  "timestamp": "2025-12-22T18:16:57-07:00",
  "soc_metrics": {
    "cpu_power": 2.1959999999999997,
    "gpu_power": 5.38552801,
    "ane_power": 0,
    "dram_power": 5.702,
    "gpu_sram_power": 0.158,
    "system_power": 37.47166092432617,
    "total_power": 50.91318893432617,
    "gpu_freq_mhz": 643,
    "soc_temp": 62.562572,
    "cpu_temp": 62.562572,
    "gpu_temp": 58.38886
  },
  "memory": {
    "total": 137438953472,
    "used": 74062512128,
    "available": 63376441344,
    "swap_total": 5368709120,
    "swap_used": 4094689280
  },
  "net_disk": {
    "out_packets_per_sec": 589.4371024829012,
    "out_bytes_per_sec": 196028.18012655922,
    "in_packets_per_sec": 593.3256375185223,
    "in_bytes_per_sec": 74461.55739710879,
    "read_ops_per_sec": 0.32404458630175986,
    "write_ops_per_sec": 40.18152870141822,
    "read_kbytes_per_sec": 1.2961783452070395,
    "write_kbytes_per_sec": 308.4904461592754
  },
  "cpu_usage": 15.140564910346725,
  "gpu_usage": 53.51970510465884,
  "core_usages": [
    42.244224422442244,
    37.17105263157895,
    55.26315789473685,
    37.704918032786885,
    27.21311475409836,
    21.241830065359476,
    14.563106796116504,
    6.148867313915858,
    4.193548387096775,
    1.9417475728155338,
    30.718954248366014,
    20.846905537459286,
    1.9417475728155338,
    1.2944983818770228,
    0.3236245954692557,
    0,
    0,
    0,
    0,
    0
  ],
  "system_info": {
    "name": "Apple M1 Ultra",
    "core_count": 20,
    "e_core_count": 4,
    "p_core_count": 16,
    "gpu_core_count": 64
  },
  "thermal_state": "Normal",
  "thunderbolt_info": {
    "buses": [
      {
        "name": "TB4 Bus 5",
        "status": "Active (USB)",
        "icon": "⏺",
        "speed": "Up to 40 Gb/s",
        "domain_uuid": "9FDBA52F-DF7C-425E-B67B-FB80F9E1DCD6",
        "switch_uid": "0x05AC38BE5E390FE5",
        "receptacle_id": "6",
        "devices": [
          {
            "name": "ASM236X NVME",
            "mode": "USB",
            "info_string": "USB, SSD"
          }
        ],
        "network_stats": {
          "interface_name": "en7",
          "bytes_in": 0,
          "bytes_out": 0,
          "bytes_in_per_sec": 0,
          "bytes_out_per_sec": 0,
          "packets_in": 0,
          "packets_out": 0
        }
      },
      {
        "name": "TB4 Bus 4",
        "status": "Inactive",
        "icon": "○",
        "speed": "Up to 40 Gb/s",
        "domain_uuid": "5DD6DE43-051D-4B32-B044-23E57AA0EEC8",
        "switch_uid": "0x05AC38BE5E390FE4",
        "receptacle_id": "5",
        "network_stats": {
          "interface_name": "en6",
          "bytes_in": 0,
          "bytes_out": 0,
          "bytes_in_per_sec": 0,
          "bytes_out_per_sec": 0,
          "packets_in": 0,
          "packets_out": 0
        }
      },
      {
        "name": "TB4 @ TB3 Bus 3",
        "status": "Active",
        "icon": "ϟ",
        "speed": "20 Gb/s",
        "domain_uuid": "AF4CE493-9005-4E9D-8B8B-0198D27BABA3",
        "switch_uid": "0x05AC38BE5E390FE3",
        "receptacle_id": "4",
        "devices": [
          {
            "name": "Studio Display",
            "vendor": "Apple Inc.",
            "vendor_id": "0x0001",
            "mode": "TB3",
            "switch_uid": "0x0001AFBD0C588A00",
            "device_id": "0x801F",
            "info_string": "Apple Inc., TB3"
          }
        ],
        "network_stats": {
          "interface_name": "en5",
          "bytes_in": 0,
          "bytes_out": 0,
          "bytes_in_per_sec": 0,
          "bytes_out_per_sec": 0,
          "packets_in": 0,
          "packets_out": 0
        }
      },
      {
        "name": "TB4 Bus 2",
        "status": "Inactive",
        "icon": "○",
        "speed": "Up to 40 Gb/s",
        "domain_uuid": "D589EEFE-98CF-42EC-A729-6C3E523AA321",
        "switch_uid": "0x05AC38BE5E390FE2",
        "receptacle_id": "3",
        "network_stats": {
          "interface_name": "en4",
          "bytes_in": 0,
          "bytes_out": 0,
          "bytes_in_per_sec": 0,
          "bytes_out_per_sec": 0,
          "packets_in": 0,
          "packets_out": 0
        }
      },
      {
        "name": "TB4 Bus 1",
        "status": "Inactive",
        "icon": "○",
        "speed": "Up to 40 Gb/s",
        "domain_uuid": "6DAC6FCD-E102-4CCD-9D01-A75540E660CA",
        "switch_uid": "0x05AC38BE5E390FE1",
        "receptacle_id": "2",
        "network_stats": {
          "interface_name": "en3",
          "bytes_in": 0,
          "bytes_out": 0,
          "bytes_in_per_sec": 0,
          "bytes_out_per_sec": 0,
          "packets_in": 0,
          "packets_out": 0
        }
      },
      {
        "name": "TB4 Bus 0",
        "status": "Inactive",
        "icon": "○",
        "speed": "Up to 40 Gb/s",
        "domain_uuid": "63A80A32-E70C-4F22-84BE-EDE632A5BA3E",
        "switch_uid": "0x05AC38BE5E390FE0",
        "receptacle_id": "1",
        "network_stats": {
          "interface_name": "en2",
          "bytes_in": 0,
          "bytes_out": 0,
          "bytes_in_per_sec": 0,
          "bytes_out_per_sec": 0,
          "packets_in": 0,
          "packets_out": 0
        }
      }
    ]
  },
  "tb_net_total_bytes_in_per_sec": 0,
  "tb_net_total_bytes_out_per_sec": 0,
  "rdma_status": {
    "available": false,
    "status": "RDMA Disabled (use rdma_ctl enable in Recovery Mode)"
  },
  "cpu_temp": 62.562572,
  "gpu_temp": 58.38886
}
]
(If you have a confirmed working Apple Silicon chip that is not listed, please open an issue, so we may add it here!)
Contributions are what make the open-source community such an amazing place to learn, inspire, and create. Any contributions you make are greatly appreciated.
git checkout -b feature/AmazingFeature)git commit -m 'Add some AmazingFeature')git push origin feature/AmazingFeature)DCS BW / AMCC RD|WR|RD+WR histograms (M4 Pro/Max; AMC Stats does not subscribe on those chips). DRAM power is also used for auto-calibrated bandwidth estimation on M5+ chipspmgr devicehost_processor_info): For CPU metrics (E-cores, P-cores, and S-cores on M5+) via CGODistributed under the MIT License. See LICENSE for more information.
Carsen Klock - @carsenklock
Project Link: https://github.com/metaspartan/mactop
This tool is not officially supported by Apple. It is provided as is, and may not work as expected. Use at your own risk.
(top 24 of 42)
2,241 followers · starred Dec 2025
1,422 followers · starred Apr 2026
26 followers · starred Mar 2026
706 followers · starred Jan 2026