
A fetch-style stats dashboard for your MacBook, with an htop-flavored core grid and process table
Go
1
3 commits
updated Sep 16, 2026
See what people are saying (1)
README
macstat
A fetch-style dashboard for your MacBook with an htop-flavored lower half. One binary, ~50 ms.
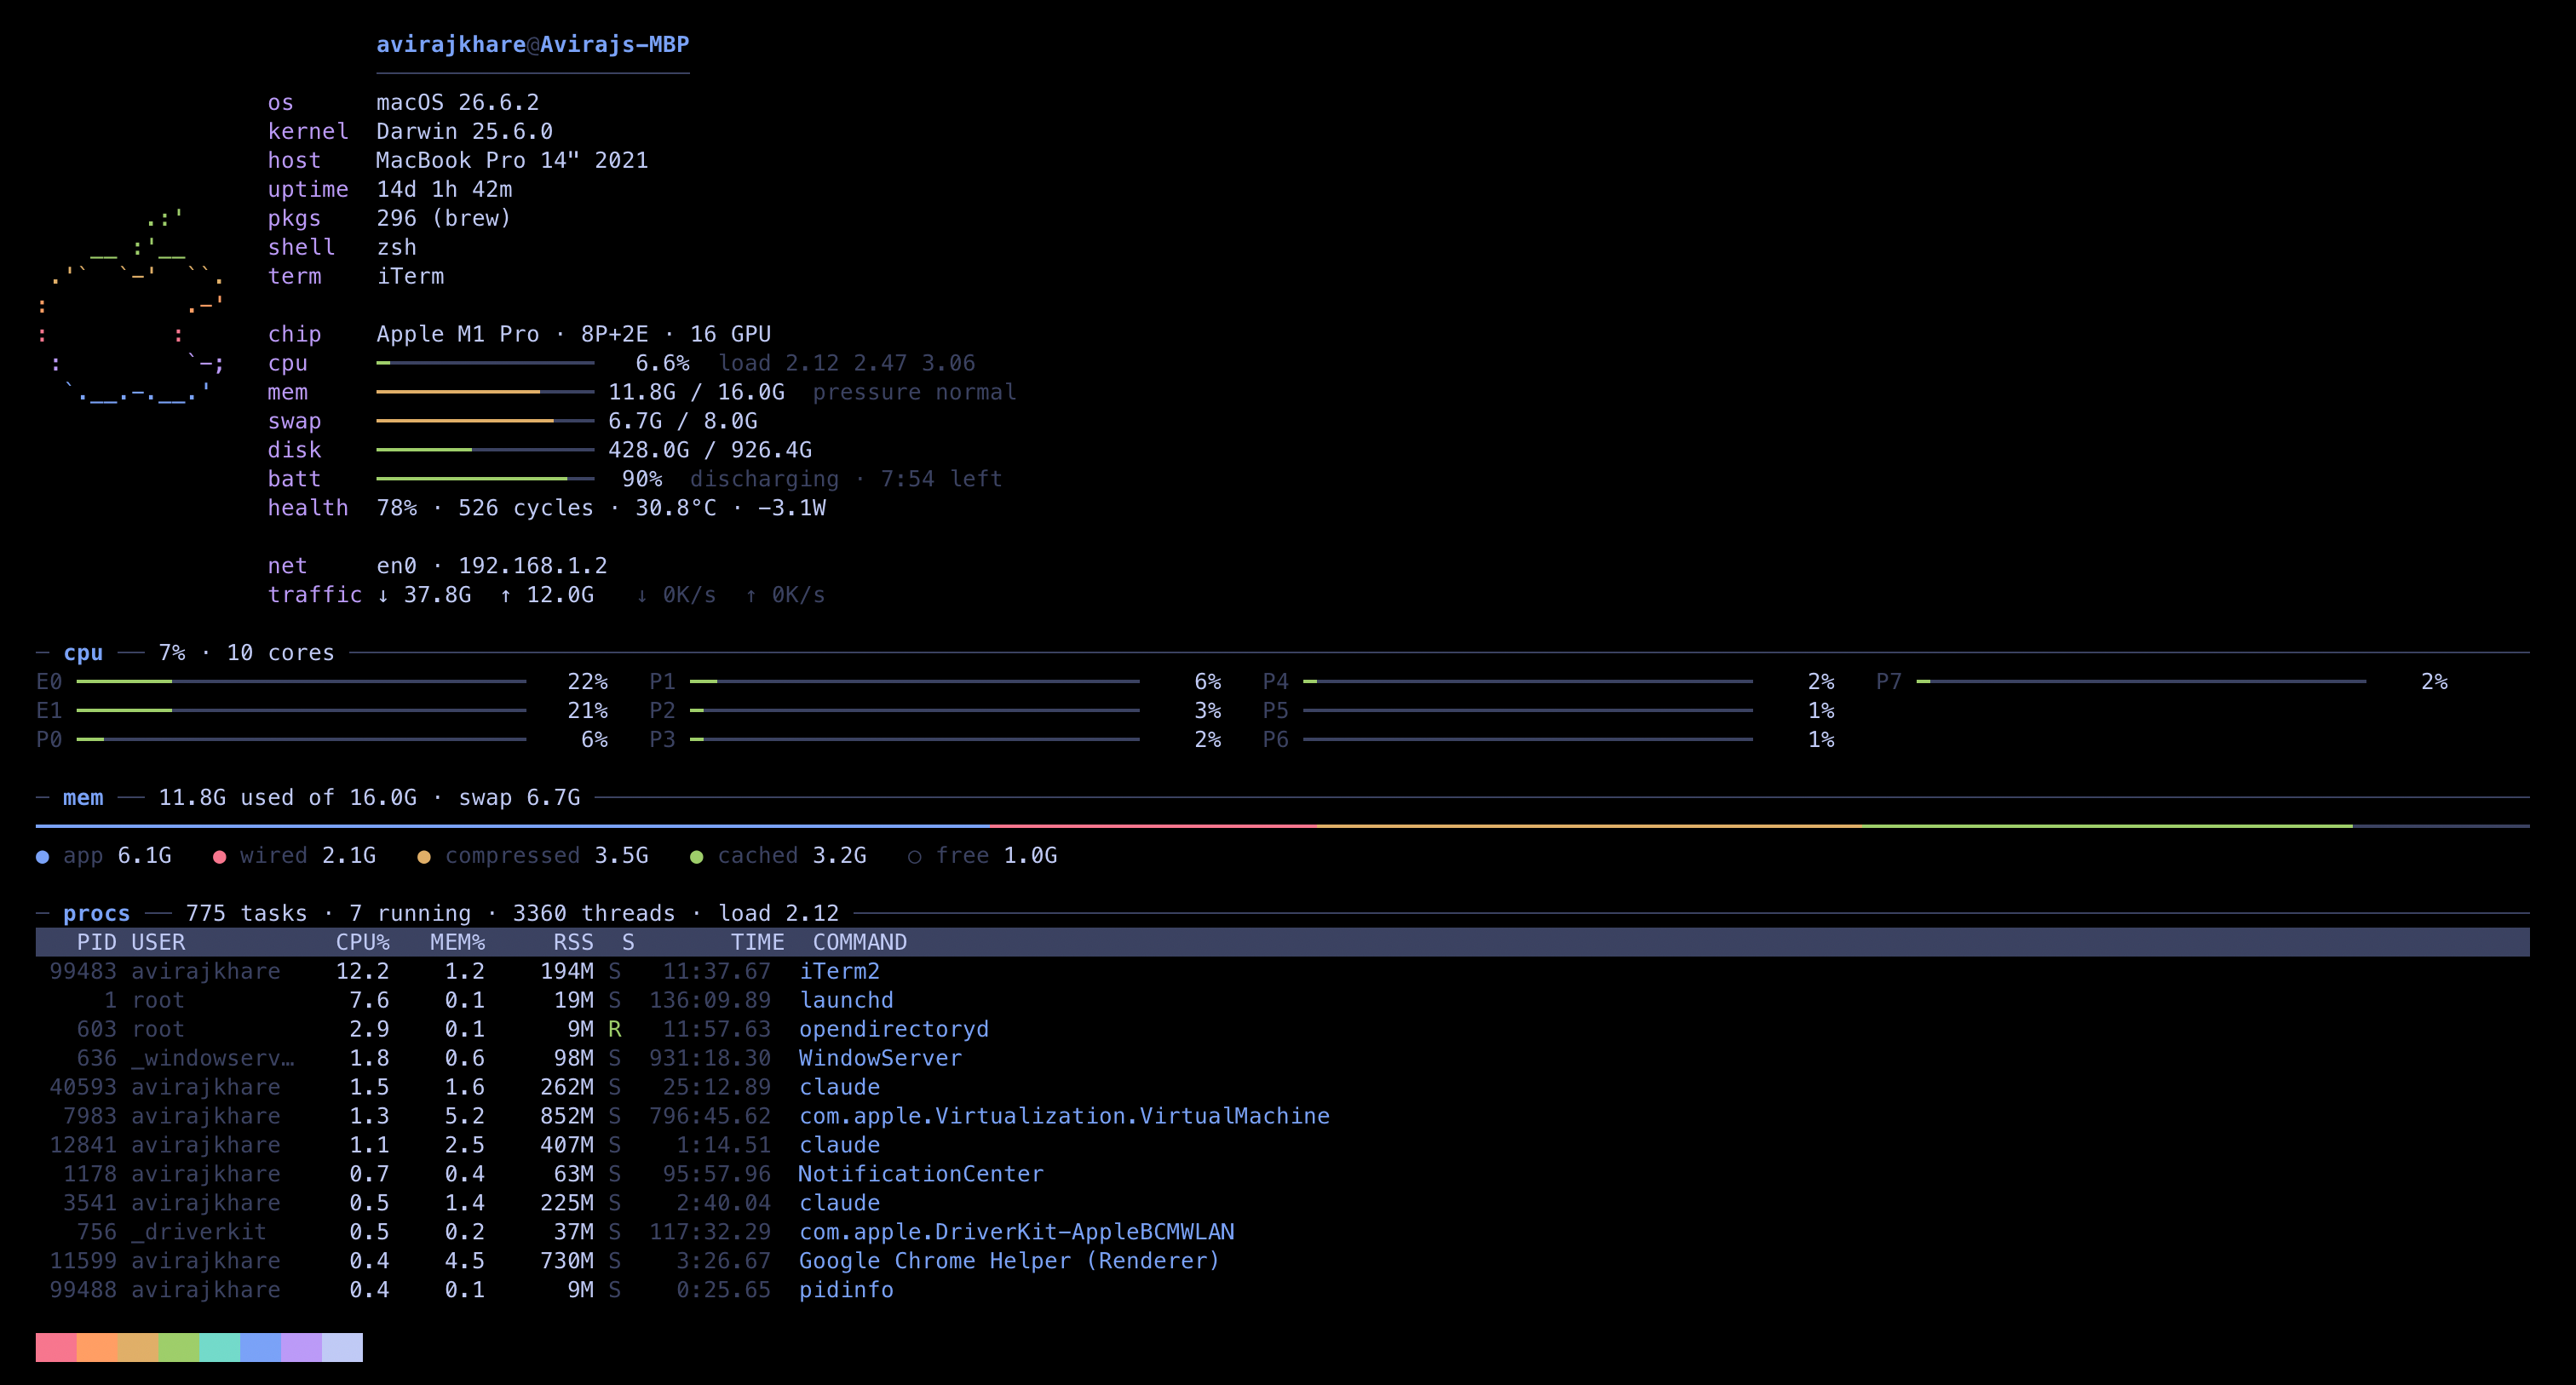
Top: logo, identity, and bars for cpu / mem / swap / disk / battery / network. Bottom: a per-core grid (E and P cores labelled), a stacked memory breakdown (app · wired · compressed · cached · free), and a process table with PID, user, cpu%, mem%, RSS, state, cpu time, and command.
Install
Grab a binary from the releases page (Apple Silicon and Intel):
tar -xzf macstat-*-darwin-arm64.tar.gz
xattr -d com.apple.quarantine macstat   # not notarized, so Gatekeeper quarantines browser downloads
mv macstat /usr/local/bin/
Or build it yourself (needs Go and Xcode Command Line Tools for the cgo core sampler):
go install github.com/avirajkhare00/macstat@latest   # or, from a clone:
go build -o macstat . && cp macstat /usr/local/bin/
Use
macstat                      # once, tokyonight
macstat --theme catppuccin   # tokyonight | catppuccin | gruvbox | nord | rosepine
macstat --watch 2s           # live, full-screen, ctrl-c to exit
macstat --compact            # fetch block only, like the first version
macstat --no-logo --top 20   # bigger process table
macstat --json               # raw stats for scripts / status bars
export MACSTAT_THEME=nord    # default theme
Drop macstat at the end of your ~/.zshrc for a greeting on every new shell.
What it reads
| row | source |
|---|---|
| os / kernel / host / uptime | sysctl |
| pkgs | /opt/homebrew/Cellar + Caskroom |
| chip | sysctl + ioreg AGXAccelerator for GPU cores |
| cpu / cores | Mach host_processor_info (tick deltas, like htop) + vm.loadavg |
| mem | vm_stat (app + wired + compressed, same as Activity Monitor) + kern.memorystatus_vm_pressure_level |
| swap | vm.swapusage |
| disk | df / |
| batt / health | ioreg AppleSmartBattery + pmset |
| net | route, ipconfig, netstat |
| procs | ps (table, task and running counts) + ps -M (thread count) |
Bars go green → yellow at 60% → red at 85%. Battery flips at 35% and 15%.
Contributors

3 commits
Similar repos


Languages
Go
100.0%
A fetch-style stats dashboard for your MacBook, with an htop-flavored core grid and process table
Go
1
3 commits
updated Sep 16, 2026
See what people are saying (1)
README
macstat
A fetch-style dashboard for your MacBook with an htop-flavored lower half. One binary, ~50 ms.
Top: logo, identity, and bars for cpu / mem / swap / disk / battery / network. Bottom: a per-core grid (E and P cores labelled), a stacked memory breakdown (app · wired · compressed · cached · free), and a process table with PID, user, cpu%, mem%, RSS, state, cpu time, and command.
Install
Grab a binary from the releases page (Apple Silicon and Intel):
tar -xzf macstat-*-darwin-arm64.tar.gz
xattr -d com.apple.quarantine macstat   # not notarized, so Gatekeeper quarantines browser downloads
mv macstat /usr/local/bin/
Or build it yourself (needs Go and Xcode Command Line Tools for the cgo core sampler):
go install github.com/avirajkhare00/macstat@latest   # or, from a clone:
go build -o macstat . && cp macstat /usr/local/bin/
Use
macstat                      # once, tokyonight
macstat --theme catppuccin   # tokyonight | catppuccin | gruvbox | nord | rosepine
macstat --watch 2s           # live, full-screen, ctrl-c to exit
macstat --compact            # fetch block only, like the first version
macstat --no-logo --top 20   # bigger process table
macstat --json               # raw stats for scripts / status bars
export MACSTAT_THEME=nord    # default theme
Drop macstat at the end of your ~/.zshrc for a greeting on every new shell.
What it reads
| row | source |
|---|---|
| os / kernel / host / uptime | sysctl |
| pkgs | /opt/homebrew/Cellar + Caskroom |
| chip | sysctl + ioreg AGXAccelerator for GPU cores |
| cpu / cores | Mach host_processor_info (tick deltas, like htop) + vm.loadavg |
| mem | vm_stat (app + wired + compressed, same as Activity Monitor) + kern.memorystatus_vm_pressure_level |
| swap | vm.swapusage |
| disk | df / |
| batt / health | ioreg AppleSmartBattery + pmset |
| net | route, ipconfig, netstat |
| procs | ps (table, task and running counts) + ps -M (thread count) |
Bars go green → yellow at 60% → red at 85%. Battery flips at 35% and 15%.
Similar repos
Contributors
3 commits
Languages
Go
100.0%