
Live earthquake dashboard (USGS + EarthScope), plain HTML/JS
JavaScript
0
2 commits
updated Oct 6, 2026
See what people are saying
README
QUAKE DESK
A live earthquake dashboard that runs entirely in the browser: no server code, no build step, no dependencies.
Live demo: https://brigante-ux.github.io/quake-desk/
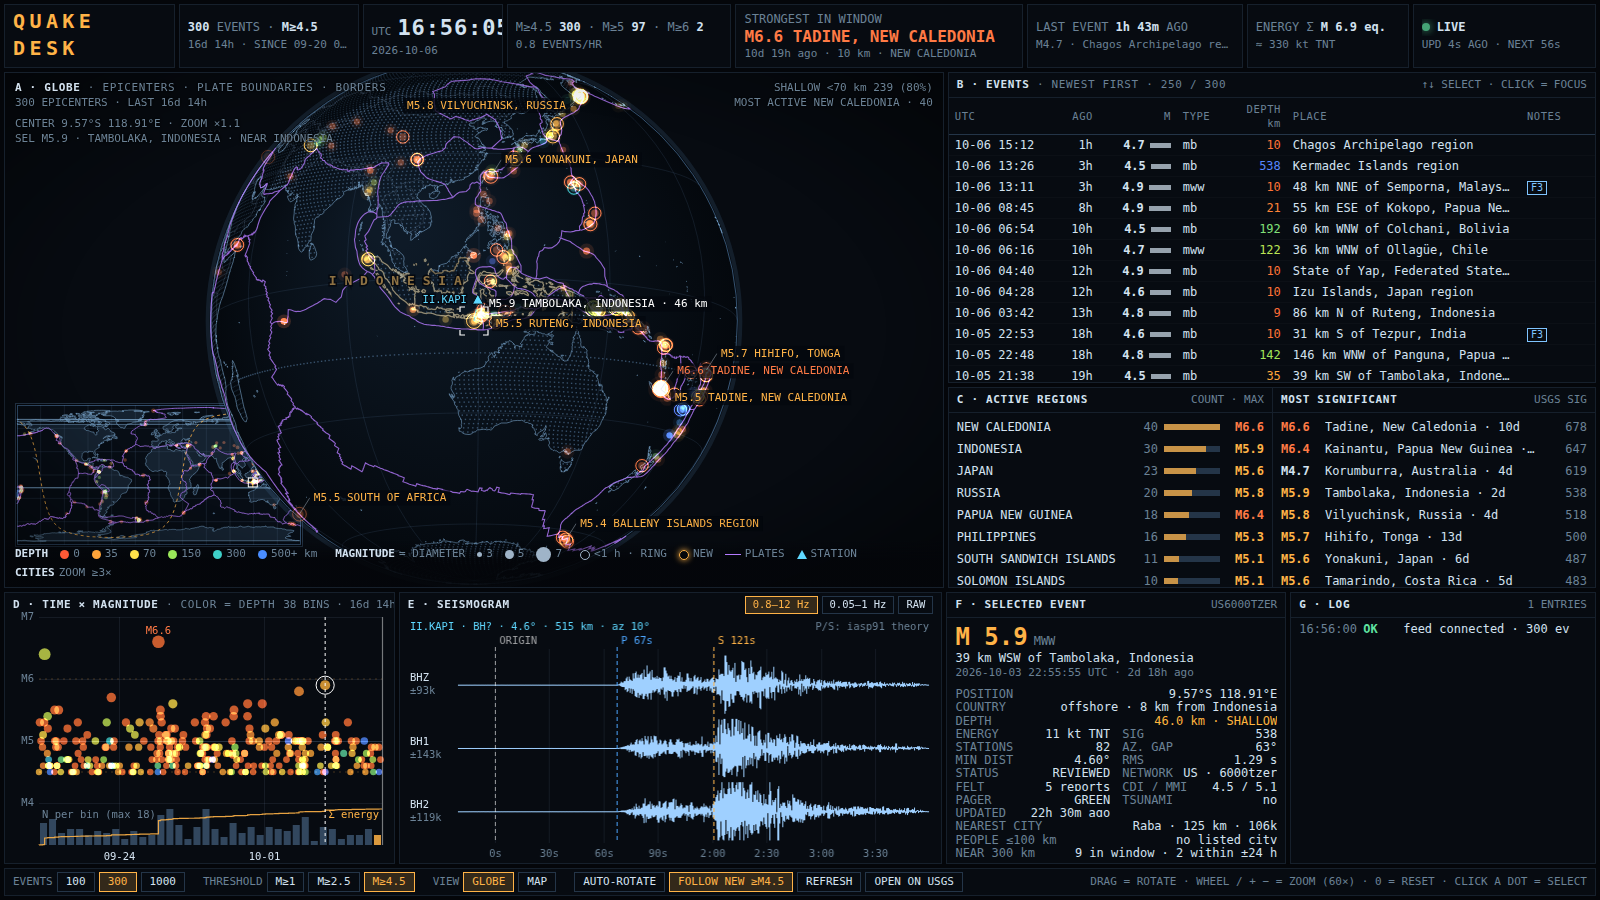
It shows the latest N earthquakes from USGS on a rotating globe (or flat map), and for any selected event pulls a real seismogram from the nearest open seismic station:
- Globe / map: epicenters (diameter = magnitude, color = depth), plate boundaries, country borders. Zoom up to 60× toward the cursor; coastlines get detailed, land fills in, and cities appear as you get closer. Selecting an event outlines and names its country and draws the station used for the seismogram.
- Events table: newest first, with tsunami / PAGER / "felt" / automatic-solution flags.
- Regions and most significant events: grouped by region, ranked by USGS significance.
- Time × magnitude: aftershock sequences and bursts at a glance, with counts per bin and cumulative energy.
- Seismogram: three components from the nearest station that has open data, with the theoretical P and S arrivals (iasp91) and a choice of filters.
- Event details: location quality, energy as TNT equivalent, country, nearest city and people within 100 km.
- Log: new events and magnitude revisions while the page is open. The feed refreshes every minute.
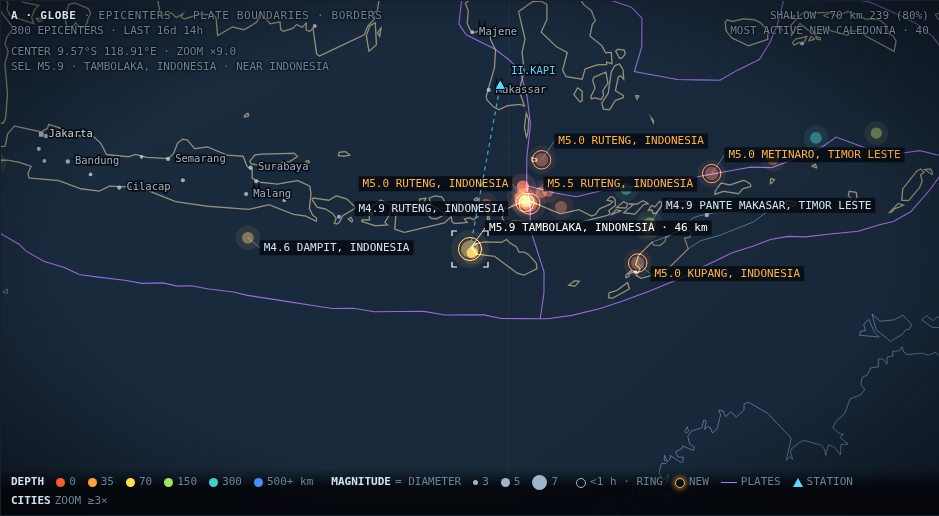
Not an official or emergency service. This is an independent visualization of public data. For alerts and official information use USGS, INGV or your local civil protection authority.
Run it
It is a static site. Any web server works:
python3 -m http.server 8765 # then open http://localhost:8765/
or publish the repository root with GitHub Pages (Settings → Pages → Deploy from a branch → main / root).
URL parameters: ?n=300 (latest N events, 20–2000), ?minmag=2.5, ?view=globe|map, ?debug (exposes a
window.QD test hook).
Keys: ↑↓ select · V globe/map · R auto-rotate · F follow new ≥M4.5 · O open on USGS · U refresh ·
+ − or wheel zoom · 0 reset zoom.
How it works
Everything runs in the visitor's browser; the server only hands out the static files. The page talks directly to:
- USGS earthquake feeds (CDN-cached GeoJSON) for the initial load, the FDSN event API as a fallback for large windows, then a 60-second poll of the "day" feed merged into the window.
- EarthScope FDSN station and dataselect services for stations and waveforms. The miniSEED data is decoded in
mseed.js(Steim-1/2, verified sample by sample against ObsPy).
What is computed locally, and not taken from a source: energy (E = 10^(1.5·M + 4.8) J), counts and rates, region
grouping (parsed from USGS's place text), country (point-in-polygon on Natural Earth), nearest city and the rough
population estimate, station distance and azimuth, theoretical P/S times (interpolated from a precomputed iasp91
table), and the seismogram filters. Amplitudes are in digitizer counts (no instrument-response correction). It does
not locate earthquakes or compute magnitudes: those are USGS's.
Data sources and credits
| Data | Source | Terms |
|---|---|---|
| Earthquakes | USGS Earthquake Hazards Program | Public domain |
| Waveforms, stations | EarthScope Consortium data services | Open data; individual networks may ask for citation, see the network's FDSN DOI |
| Coastlines, countries, cities | Natural Earth (110m / 50m / 10m), via world-atlas and natural-earth-vector | Public domain |
| Plate boundaries | Bird, P. (2003), An updated digital model of plate boundaries, G³ 4(3), 1027, doi:10.1029/2001GC000252; digitized by Hugo Ahlenius, Nordpil, fraxen/tectonicplates | ODC-By 1.0: attribution required |
| Travel times | iasp91 model (Kennett & Engdahl, 1991), tabulated with ObsPy TauP | Table generated by tools/build_ttimes.py |
Rebuilding the data files
geo.js, countries.js, cities.js and ttimes.js are generated from the public sources above:
pip install -r tools/requirements.txt     # only needed for ttimes.js (ObsPy)
tools/build_all.sh                         # or run each tools/build_*.py on its own (--out DIR to write elsewhere)
Downloads are cached in tools/.cache/. Sources such as natural-earth-vector track their master branch, so a
rebuild can differ slightly from the committed files if upstream changed.
Limitations
- Desktop only: the layout needs about 1180 px of width and the globe has no touch gestures yet.
- Tested in Chromium; Firefox and Safari are untested.
- It depends on public services that can change. Not every regional network shares its data openly, so the seismogram sometimes comes from a more distant station, or is unavailable (very recent or very small events).
- Please be kind to the data providers if you host it for many users.
Inspiration
The look and the zone-based layout (a hero visualization surrounded by tables, profiles and a log) were inspired by GULLET, a fictional cave-survey interface from the SCENESCAPES collection by Annas Rahman (uispace.org/gullet.html, gallery at uispace.org). No code or assets from that work are used here; it is © its author and not covered by this repository's license.
License
MIT for the code. The bundled data files keep the terms of their sources (see above).
If this is useful to you, you can buy me a coffee. It is never required.


Live earthquake dashboard (USGS + EarthScope), plain HTML/JS
JavaScript
0
2 commits
updated Oct 6, 2026
See what people are saying
README
QUAKE DESK
A live earthquake dashboard that runs entirely in the browser: no server code, no build step, no dependencies.
Live demo: https://brigante-ux.github.io/quake-desk/
It shows the latest N earthquakes from USGS on a rotating globe (or flat map), and for any selected event pulls a real seismogram from the nearest open seismic station:
- Globe / map: epicenters (diameter = magnitude, color = depth), plate boundaries, country borders. Zoom up to 60× toward the cursor; coastlines get detailed, land fills in, and cities appear as you get closer. Selecting an event outlines and names its country and draws the station used for the seismogram.
- Events table: newest first, with tsunami / PAGER / "felt" / automatic-solution flags.
- Regions and most significant events: grouped by region, ranked by USGS significance.
- Time × magnitude: aftershock sequences and bursts at a glance, with counts per bin and cumulative energy.
- Seismogram: three components from the nearest station that has open data, with the theoretical P and S arrivals (iasp91) and a choice of filters.
- Event details: location quality, energy as TNT equivalent, country, nearest city and people within 100 km.
- Log: new events and magnitude revisions while the page is open. The feed refreshes every minute.
Not an official or emergency service. This is an independent visualization of public data. For alerts and official information use USGS, INGV or your local civil protection authority.
Run it
It is a static site. Any web server works:
python3 -m http.server 8765 # then open http://localhost:8765/
or publish the repository root with GitHub Pages (Settings → Pages → Deploy from a branch → main / root).
URL parameters: ?n=300 (latest N events, 20–2000), ?minmag=2.5, ?view=globe|map, ?debug (exposes a
window.QD test hook).
Keys: ↑↓ select · V globe/map · R auto-rotate · F follow new ≥M4.5 · O open on USGS · U refresh ·
+ − or wheel zoom · 0 reset zoom.
How it works
Everything runs in the visitor's browser; the server only hands out the static files. The page talks directly to:
- USGS earthquake feeds (CDN-cached GeoJSON) for the initial load, the FDSN event API as a fallback for large windows, then a 60-second poll of the "day" feed merged into the window.
- EarthScope FDSN station and dataselect services for stations and waveforms. The miniSEED data is decoded in
mseed.js(Steim-1/2, verified sample by sample against ObsPy).
What is computed locally, and not taken from a source: energy (E = 10^(1.5·M + 4.8) J), counts and rates, region
grouping (parsed from USGS's place text), country (point-in-polygon on Natural Earth), nearest city and the rough
population estimate, station distance and azimuth, theoretical P/S times (interpolated from a precomputed iasp91
table), and the seismogram filters. Amplitudes are in digitizer counts (no instrument-response correction). It does
not locate earthquakes or compute magnitudes: those are USGS's.
Data sources and credits
| Data | Source | Terms |
|---|---|---|
| Earthquakes | USGS Earthquake Hazards Program | Public domain |
| Waveforms, stations | EarthScope Consortium data services | Open data; individual networks may ask for citation, see the network's FDSN DOI |
| Coastlines, countries, cities | Natural Earth (110m / 50m / 10m), via world-atlas and natural-earth-vector | Public domain |
| Plate boundaries | Bird, P. (2003), An updated digital model of plate boundaries, G³ 4(3), 1027, doi:10.1029/2001GC000252; digitized by Hugo Ahlenius, Nordpil, fraxen/tectonicplates | ODC-By 1.0: attribution required |
| Travel times | iasp91 model (Kennett & Engdahl, 1991), tabulated with ObsPy TauP | Table generated by tools/build_ttimes.py |
Rebuilding the data files
geo.js, countries.js, cities.js and ttimes.js are generated from the public sources above:
pip install -r tools/requirements.txt     # only needed for ttimes.js (ObsPy)
tools/build_all.sh                         # or run each tools/build_*.py on its own (--out DIR to write elsewhere)
Downloads are cached in tools/.cache/. Sources such as natural-earth-vector track their master branch, so a
rebuild can differ slightly from the committed files if upstream changed.
Limitations
- Desktop only: the layout needs about 1180 px of width and the globe has no touch gestures yet.
- Tested in Chromium; Firefox and Safari are untested.
- It depends on public services that can change. Not every regional network shares its data openly, so the seismogram sometimes comes from a more distant station, or is unavailable (very recent or very small events).
- Please be kind to the data providers if you host it for many users.
Inspiration
The look and the zone-based layout (a hero visualization surrounded by tables, profiles and a log) were inspired by GULLET, a fictional cave-survey interface from the SCENESCAPES collection by Annas Rahman (uispace.org/gullet.html, gallery at uispace.org). No code or assets from that work are used here; it is © its author and not covered by this repository's license.
License
MIT for the code. The bundled data files keep the terms of their sources (see above).
If this is useful to you, you can buy me a coffee. It is never required.