
Interactive visualization for large geospatial point datasets
See the codeREADME
Geospatial Atlas

This is a fork of Embedding Atlas adapted for geospatial data. As embeddings or rather their 2D projections share the exact same visualization challenges like 2D geospatial data, Embedding Atlas and all its functionality serve a great deal in geospatial data exploration!
Verified at 322 M points in the desktop app on a 32 GB Apple Silicon laptop, ~100 M in a vanilla browser tab (Chrome / Safari / Firefox-with-flag). For the full optimization journey see docs/optimization_history.md and docs/PERF-75M.md. Browser-side scale ceilings and the V8-flag workaround for the 322 M case are documented in Troubleshooting below.
Find various example apps here. Try for example the 6M GlobalGeoTree explorer! Load your own data (up to around 6M points) here: https://do-me.github.io/geospatial-atlas/app/!
You can load the data from a remote URL too! Clicking this link, you download 100Mb of geolocated Wikipedia articles: https://do-me.github.io/geospatial-atlas/app/#?data=https://pub-016504dd3a4d419a9c17a8939840935e.r2.dev/v1/wikipedia_geotagged.parquet
LinkedIn Post for more context
Desktop App Download
All links below resolve to the latest tagged release. See the CHANGELOG for what's in each version. All bundles are unsigned, so every platform needs a one-off bypass step after install — shown per-row below.
- Windows (MSI) — geospatial-atlas-windows-x64.msi Double-click; on the SmartScreen warning click More info → Run anyway.
- Windows (NSIS setup) — geospatial-atlas-windows-x64-setup.exe Double-click; same More info → Run anyway SmartScreen step.
- macOS (Apple Silicon) — geospatial-atlas-macos-arm64.dmg
Open the dmg, drag to
/Applications, then strip the Gatekeeper quarantine flag once:xattr -cr "/Applications/Geospatial Atlas.app" - 🐧 Linux (Debian / Ubuntu) — geospatial-atlas-linux-x64.deb
sudo dpkg -i geospatial-atlas-linux-x64.deb - 🐧 Linux (Fedora / RHEL) — geospatial-atlas-linux-x64.rpm
sudo rpm -i geospatial-atlas-linux-x64.rpm
More background in Desktop app releases below.
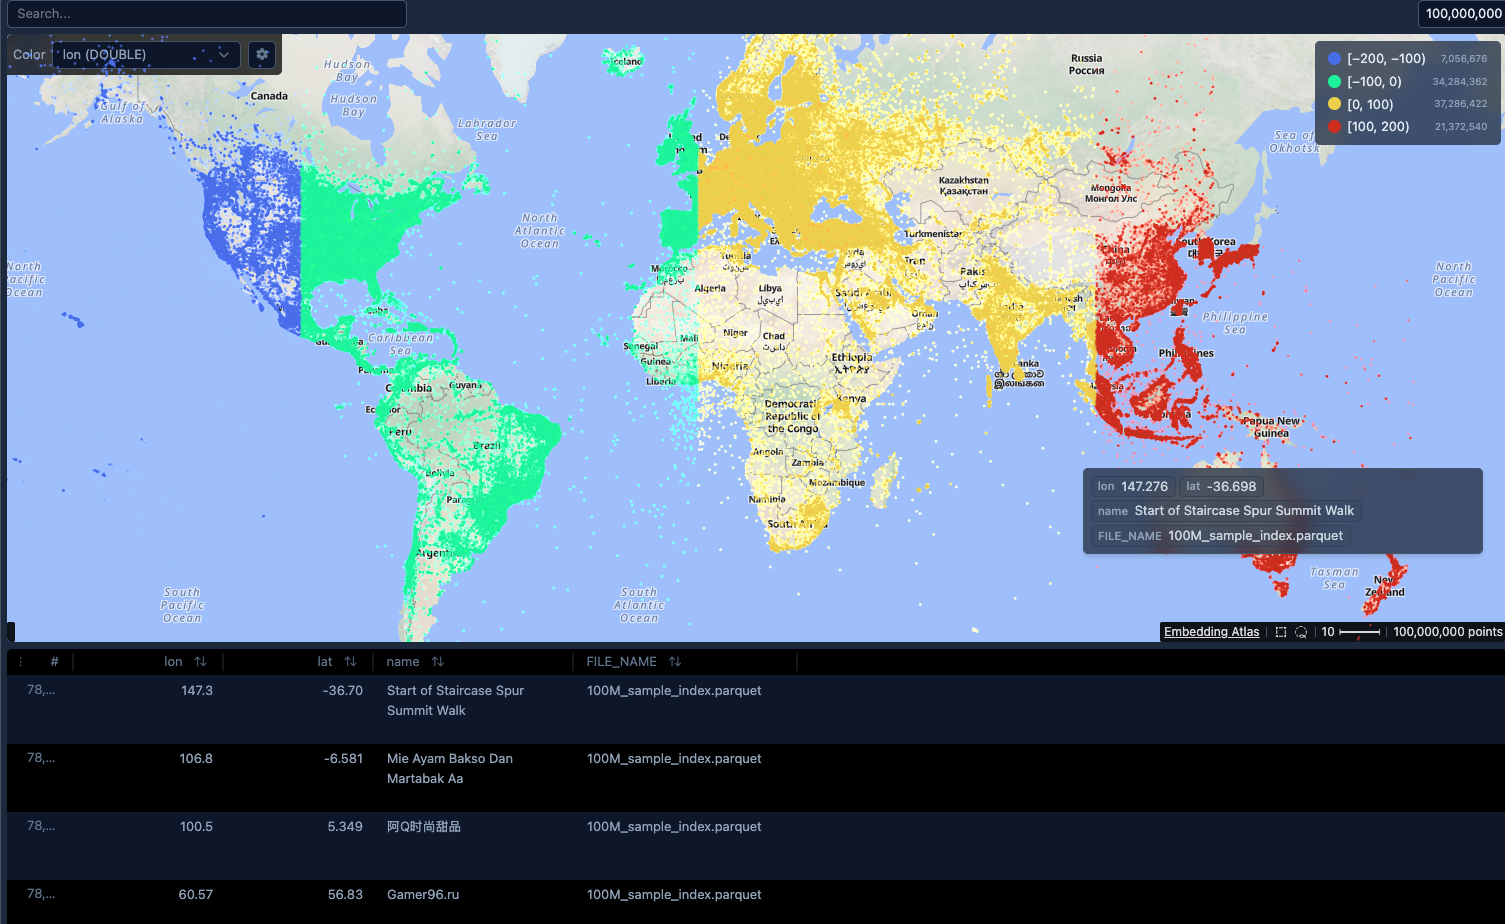
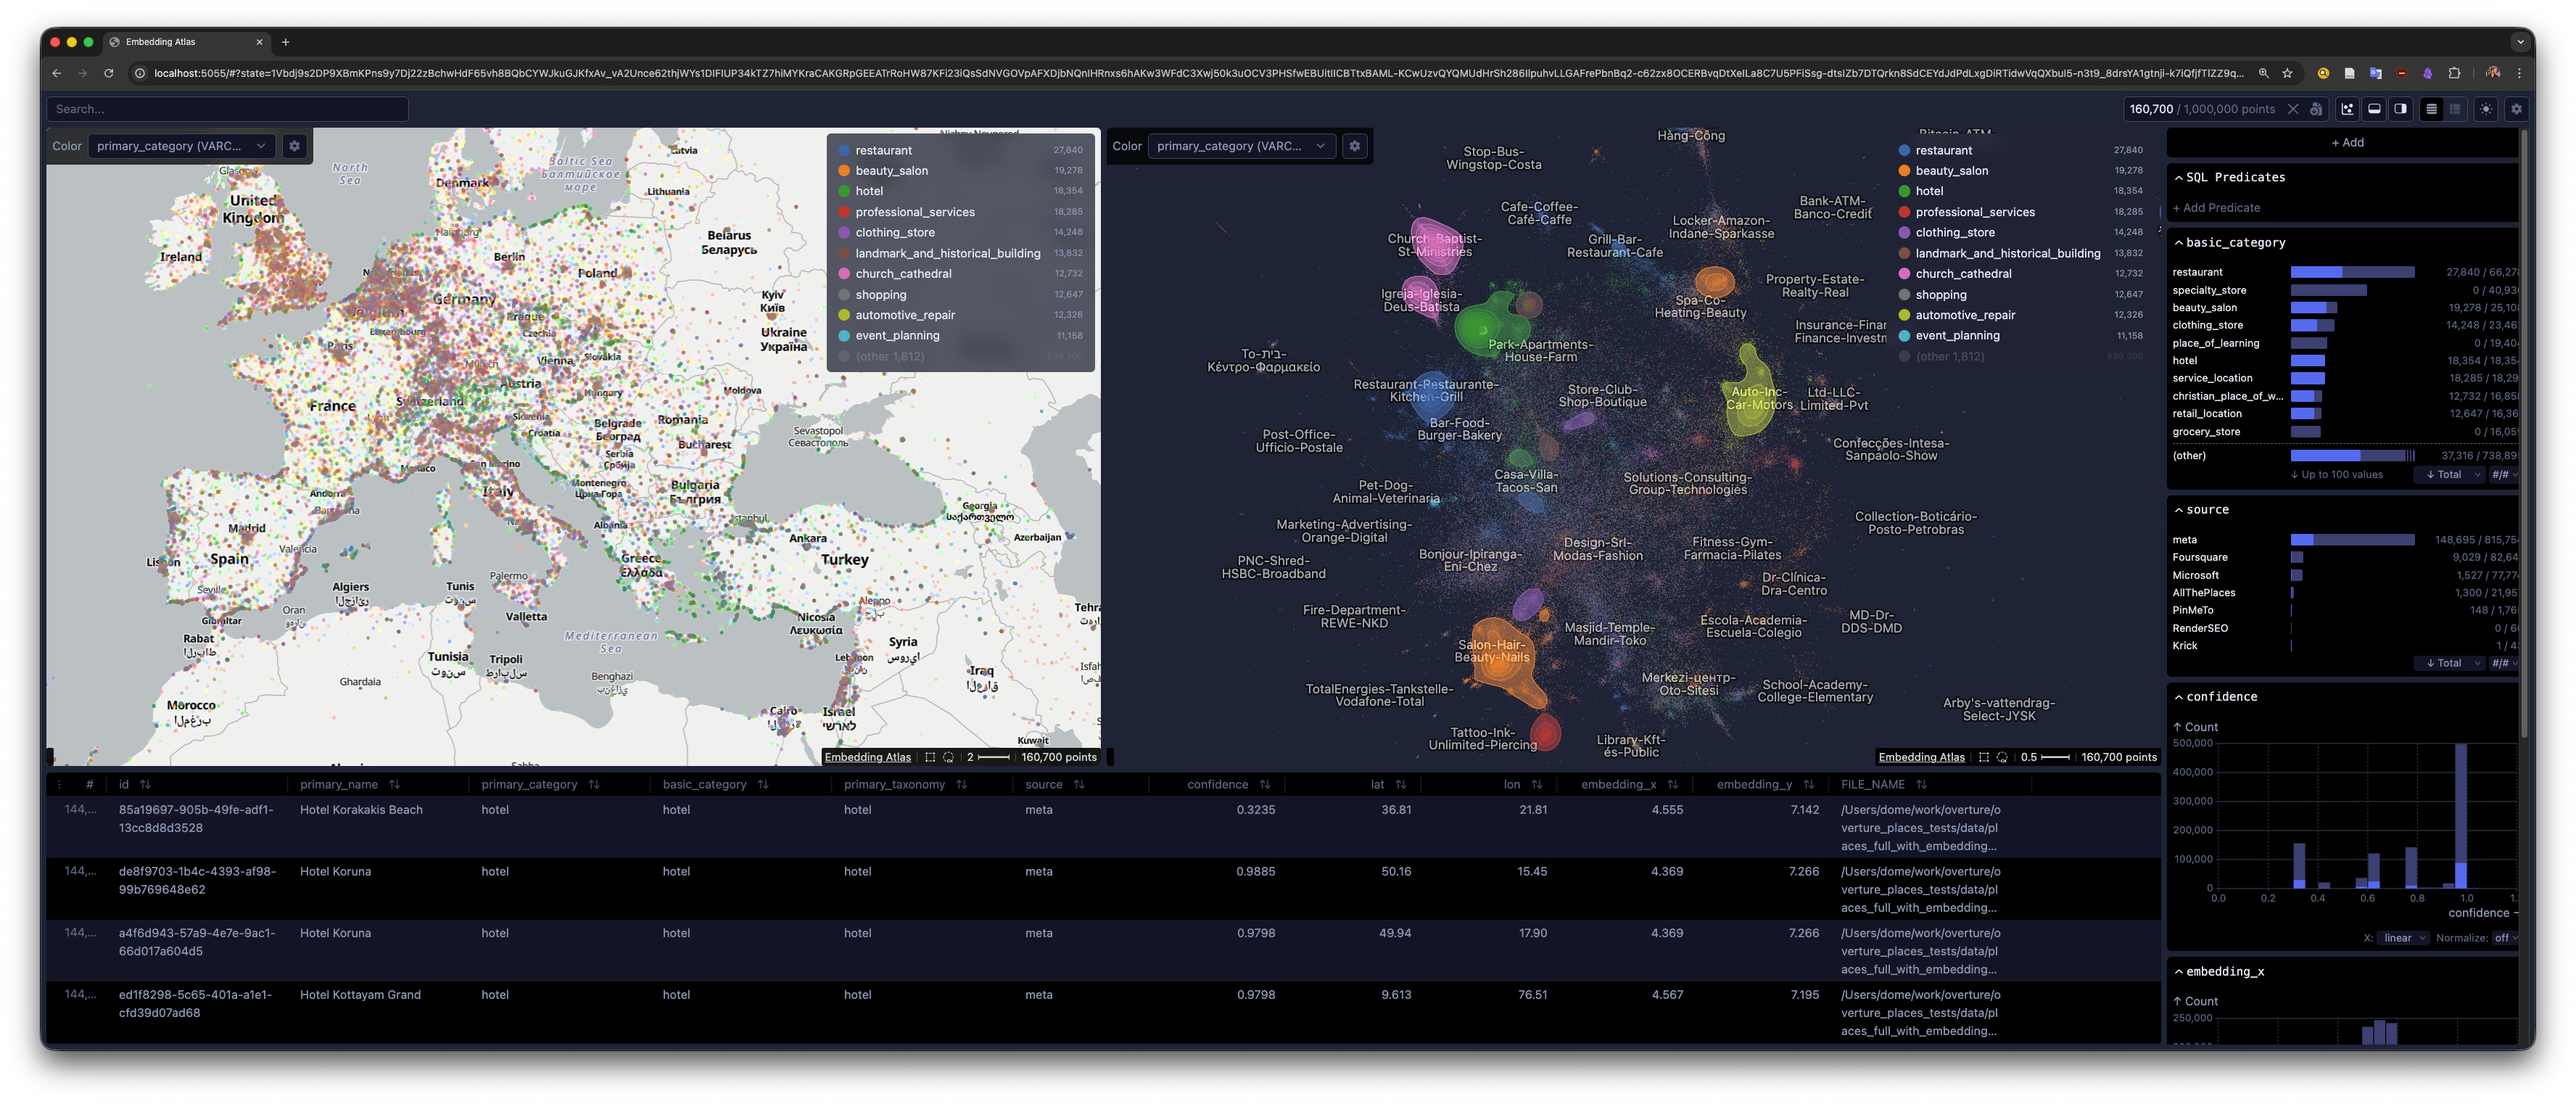
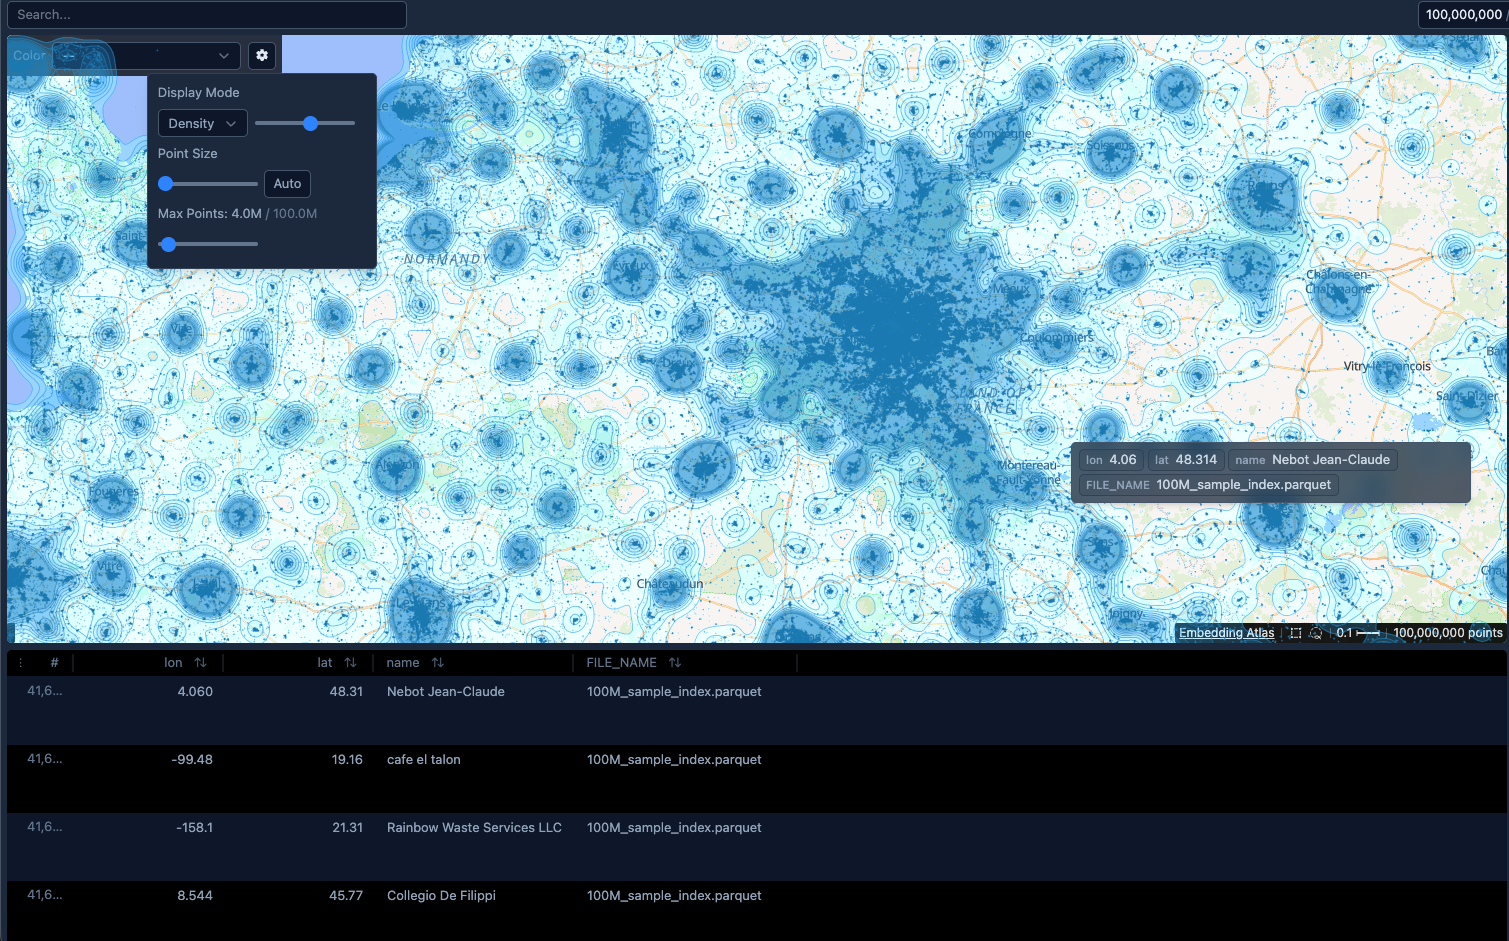
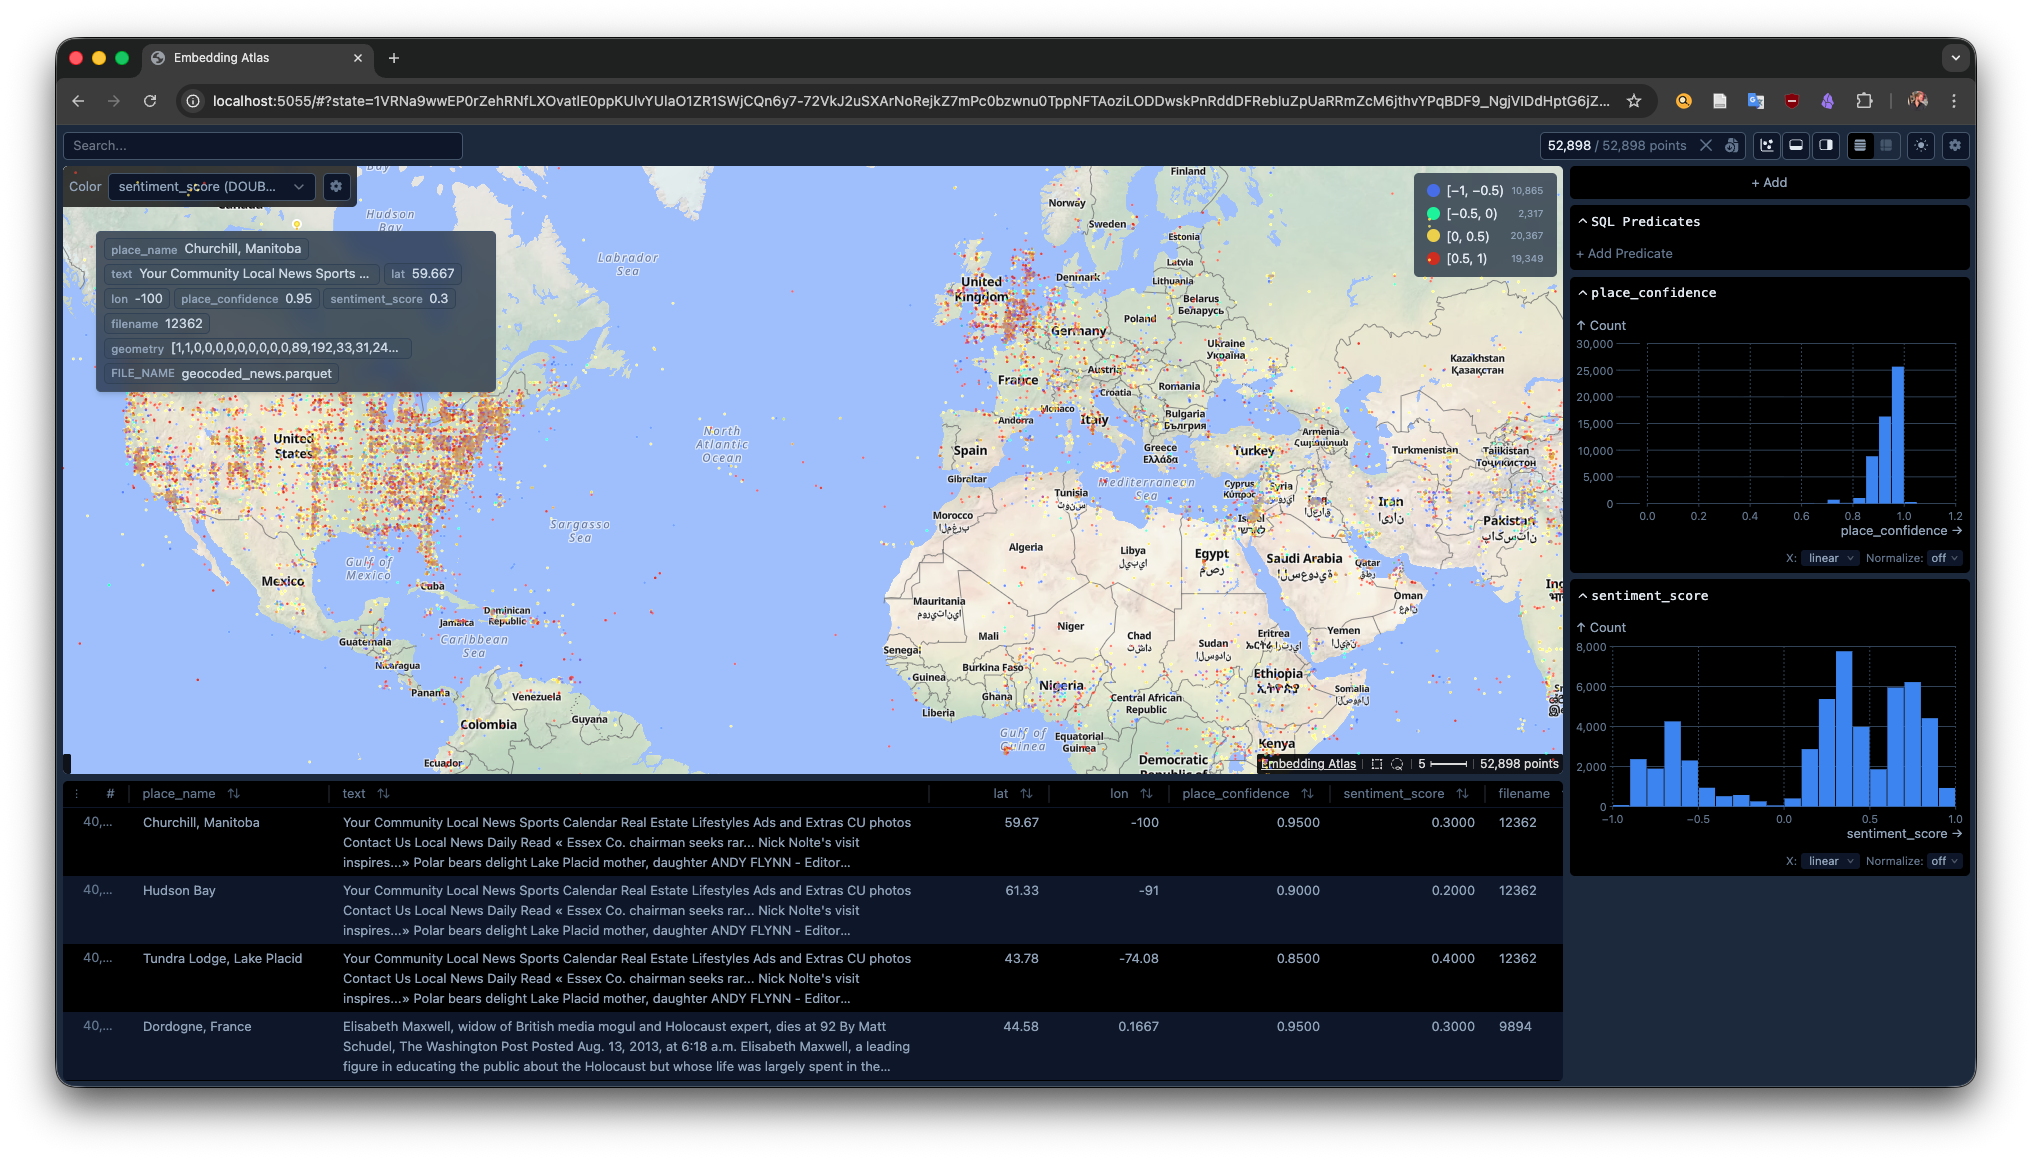
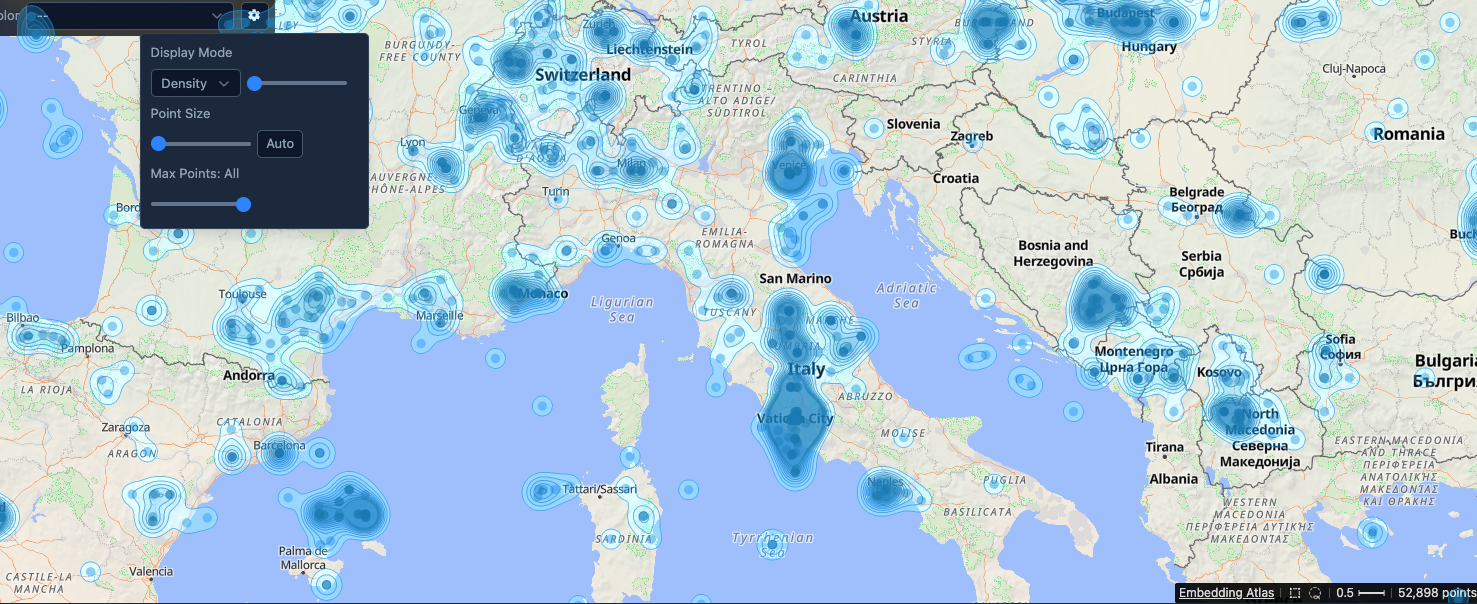
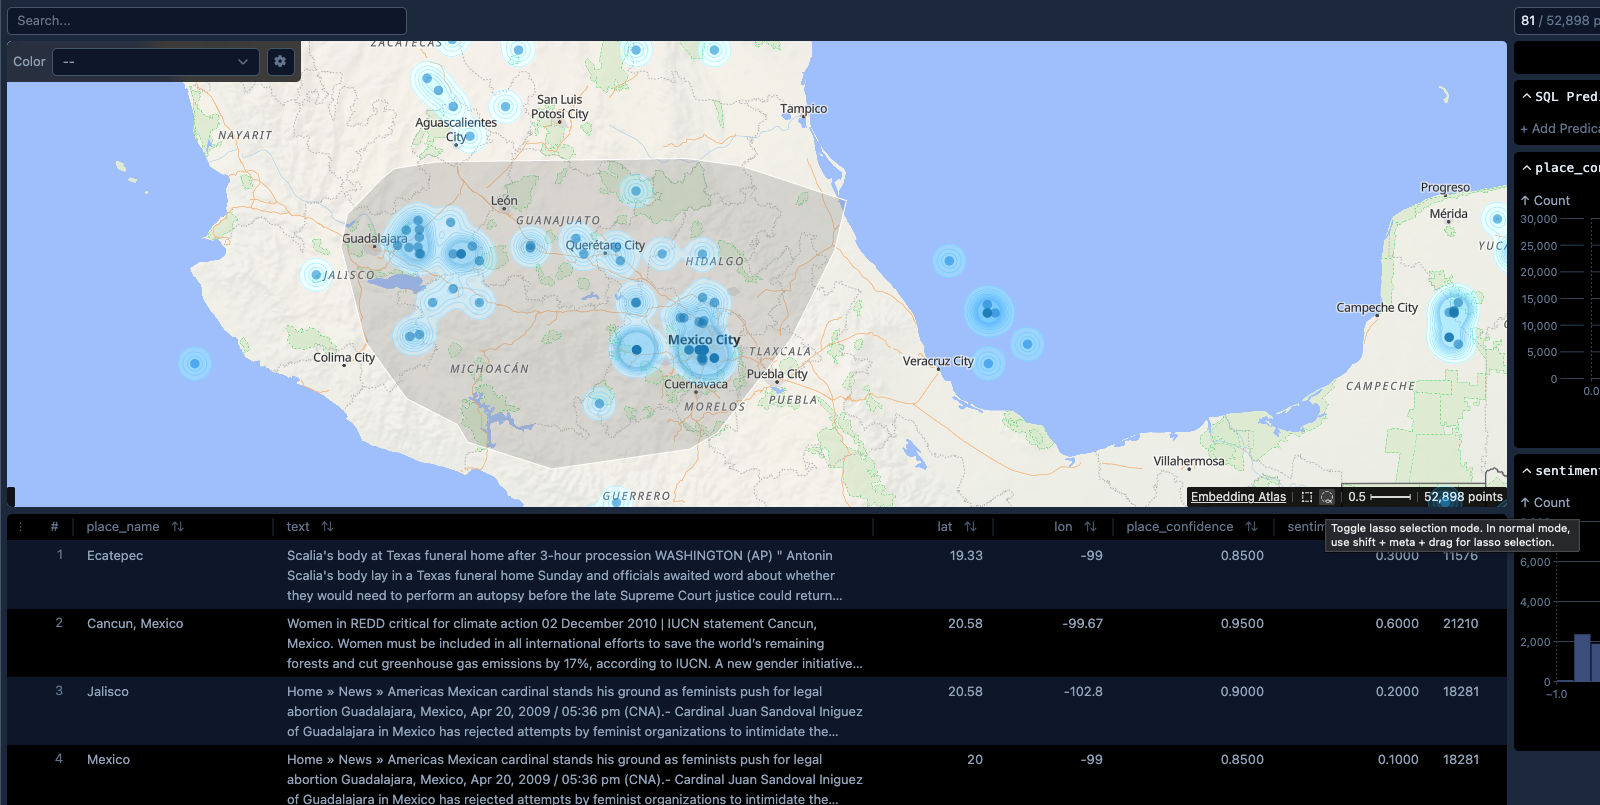
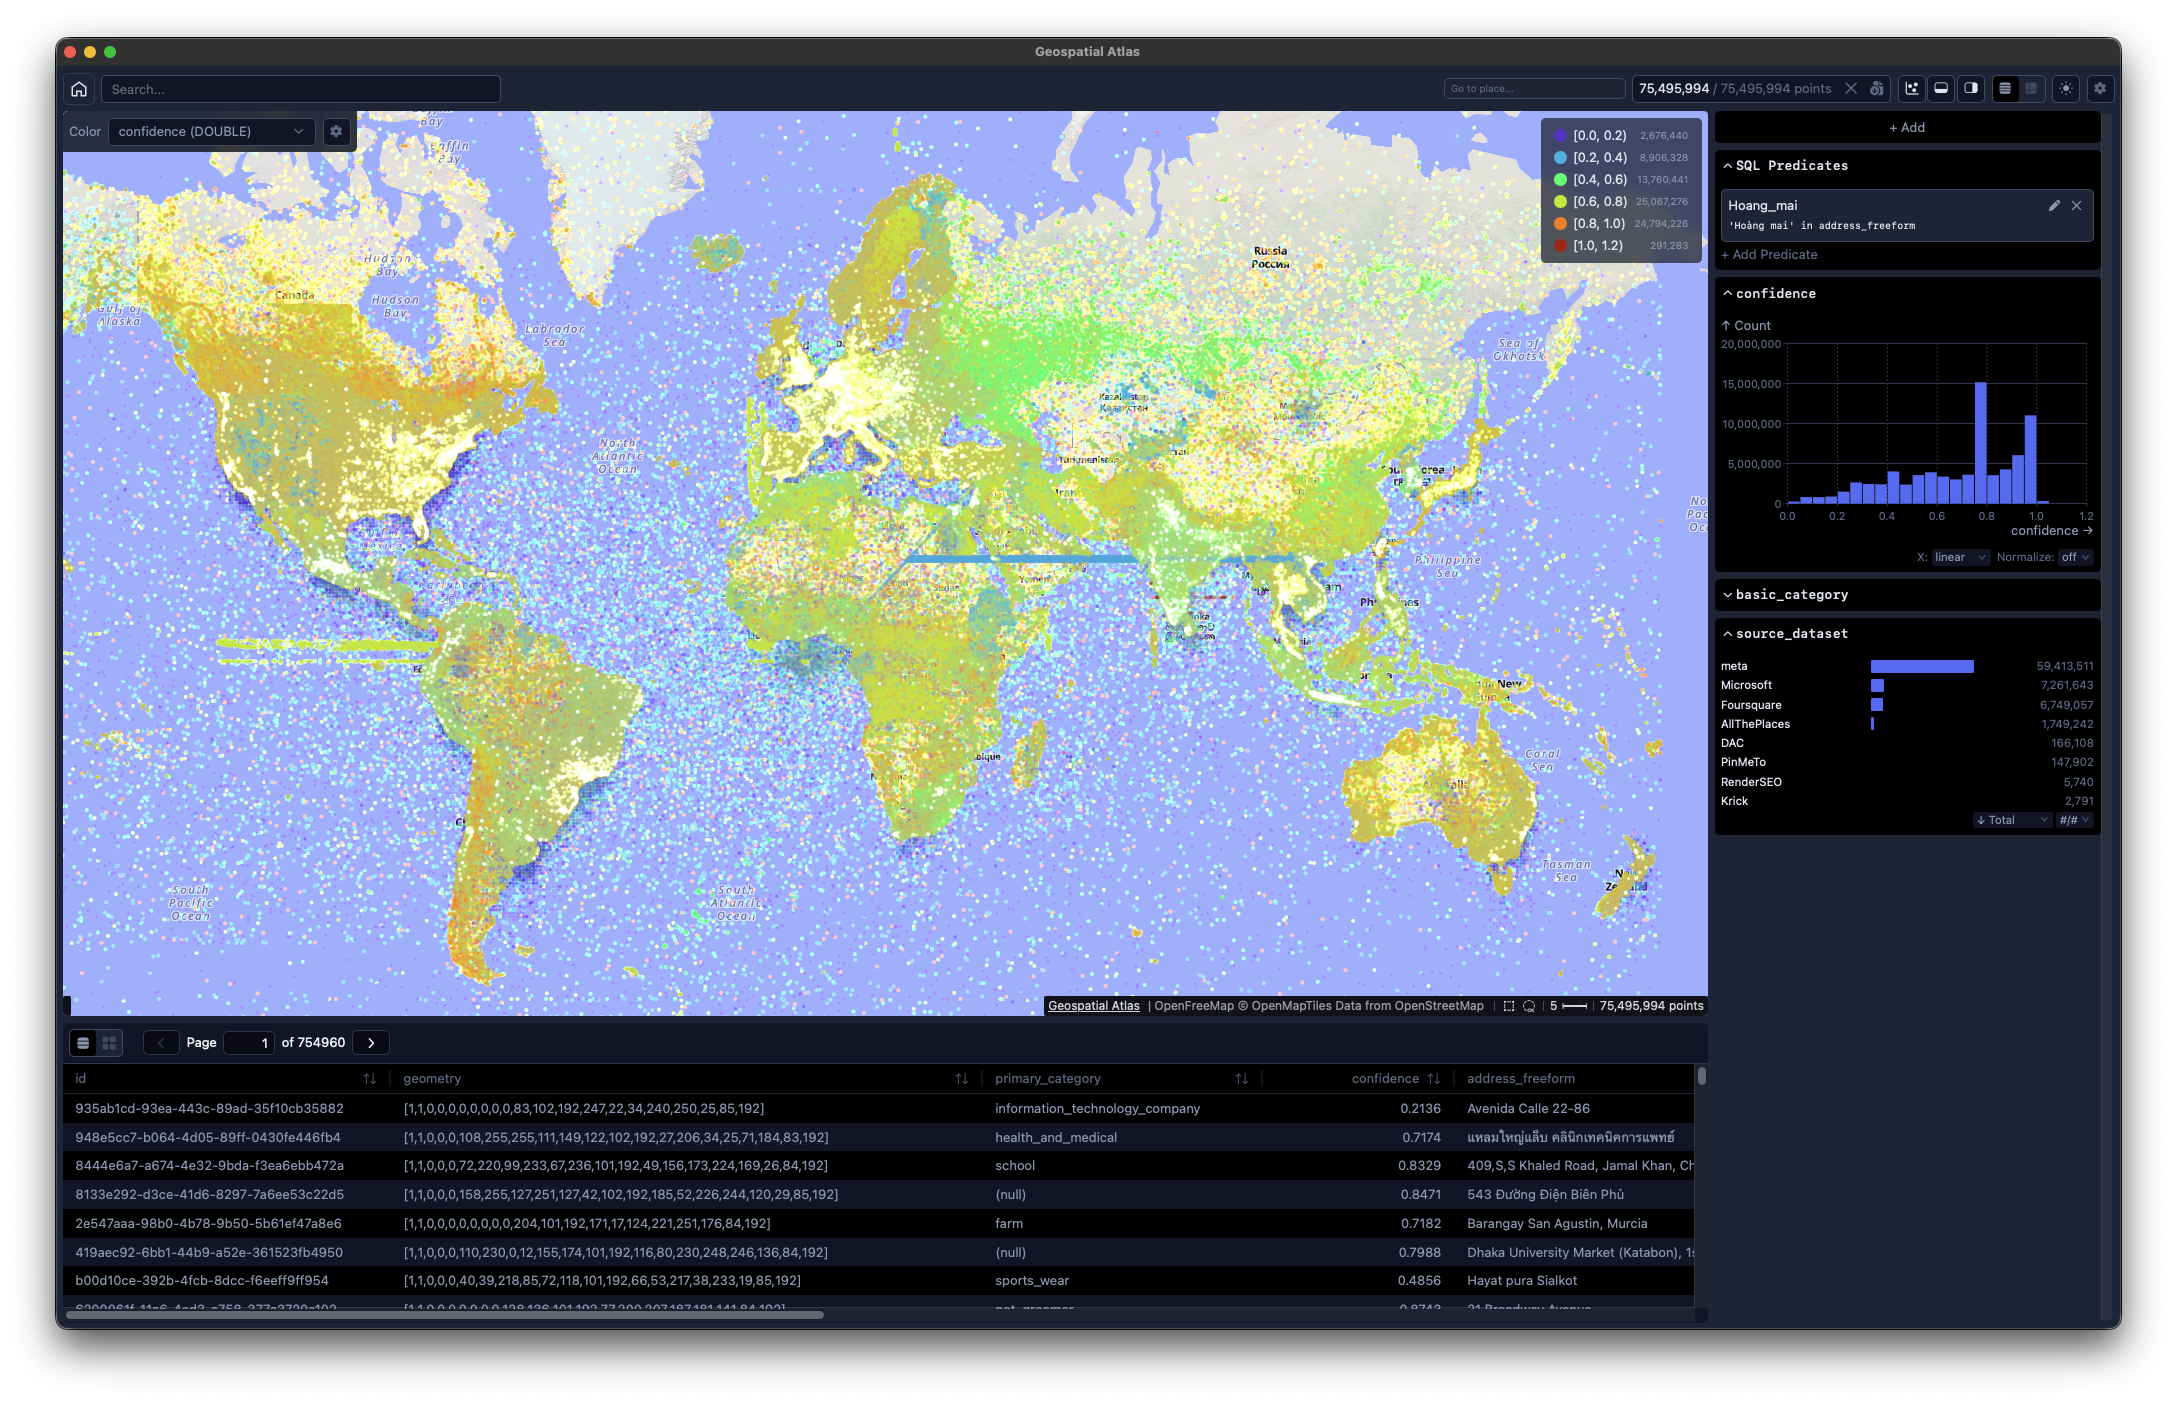
Example screenshots
Installation
git clone https://github.com/do-me/geospatial-atlas.git
cd geospatial-atlas
npm install
npm run build
Running on an Intel Mac? Then add this line to packages/backend/pyproject.toml:
required-environments = ["sys_platform == 'darwin' and platform_machine == 'x86_64'"]
For Windows, Silicon Macs and Linux everything should work out of the box.
Usage (after installation above)
Execute this command directly from the root directory of the repository. The parquet file must either contain a geometry column or lat lon / latitude longitude columns.
uv --directory packages/backend run geospatial-atlas your_dataset_with_lat_lon_coords.parquet
If you have a small dataset (<5M places) you can add the --text flag to include a text column. Your names are then indexed and searchable. For large files this might cause out-of-memory errors.
uv --directory packages/backend run geospatial-atlas your_dataset_with_lat_lon_coords.parquet --text your_name_column
Alternatively you can cd into the backend folder and run it from there:
cd packages/backend
uv run geospatial-atlas your_dataset_with_lat_lon_coords.parquet --text your_name_column
The screenshots above were created with these two datasets:
- Overture Maps Places, download with
uvx overturemaps download -f geoparquet --type=place -o places.parquet - Foursquare 100M Places, direct download
- 50k poorly geocoded news, direct download
Desktop app releases
Pre-built native apps (Electron shell + bundled Python sidecar) are on the releases page.
| Platform | File |
|---|---|
| macOS (Apple Silicon) | geospatial-atlas-macos-arm64.dmg |
| Linux x86_64 (Debian/Ubuntu) | geospatial-atlas-linux-x64.deb |
| Linux x86_64 (Fedora/RHEL) | geospatial-atlas-linux-x64.rpm |
| Windows x86_64 (MSI) | geospatial-atlas-windows-x64.msi |
| Windows x86_64 (NSIS setup) | geospatial-atlas-windows-x64-setup.exe |
Bundles are unsigned — Gatekeeper (macOS) and SmartScreen (Windows) will warn on first launch. Intel-Mac users aren't served by a pre-built bundle due to lack of runners on GitHub (11h waiting time and more); fall back to the CLI path further down.
macOS: "app is damaged and can't be opened"
That's a misleading Gatekeeper message for unsigned apps downloaded from the internet. After dragging Geospatial Atlas into Applications, strip the quarantine attribute once:
xattr -cr "/Applications/Geospatial Atlas.app"
Then double-click as usual. (Alternative: System Settings → Privacy & Security → Open Anyway after a failed launch attempt.)
Linux / Windows
sudo dpkg -i geospatial-atlas-linux-x64.deb   # Debian / Ubuntu
sudo rpm  -i geospatial-atlas-linux-x64.rpm   # Fedora / RHEL
On Windows, SmartScreen says "unrecognized publisher" — click More info → Run anyway.
Connect an LLM agent (Claude Desktop, Cursor, …)
The app (CLI and desktop, starting with v0.0.2) ships a Model Context
Protocol server at /mcp. LLM clients can drive the viewer live:
run SQL, add charts, fly to coordinates, grab screenshots of regions,
cross-filter by bounding box, and more. Full setup: docs/MCP.md.
Tool surface at a glance (31 tools):
- Data —
get_data_schema,run_sql_query - Charts —
list_charts,add_chart,delete_chart,get_chart_spec/set_chart_spec,get_chart_state/set_chart_state/clear_chart_state,get_chart_screenshot - Layout —
get_layout_type/set_layout_type,get_layout_state/set_layout_state,get_full_screenshot - Rendering —
list_renderers,get_column_styles,set_column_style - Geospatial (v0.0.2) —
get_map_viewport,fly_to_point,fly_to_bbox,get_map_screenshot,get_map_screenshot_at,select_bbox,clear_selection,count_in_bbox,find_nearby,density_grid,highlight_points,set_basemap_style
Quick start with the CLI:
uv --directory packages/backend run geospatial-atlas your.parquet --mcp
# → URL: http://localhost:5055
# → MCP server: http://localhost:5055/mcp
Open the viewer at that URL in a real browser tab (for WebGPU), then
point your LLM client's MCP config at http://localhost:5055/mcp. For
autonomous / CI use, a Playwright-based headless viewer harness lives
in scripts/mcp_harness/.
The desktop app surfaces a copyable MCP URL directly in the UI after a dataset is loaded (enabled by default, toggleable on the picker).
Client config
Most clients (Claude Desktop, Claude Code, Cursor, Continue, …) take a
JSON entry with a single url field:
{
  "mcpServers": {
    "geospatial-atlas": {
      "url": "http://localhost:5055/mcp"
    }
  }
}
Claude Desktop config file locations:
| OS | Path |
|---|---|
| macOS | ~/Library/Application Support/Claude/claude_desktop_config.json |
| Windows | %APPDATA%\Claude\claude_desktop_config.json |
| Linux | ~/.config/Claude/claude_desktop_config.json |
Fully quit and reopen the client — the 31 tools above should appear in the tool picker. Swap the port if the server picked a different one (the URL banner prints the actual port on launch).
Build & Deploy GitHub Pages
The static web app is deployed manually (no CI). To rebuild and deploy:
# 1. Install dependencies (first time only)
npm install

# 2. Build all packages (utils, component, table, viewer, docs)
npm run build

# 3. Deploy the built site to the gh-pages branch
./scripts/deploy-gh-pages.sh
Then in GitHub → Settings → Pages, set the source to the gh-pages branch (root /).
The live site is available at: https://do-me.github.io/geospatial-atlas/
Testing
End-to-end tests use Playwright and cover both runtime modes (server mode with Python backend, and frontend-only mode with Vite dev server + DuckDB WASM).
Prerequisites:
npm run build              # server-mode tests need the built viewer
npx playwright install chromium
On first run the test suite auto-downloads a ~29 MB parquet fixture (GISCO Education) and caches it in e2e/.data/ (git-ignored). Override with E2E_PARQUET_FILE=/path/to/file.parquet if needed.
Run all tests:
npx playwright test
Run a single mode:
npx playwright test --project server-mode
npx playwright test --project frontend-mode
View the HTML report (generated on every run):
npx playwright show-report e2e/playwright-report
Test artifacts (traces, screenshots on failure, HTML report) are written to e2e/test-results/ and e2e/playwright-report/ — both git-ignored.
Test structure
e2e/
├── helpers.ts                # Auto-download, server lifecycle, page helpers
├── server-mode.spec.ts       # Full-stack: Python backend + pre-built viewer
│   ├── API                   #   Metadata endpoint, DuckDB query
│   ├── Rendering             #   Scatter canvas, MapLibre basemap, sidebar
│   ├── Basemap Alignment     #   Mercator formula, point-vs-map consistency
│   ├── Interaction           #   Scroll-to-zoom
│   └── Zoom Drift            #   Scatter-vs-map pixel alignment across zoom levels
└── frontend-mode.spec.ts     # Browser-only: Vite dev server + DuckDB WASM
    ├── File Upload           #   Drop zone, parquet upload transition
    └── Test Data Viewer      #   Synthetic data scatter, UI controls
Performance
Headline numbers per distribution:
| Distro | Verified ceiling | Notes |
|---|---|---|
| Desktop (Electron) | 322 M points | M-series, 32 GB unified memory. V8 budget tuned to 16 GB; full feature surface. |
| Backend-frontend / browser | ~100 M points (without flags) | 322 M reachable in Chrome with --js-flags="--max-old-space-size=16384 --expose-gc". |
| Standalone web (DuckDB-WASM) | ~75 M points (estimated) | DuckDB-WASM 2 GB internal cap dominates; not measured at higher scale. |
Filter and tooltip latency at 322 M: ~3 s perceived between filter click and painted pixel; ~50 ms tooltip pick. Cold load (parquet → first frame) at 322 M: ~12–15 s.
The two deep-dives are kept under docs/:
docs/optimization_history.md— the 322 M scaling chapter. Memory pipeline, Mosaic LRU pinning, Metal watchdog, multi-distro compatibility matrix, current bottleneck, open follow-ups.docs/PERF-75M.md— the prior 75 M chapter. Compaction + indirect draw, gesture-only downsample, workgroup-size sweep.
Troubleshooting
Array buffer allocation failed / blank canvas at >100 M points
The renderer's V8 heap budget is exhausted. The desktop app is auto- tuned to 16 GB; a vanilla browser tab is ~4 GB.
- Easiest path: use the desktop app.
- Browser fallback: launch Chrome with elevated V8 flags.
# macOS /Applications/Google\ Chrome.app/Contents/MacOS/Google\ Chrome \ --js-flags="--max-old-space-size=16384 --expose-gc" \ http://localhost:5055 # Linux google-chrome --js-flags="--max-old-space-size=16384 --expose-gc" \ http://localhost:5055 - Or reduce the working set (SQL filter,
--sample, smaller column set).
Canvas freezes mid-pan on macOS, recovers only on reload
Metal's 5 s MTLCommandBuffer watchdog killed a draw pass. We chunk
dispatches to stay under the limit, but tabs stalled by DevTools or
extreme background load can re-trip it. Reload the page; the underlying
data and view state are preserved in the URL.
Empty map after switching datasets in the desktop app
viewer-state.json retains per-dataset precomputed-column metadata; if
the same parquet is reloaded with a different schema the stale entry
wins. Quit the app, then on macOS:
rm "$HOME/Library/Application Support/Geospatial Atlas/viewer-state.json"
(Equivalent path under %APPDATA% on Windows, $XDG_CONFIG_HOME on
Linux.) Relaunch.
Disk fills up after running the CLI on a huge parquet
DuckDB spills to $TMPDIR/duckdb_gsa_*. Sessions on builds that
predate the auto-cleanup landing may have left 80–120 GB dirs behind.
Sweep manually:
rm -rf "$TMPDIR"/duckdb_gsa_*
Recent builds clean their own temp dir on shutdown and sweep stale orphans (>24 h) on startup; no manual action needed.
Roadmap & known limitations
The list below distinguishes deferred work that has been measured
(numbers from the optimization doc) from generic feature requests.
PRs welcome on any of them; cross-link to the relevant section of
docs/optimization_history.md in the PR description.
Renderer / front-end
- Move Arrow
Vector.toArray()off the main thread. At 322 M with the category column it's ~1.8 s blocking — currently the longest blocking JS phase per filter click. - Stream-decode the wire directly into pre-allocated typed arrays.
Skips the intermediate Arrow Table and lowers peak heap below 4 GB
so vanilla Chrome works at 322 M without
--js-flags. EmbeddingViewImpl.svelte:368should declarelet renderer = $state.raw(null)rather than$state(null). The reactive Source proxy adds a duplicate retainer chain visible in heap snapshots; ~50 MB overhead at long- session steady state.device.lostrecovery UX. A Metal watchdog trip currently leaves the canvas blank with no affordance. Surface a "GPU recovered — click to re-render" banner.- GPU buffer pool: every filter click destroys ~3 GB of GPU buffers and reallocates ~3 GB. A 2-slot ring per logical buffer would let the new allocation reuse the old storage.
Loader / sidecar
- Cold-init profile at 322 M (~12–15 s end-to-end). The split between parquet footer scan and prewarm is unmeasured.
- Clamp Electron's 16 GB V8 budget to
min(16 GB, totalmem * 0.5)so 16 GB-RAM machines don't risk OS-level OOM-killer events.
Distros
- DuckDB-WASM end-to-end at 200–300 M parquet (standalone web). Untested.
- Selection (lasso / box) at 322 M. Untested; may stress the same
toArray()path. - Intel Mac desktop bundle. Currently no GitHub runner; users fall back to the CLI path.
UX (from the prior backlog)
- Disallow zoom-out below z = 0 (current shifting artefact).
- Adapt density and point-radius ranges across zoom levels.
- Basemap attribution.
- Standalone
geospatial-atlasPyPI package.
Original Embedding Atlas Readme




Embedding Atlas is a tool that provides interactive visualizations for large embeddings and their metadata. You can visualize, cross-filter, and search across your data.
For embeddings
-
🏷️ Automatic data clustering & labeling: Interactively visualize and navigate overall data structure.
-
🫧 Kernel density estimation & density contours: Easily explore and distinguish between dense regions of data and outliers.
-
🧊 Order-independent transparency: Ensure clear, accurate rendering of overlapping points.
-
🔍 Real-time search & nearest neighbors: Find similar data to a given query or existing data point.
-
🚀 Smooth performance at scale: Up to a few million points, powered by WebGPU.
For any tabular data
-
📊 Linked dashboards & cross-filtering: Standard chart types (bar, line, bubble, count plot, eCDF) plus a composable chart spec for building custom charts like heatmaps and average-line overlays. Charts can be configured to cross-filter.
-
🧩 Multimodal data support: Built-in viewers for text, image, audio, numeric, categorical, and time columns.
-
🤖 AI agent access via MCP: AI agents can query the schema, run SQL, create charts, and capture screenshots via Model Context Protocol.
Please visit https://apple.github.io/embedding-atlas for a demo and documentation.

Get started
To use Embedding Atlas with Python:
pip install embedding-atlas

embedding-atlas <your-dataset>
In addition to the command line tool, Embedding Atlas is available as a Python Notebook (e.g., Jupyter) widget:
from embedding_atlas.widget import EmbeddingAtlasWidget

# Show the Embedding Atlas widget for your data frame:
EmbeddingAtlasWidget(df)
Finally, components from Embedding Atlas are also available in an npm package:
npm install embedding-atlas
import { EmbeddingAtlas, EmbeddingView } from "embedding-atlas";

// or with React:
import { EmbeddingAtlas, EmbeddingView } from "embedding-atlas/react";

// or Svelte:
import { EmbeddingAtlas, EmbeddingView } from "embedding-atlas/svelte";
For more information, please visit https://apple.github.io/embedding-atlas/overview.html.
BibTeX
For the Embedding Atlas tool:
@misc{ren2025embedding,
  title={Embedding Atlas: Low-Friction, Interactive Embedding Visualization},
  author={Donghao Ren and Fred Hohman and Halden Lin and Dominik Moritz},
  year={2025},
  eprint={2505.06386},
  archivePrefix={arXiv},
  primaryClass={cs.HC},
  url={https://arxiv.org/abs/2505.06386},
}
For the algorithm that automatically produces clusters and labels in the embedding view:
@misc{ren2025scalable,
  title={A Scalable Approach to Clustering Embedding Projections},
  author={Donghao Ren and Fred Hohman and Dominik Moritz},
  year={2025},
  eprint={2504.07285},
  archivePrefix={arXiv},
  primaryClass={cs.HC},
  url={https://arxiv.org/abs/2504.07285},
}
For sensemaking on UMAP's internal kNN graph:
@misc{chau2026dimensionality,
  title={Dimensionality Reduction Meets Network Science: Sensemaking on UMAP's kNN Graph},
  author={Duen Horng Chau and Donghao Ren and Fred Hohman and Dominik Moritz},
  year={2026},
  eprint={2607.08746},
  archivePrefix={arXiv},
  primaryClass={cs.HC},
  url={https://arxiv.org/abs/2607.08746},
}
Development
For development instructions, please visit https://apple.github.io/embedding-atlas/develop.html, or check out packages/docs/develop.md.
License
This code is released under the MIT license.
Contributors


Similar repos





Languages
TypeScript
41.6%
Svelte
18.5%
Rust
16.8%
Python
16.3%
JavaScript
4.1%
WGSL
1.7%
Interactive visualization for large geospatial point datasets
See the codeREADME
Geospatial Atlas
This is a fork of Embedding Atlas adapted for geospatial data. As embeddings or rather their 2D projections share the exact same visualization challenges like 2D geospatial data, Embedding Atlas and all its functionality serve a great deal in geospatial data exploration!
Verified at 322 M points in the desktop app on a 32 GB Apple Silicon laptop, ~100 M in a vanilla browser tab (Chrome / Safari / Firefox-with-flag). For the full optimization journey see docs/optimization_history.md and docs/PERF-75M.md. Browser-side scale ceilings and the V8-flag workaround for the 322 M case are documented in Troubleshooting below.
Find various example apps here. Try for example the 6M GlobalGeoTree explorer! Load your own data (up to around 6M points) here: https://do-me.github.io/geospatial-atlas/app/!
You can load the data from a remote URL too! Clicking this link, you download 100Mb of geolocated Wikipedia articles: https://do-me.github.io/geospatial-atlas/app/#?data=https://pub-016504dd3a4d419a9c17a8939840935e.r2.dev/v1/wikipedia_geotagged.parquet
LinkedIn Post for more context
Desktop App Download
All links below resolve to the latest tagged release. See the CHANGELOG for what's in each version. All bundles are unsigned, so every platform needs a one-off bypass step after install — shown per-row below.
- Windows (MSI) — geospatial-atlas-windows-x64.msi Double-click; on the SmartScreen warning click More info → Run anyway.
- Windows (NSIS setup) — geospatial-atlas-windows-x64-setup.exe Double-click; same More info → Run anyway SmartScreen step.
- macOS (Apple Silicon) — geospatial-atlas-macos-arm64.dmg
Open the dmg, drag to
/Applications, then strip the Gatekeeper quarantine flag once:xattr -cr "/Applications/Geospatial Atlas.app" - 🐧 Linux (Debian / Ubuntu) — geospatial-atlas-linux-x64.deb
sudo dpkg -i geospatial-atlas-linux-x64.deb - 🐧 Linux (Fedora / RHEL) — geospatial-atlas-linux-x64.rpm
sudo rpm -i geospatial-atlas-linux-x64.rpm
More background in Desktop app releases below.
Example screenshots
Installation
git clone https://github.com/do-me/geospatial-atlas.git
cd geospatial-atlas
npm install
npm run build
Running on an Intel Mac? Then add this line to packages/backend/pyproject.toml:
required-environments = ["sys_platform == 'darwin' and platform_machine == 'x86_64'"]
For Windows, Silicon Macs and Linux everything should work out of the box.
Usage (after installation above)
Execute this command directly from the root directory of the repository. The parquet file must either contain a geometry column or lat lon / latitude longitude columns.
uv --directory packages/backend run geospatial-atlas your_dataset_with_lat_lon_coords.parquet
If you have a small dataset (<5M places) you can add the --text flag to include a text column. Your names are then indexed and searchable. For large files this might cause out-of-memory errors.
uv --directory packages/backend run geospatial-atlas your_dataset_with_lat_lon_coords.parquet --text your_name_column
Alternatively you can cd into the backend folder and run it from there:
cd packages/backend
uv run geospatial-atlas your_dataset_with_lat_lon_coords.parquet --text your_name_column
The screenshots above were created with these two datasets:
- Overture Maps Places, download with
uvx overturemaps download -f geoparquet --type=place -o places.parquet - Foursquare 100M Places, direct download
- 50k poorly geocoded news, direct download
Desktop app releases
Pre-built native apps (Electron shell + bundled Python sidecar) are on the releases page.
| Platform | File |
|---|---|
| macOS (Apple Silicon) | geospatial-atlas-macos-arm64.dmg |
| Linux x86_64 (Debian/Ubuntu) | geospatial-atlas-linux-x64.deb |
| Linux x86_64 (Fedora/RHEL) | geospatial-atlas-linux-x64.rpm |
| Windows x86_64 (MSI) | geospatial-atlas-windows-x64.msi |
| Windows x86_64 (NSIS setup) | geospatial-atlas-windows-x64-setup.exe |
Bundles are unsigned — Gatekeeper (macOS) and SmartScreen (Windows) will warn on first launch. Intel-Mac users aren't served by a pre-built bundle due to lack of runners on GitHub (11h waiting time and more); fall back to the CLI path further down.
macOS: "app is damaged and can't be opened"
That's a misleading Gatekeeper message for unsigned apps downloaded from the internet. After dragging Geospatial Atlas into Applications, strip the quarantine attribute once:
xattr -cr "/Applications/Geospatial Atlas.app"
Then double-click as usual. (Alternative: System Settings → Privacy & Security → Open Anyway after a failed launch attempt.)
Linux / Windows
sudo dpkg -i geospatial-atlas-linux-x64.deb   # Debian / Ubuntu
sudo rpm  -i geospatial-atlas-linux-x64.rpm   # Fedora / RHEL
On Windows, SmartScreen says "unrecognized publisher" — click More info → Run anyway.
Connect an LLM agent (Claude Desktop, Cursor, …)
The app (CLI and desktop, starting with v0.0.2) ships a Model Context
Protocol server at /mcp. LLM clients can drive the viewer live:
run SQL, add charts, fly to coordinates, grab screenshots of regions,
cross-filter by bounding box, and more. Full setup: docs/MCP.md.
Tool surface at a glance (31 tools):
- Data —
get_data_schema,run_sql_query - Charts —
list_charts,add_chart,delete_chart,get_chart_spec/set_chart_spec,get_chart_state/set_chart_state/clear_chart_state,get_chart_screenshot - Layout —
get_layout_type/set_layout_type,get_layout_state/set_layout_state,get_full_screenshot - Rendering —
list_renderers,get_column_styles,set_column_style - Geospatial (v0.0.2) —
get_map_viewport,fly_to_point,fly_to_bbox,get_map_screenshot,get_map_screenshot_at,select_bbox,clear_selection,count_in_bbox,find_nearby,density_grid,highlight_points,set_basemap_style
Quick start with the CLI:
uv --directory packages/backend run geospatial-atlas your.parquet --mcp
# → URL: http://localhost:5055
# → MCP server: http://localhost:5055/mcp
Open the viewer at that URL in a real browser tab (for WebGPU), then
point your LLM client's MCP config at http://localhost:5055/mcp. For
autonomous / CI use, a Playwright-based headless viewer harness lives
in scripts/mcp_harness/.
The desktop app surfaces a copyable MCP URL directly in the UI after a dataset is loaded (enabled by default, toggleable on the picker).
Client config
Most clients (Claude Desktop, Claude Code, Cursor, Continue, …) take a
JSON entry with a single url field:
{
  "mcpServers": {
    "geospatial-atlas": {
      "url": "http://localhost:5055/mcp"
    }
  }
}
Claude Desktop config file locations:
| OS | Path |
|---|---|
| macOS | ~/Library/Application Support/Claude/claude_desktop_config.json |
| Windows | %APPDATA%\Claude\claude_desktop_config.json |
| Linux | ~/.config/Claude/claude_desktop_config.json |
Fully quit and reopen the client — the 31 tools above should appear in the tool picker. Swap the port if the server picked a different one (the URL banner prints the actual port on launch).
Build & Deploy GitHub Pages
The static web app is deployed manually (no CI). To rebuild and deploy:
# 1. Install dependencies (first time only)
npm install

# 2. Build all packages (utils, component, table, viewer, docs)
npm run build

# 3. Deploy the built site to the gh-pages branch
./scripts/deploy-gh-pages.sh
Then in GitHub → Settings → Pages, set the source to the gh-pages branch (root /).
The live site is available at: https://do-me.github.io/geospatial-atlas/
Testing
End-to-end tests use Playwright and cover both runtime modes (server mode with Python backend, and frontend-only mode with Vite dev server + DuckDB WASM).
Prerequisites:
npm run build              # server-mode tests need the built viewer
npx playwright install chromium
On first run the test suite auto-downloads a ~29 MB parquet fixture (GISCO Education) and caches it in e2e/.data/ (git-ignored). Override with E2E_PARQUET_FILE=/path/to/file.parquet if needed.
Run all tests:
npx playwright test
Run a single mode:
npx playwright test --project server-mode
npx playwright test --project frontend-mode
View the HTML report (generated on every run):
npx playwright show-report e2e/playwright-report
Test artifacts (traces, screenshots on failure, HTML report) are written to e2e/test-results/ and e2e/playwright-report/ — both git-ignored.
Test structure
e2e/
├── helpers.ts                # Auto-download, server lifecycle, page helpers
├── server-mode.spec.ts       # Full-stack: Python backend + pre-built viewer
│   ├── API                   #   Metadata endpoint, DuckDB query
│   ├── Rendering             #   Scatter canvas, MapLibre basemap, sidebar
│   ├── Basemap Alignment     #   Mercator formula, point-vs-map consistency
│   ├── Interaction           #   Scroll-to-zoom
│   └── Zoom Drift            #   Scatter-vs-map pixel alignment across zoom levels
└── frontend-mode.spec.ts     # Browser-only: Vite dev server + DuckDB WASM
    ├── File Upload           #   Drop zone, parquet upload transition
    └── Test Data Viewer      #   Synthetic data scatter, UI controls
Performance
Headline numbers per distribution:
| Distro | Verified ceiling | Notes |
|---|---|---|
| Desktop (Electron) | 322 M points | M-series, 32 GB unified memory. V8 budget tuned to 16 GB; full feature surface. |
| Backend-frontend / browser | ~100 M points (without flags) | 322 M reachable in Chrome with --js-flags="--max-old-space-size=16384 --expose-gc". |
| Standalone web (DuckDB-WASM) | ~75 M points (estimated) | DuckDB-WASM 2 GB internal cap dominates; not measured at higher scale. |
Filter and tooltip latency at 322 M: ~3 s perceived between filter click and painted pixel; ~50 ms tooltip pick. Cold load (parquet → first frame) at 322 M: ~12–15 s.
The two deep-dives are kept under docs/:
docs/optimization_history.md— the 322 M scaling chapter. Memory pipeline, Mosaic LRU pinning, Metal watchdog, multi-distro compatibility matrix, current bottleneck, open follow-ups.docs/PERF-75M.md— the prior 75 M chapter. Compaction + indirect draw, gesture-only downsample, workgroup-size sweep.
Troubleshooting
Array buffer allocation failed / blank canvas at >100 M points
The renderer's V8 heap budget is exhausted. The desktop app is auto- tuned to 16 GB; a vanilla browser tab is ~4 GB.
- Easiest path: use the desktop app.
- Browser fallback: launch Chrome with elevated V8 flags.
# macOS /Applications/Google\ Chrome.app/Contents/MacOS/Google\ Chrome \ --js-flags="--max-old-space-size=16384 --expose-gc" \ http://localhost:5055 # Linux google-chrome --js-flags="--max-old-space-size=16384 --expose-gc" \ http://localhost:5055 - Or reduce the working set (SQL filter,
--sample, smaller column set).
Canvas freezes mid-pan on macOS, recovers only on reload
Metal's 5 s MTLCommandBuffer watchdog killed a draw pass. We chunk
dispatches to stay under the limit, but tabs stalled by DevTools or
extreme background load can re-trip it. Reload the page; the underlying
data and view state are preserved in the URL.
Empty map after switching datasets in the desktop app
viewer-state.json retains per-dataset precomputed-column metadata; if
the same parquet is reloaded with a different schema the stale entry
wins. Quit the app, then on macOS:
rm "$HOME/Library/Application Support/Geospatial Atlas/viewer-state.json"
(Equivalent path under %APPDATA% on Windows, $XDG_CONFIG_HOME on
Linux.) Relaunch.
Disk fills up after running the CLI on a huge parquet
DuckDB spills to $TMPDIR/duckdb_gsa_*. Sessions on builds that
predate the auto-cleanup landing may have left 80–120 GB dirs behind.
Sweep manually:
rm -rf "$TMPDIR"/duckdb_gsa_*
Recent builds clean their own temp dir on shutdown and sweep stale orphans (>24 h) on startup; no manual action needed.
Roadmap & known limitations
The list below distinguishes deferred work that has been measured
(numbers from the optimization doc) from generic feature requests.
PRs welcome on any of them; cross-link to the relevant section of
docs/optimization_history.md in the PR description.
Renderer / front-end
- Move Arrow
Vector.toArray()off the main thread. At 322 M with the category column it's ~1.8 s blocking — currently the longest blocking JS phase per filter click. - Stream-decode the wire directly into pre-allocated typed arrays.
Skips the intermediate Arrow Table and lowers peak heap below 4 GB
so vanilla Chrome works at 322 M without
--js-flags. EmbeddingViewImpl.svelte:368should declarelet renderer = $state.raw(null)rather than$state(null). The reactive Source proxy adds a duplicate retainer chain visible in heap snapshots; ~50 MB overhead at long- session steady state.device.lostrecovery UX. A Metal watchdog trip currently leaves the canvas blank with no affordance. Surface a "GPU recovered — click to re-render" banner.- GPU buffer pool: every filter click destroys ~3 GB of GPU buffers and reallocates ~3 GB. A 2-slot ring per logical buffer would let the new allocation reuse the old storage.
Loader / sidecar
- Cold-init profile at 322 M (~12–15 s end-to-end). The split between parquet footer scan and prewarm is unmeasured.
- Clamp Electron's 16 GB V8 budget to
min(16 GB, totalmem * 0.5)so 16 GB-RAM machines don't risk OS-level OOM-killer events.
Distros
- DuckDB-WASM end-to-end at 200–300 M parquet (standalone web). Untested.
- Selection (lasso / box) at 322 M. Untested; may stress the same
toArray()path. - Intel Mac desktop bundle. Currently no GitHub runner; users fall back to the CLI path.
UX (from the prior backlog)
- Disallow zoom-out below z = 0 (current shifting artefact).
- Adapt density and point-radius ranges across zoom levels.
- Basemap attribution.
- Standalone
geospatial-atlasPyPI package.
Original Embedding Atlas Readme
Embedding Atlas is a tool that provides interactive visualizations for large embeddings and their metadata. You can visualize, cross-filter, and search across your data.
For embeddings
-
🏷️ Automatic data clustering & labeling: Interactively visualize and navigate overall data structure.
-
🫧 Kernel density estimation & density contours: Easily explore and distinguish between dense regions of data and outliers.
-
🧊 Order-independent transparency: Ensure clear, accurate rendering of overlapping points.
-
🔍 Real-time search & nearest neighbors: Find similar data to a given query or existing data point.
-
🚀 Smooth performance at scale: Up to a few million points, powered by WebGPU.
For any tabular data
-
📊 Linked dashboards & cross-filtering: Standard chart types (bar, line, bubble, count plot, eCDF) plus a composable chart spec for building custom charts like heatmaps and average-line overlays. Charts can be configured to cross-filter.
-
🧩 Multimodal data support: Built-in viewers for text, image, audio, numeric, categorical, and time columns.
-
🤖 AI agent access via MCP: AI agents can query the schema, run SQL, create charts, and capture screenshots via Model Context Protocol.
Please visit https://apple.github.io/embedding-atlas for a demo and documentation.
Get started
To use Embedding Atlas with Python:
pip install embedding-atlas

embedding-atlas <your-dataset>
In addition to the command line tool, Embedding Atlas is available as a Python Notebook (e.g., Jupyter) widget:
from embedding_atlas.widget import EmbeddingAtlasWidget

# Show the Embedding Atlas widget for your data frame:
EmbeddingAtlasWidget(df)
Finally, components from Embedding Atlas are also available in an npm package:
npm install embedding-atlas
import { EmbeddingAtlas, EmbeddingView } from "embedding-atlas";

// or with React:
import { EmbeddingAtlas, EmbeddingView } from "embedding-atlas/react";

// or Svelte:
import { EmbeddingAtlas, EmbeddingView } from "embedding-atlas/svelte";
For more information, please visit https://apple.github.io/embedding-atlas/overview.html.
BibTeX
For the Embedding Atlas tool:
@misc{ren2025embedding,
  title={Embedding Atlas: Low-Friction, Interactive Embedding Visualization},
  author={Donghao Ren and Fred Hohman and Halden Lin and Dominik Moritz},
  year={2025},
  eprint={2505.06386},
  archivePrefix={arXiv},
  primaryClass={cs.HC},
  url={https://arxiv.org/abs/2505.06386},
}
For the algorithm that automatically produces clusters and labels in the embedding view:
@misc{ren2025scalable,
  title={A Scalable Approach to Clustering Embedding Projections},
  author={Donghao Ren and Fred Hohman and Dominik Moritz},
  year={2025},
  eprint={2504.07285},
  archivePrefix={arXiv},
  primaryClass={cs.HC},
  url={https://arxiv.org/abs/2504.07285},
}
For sensemaking on UMAP's internal kNN graph:
@misc{chau2026dimensionality,
  title={Dimensionality Reduction Meets Network Science: Sensemaking on UMAP's kNN Graph},
  author={Duen Horng Chau and Donghao Ren and Fred Hohman and Dominik Moritz},
  year={2026},
  eprint={2607.08746},
  archivePrefix={arXiv},
  primaryClass={cs.HC},
  url={https://arxiv.org/abs/2607.08746},
}
Development
For development instructions, please visit https://apple.github.io/embedding-atlas/develop.html, or check out packages/docs/develop.md.
License
This code is released under the MIT license.
Similar repos
Contributors
Languages
TypeScript
41.6%
Svelte
18.5%
Rust
16.8%
Python
16.3%
JavaScript
4.1%
WGSL
1.7%