
Free, local-first drag-and-drop dashboard builder — Observable Plot charts, in-browser SQL, one-click HTML export
See the codeSee what people are saying
README
Dashboard Builder
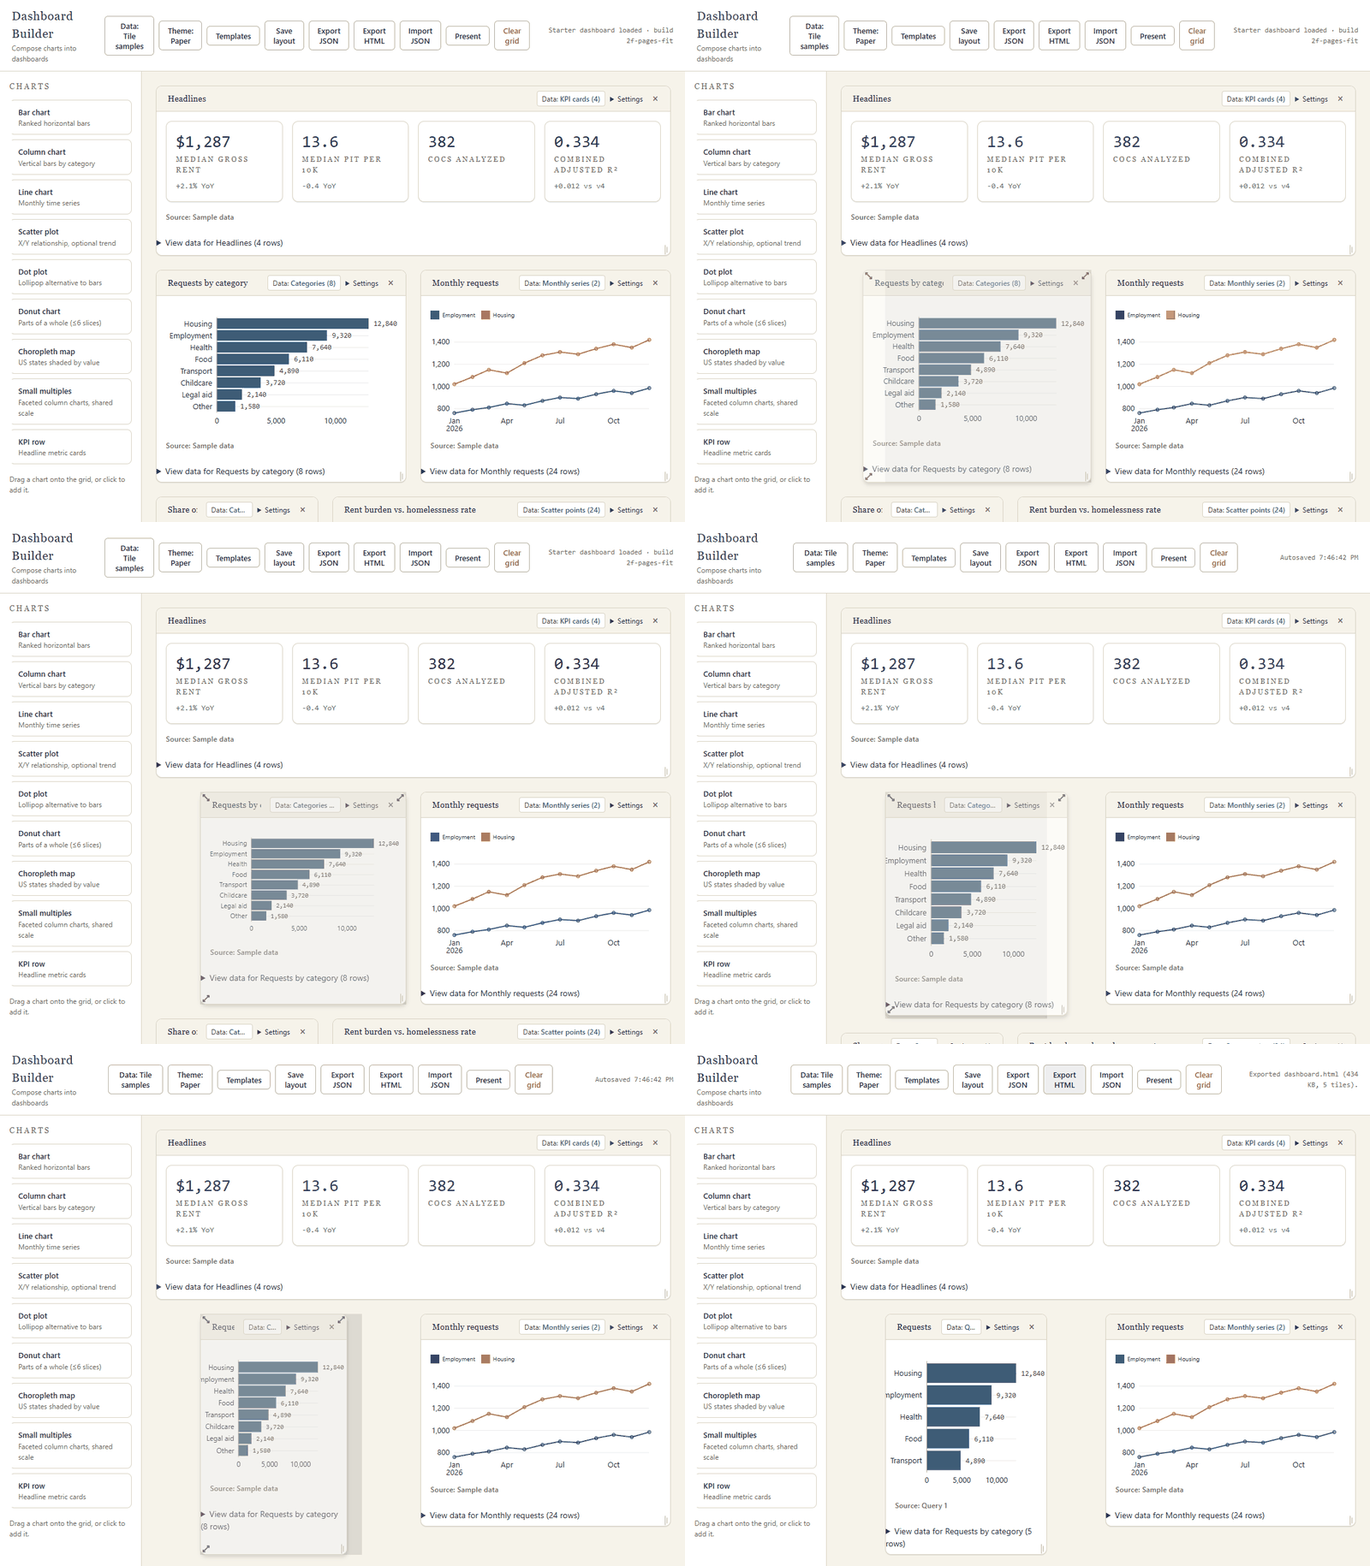
A free, local-first dashboard composer. Drag-and-drop grid, nine chart types, in-browser SQL, and one-click export to a self-contained HTML file. No account, no server, no subscription.


Features
- Drag-and-drop, resizable 12-column grid with content-aware tile sizing
- 9 chart types (bar, column, line, scatter + trend, dot, donut, choropleth, KPI, text) rendered with Observable Plot
- CSV/JSON upload processed locally — your data never leaves the browser — plus built-in sample datasets
- Guided upload summary with column-type and missing-value observations plus explainable chart suggestions
- In-browser SQL via DuckDB-WASM: query your uploads, apply results straight to tiles
- 4 themes, 6 starter templates, save/load dashboards as JSON
- Export to a single self-contained HTML file — email it or host it anywhere, no server needed
- Data-integrity guardrails: explicit binding modes, visible sampling notices, per-chart data tables
Quick start
No install needed — open the live demo and start dragging. To run it locally:
npm ci
npm run dev
Template gallery
Explore three original sample dashboards in the starter template gallery:
- Executive overview — KPIs, monthly trend, and category mix.
- Trend deep dive — time series, small multiples, and scatter.
- Geographic snapshot — state map with supporting metrics.
Choose Templates in the composer to try these or the other three starters.
Start from an upload
Choose Data and upload a CSV or JSON file to see its row and column counts, full-file missing-value counts, and inferred column types. Type inference uses up to 5,000 evenly spaced rows; it is a suggestion, not a change to the source data. The composer may offer a small set of charts when existing column-name mapping rules can map the fields conservatively. Review, change field choices, or uncheck suggestions before building. You can also set the upload as dashboard data or keep the current dashboard. Profiling and chart suggestions run locally in the browser.
Contributing
See CONTRIBUTING.md for setup, checks, and PR guidelines. New contributors can browse good first issues.
Development
Run and verify
Use Node 24 (the verified test environment) and an installed desktop Google Chrome for browser tests.
npm ci
npm test
npm run build
npm run test:browser
npm run dev
The dev lifecycle builds the export template before starting Vite. Production builds generate the template and composer together. Vite's runner config loader avoids the Windows sandbox path traversal encountered with its bundling loader. The browser suite starts its own local server at port 4173 and uses isolated browser storage. Close any server on that port first.
The render sweep covers every registry renderer under all four themes (36 cases). Focused tests cover data correctness, migration, precision, limits and serialized queries; browser tests use real DuckDB-WASM, fault injection, fresh storage, keyboard workflows and offline HTML. Evidence and scope are in the remediation report.
Architecture
Data and chart contracts
Each tile's Data control offers samples, a mapped upload, SQL, or following the dashboard default. Missing uploads, queries and SQL tables remain bound to their original references. A blocking notice offers Repair data binding. Choosing sample data is an explicit action; loading or exporting never substitutes it.
Charts use neutral axis labels until a user enters X label / unit or Y label / unit under each tile’s Settings. These choices travel through autosave, JSON, templates and HTML. Small-multiple columns use one zero-inclusive domain by default; disabling Include zero displays a cropped-domain notice.
Donuts combine duplicate labels, sort by contribution and show the largest five categories plus an explicitly labeled Other bucket when needed. Every contribution remains in the total. Negative, nonfinite or zero-total inputs produce a clear unsupported-data state. The eight-category sample totals 48,240.
Every chart has an expandable, paginated text table of its authoritative data. Scatter and line plots with more than 2,000 rows show 2,000 evenly spaced rows and a visible transformation notice. Their underlying rows remain in storage, JSON, HTML and the text table. Trend lines on sampled scatter plots describe the sample; use SQL aggregation when an authoritative statistical result is needed. Bar/category charts refuse more than 100 rows rather than silently omit them.
Layout schema and replacement
Layouts carry app: "dashboard-builder", version: 3, rowHeight: 24, theme, dashboard default,
tile geometry, metadata and explicit binding modes:
{
  "app": "dashboard-builder", "version": 3, "rowHeight": 24, "theme": "paper",
  "defaultDataset": { "kind": "samples" },
  "tiles": [{
    "id": "revenue", "type": "bar", "title": "Revenue", "source": "sales.csv",
    "dataset": "upload:sales", "binding": { "mode": "explicit", "ref": "upload:sales" },
    "sizing": "manual", "tileOptions": { "xLabel": "USD" }, "x": 0, "y": 0, "w": 6, "h": 15
  }]
}
A dashboard follower has dataset: null and binding: {mode:"dashboard"}.
An explicit sample, upload or query reference stays explicit even if it equals a
tile's sample default. Version 1 migrates without guessing: every existing
nonnull reference becomes explicit and missing/null references follow the
dashboard. V1 cannot recover historical intent, so it never converts a matching
sample reference into a follower. Validation clones its input; migration occurs
once and the next save is V3. V1/V2 geometry uses 72px rows; migration
multiplies y/h by three while preserving x/w and data bindings. V3 uses 24px
rows with gutters inside each cell, also used by HTML exports. Other versions
and row heights are rejected.
Manual resize intent is saved with the tile and survives data changes, reload, import and present mode. Settings → Fit content chooses automatic sizing. Plots redraw during pointer resizing and use both available width and height. Very small manually sized tiles retain one outer scrolling fallback so labels, source notes and data alternatives remain reachable.
Autosave remains at dashboard-builder:layout:v1 for storage compatibility.
Imports validate the complete candidate before side effects: own registry types,
unique IDs, bounded finite integer geometry, themes, bindings, options, data,
queries, mappings and size budgets. Conflicting uploaded/query IDs are rejected.
Imports construct controls before persistence, write/read back datasets in one
IndexedDB transaction, and retain a recovery journal at
dashboard-builder:layout:v1:recovery. Construction or storage failure restores
the prior grid, queries and layout and rolls back only new import records.
Templates use the same schema validation and preserve chart options.
Persistence and migration
Uploads live in IndexedDB dashbuilder, object store datasets; queries live
at dashbuilder.queries.v1. Data that cannot persist is labeled session only.
Export JSON provides a backup.
Legacy dataset keys dashbuilder.datasets.v1 and klaroDash.datasets.v1 remain
until every record has been written and read back from IndexedDB. Partial writes,
quota failures, unavailable storage and corrupt input retain the original source
and expose a retry action. The old klaro-dashboard database is retained after
copying. Failed migrations never claim durable persistence.
SQL and portability
DuckDB tables use sample keys (categorical, timeseries, etc.) and
upload_<id>. Only one SELECT/WITH query is supported per run. Table
synchronization and execution share one serialized queue. A successful preview
is eligible to Apply only if its immutable SQL, request token and dataset revision
still match. Editing, starting/failing a run, discarding a result, or changing
datasets invalidates eligibility; mapping changes cannot bypass it. Results from
superseded revisions are rejected. Cache identity includes revision and field
contract, and becomes stale as soon as data changes.
Query dependencies conservatively include all registered uploads at Apply;
legacy queries with unknown dependencies include all registered uploads during
export. Arbitrary SQL is not parsed with a best-effort regular expression.
Export JSON includes eligible inputs, saved SQL and mappings. Missing/oversized
inputs and failed queries are listed before downloading; proceeding retains
broken references and an omittedDependencies list. Each dataset's inline
budget is 500 KiB. Portability therefore depends on carrying every dependency.
HTML export carries materialized query results, all tile rows, theme and options; its viewer runs without SQL or network access. It rejects an export if the dashboard changes during preparation. Errors remain visible per tile.
Exact numbers and dates
Safe SQL integers become Numbers; larger integers become exact decimal strings. KPI/text fields, IndexedDB and JSON preserve those strings. Numeric plotting refuses integers outside the safe Number range. Make approximation explicit in SQL (for example, rounding to a suitable unit) before plotting.
Currency/decimal values requiring exact display must be SQL CAST AS VARCHAR and mapped to a KPI/text field. Arrow Decimal results require that cast, or an explicit CAST AS DOUBLE for approximate plotting. Upload JSON must encode unsafe integers as strings; numeric JSON integers already outside the safe range are rejected.
Date-only strings remain calendar dates. ISO timestamps with offsets and up to millisecond precision can become line-chart dates. SQL timestamp epoch values become UTC ISO strings; sub-millisecond values are refused with instructions to CAST AS VARCHAR to preserve exact text. This is a millisecond Date contract, not a claim of arbitrary timezone or fractional precision support.
Budgets, keyboard and offline scope
Engineering limits are separate from measured device capacity:
| Resource | Limit / behavior |
|---|---|
| Upload | 16 MiB, 250,000 rows, 100 columns |
| SQL returned rows / columns | 10,000 / 100; add LIMIT or aggregate |
| Dense plotted marks | 2,000, with visible sampling notice |
| Category/KPI rows | 100, otherwise unsupported-data notice |
| Small-multiple facets | 12, otherwise filter/aggregate notice |
| Layout | 32 MiB, 100 tiles, twelve columns, max geometry 3,000 rows of 24px (same physical limit as legacy) |
| JSON inline data | 500 KiB per dataset; omitted dependencies listed |
Uploads parse in a worker, show progress, and can be cancelled. SQL runs in its DuckDB worker with a running status. Discarding a running result prevents Apply; it does not terminate the engine computation. Wait for execution to settle before the next Run. Returned results are capped before JS materialization.
Core controls are keyboard operable; dialogs enter/trap/return focus and Escape closes them. Chart tables provide text alternatives. The verified editor viewport is desktop Chrome at 1440×900 and 1024×768. The exported viewer has print rules that keep each tile together and start a page per tile. Chrome print media is tested; printer-specific output, screen-reader acceptance, mobile editing and other browser engines are outside the retained acceptance evidence.
Uploaded data is processed locally. The composer loads application assets and lazy DuckDB/WASM assets from its static host; HTML export fetches a generated viewer template. These are runtime network requests. Downloaded HTML is tested with browser networking disabled. Composer startup and first SQL use offline are not promised; a cache hit is not a verified offline installation mode.
Templates and release
Six original starter templates and user-saved templates retain theme and tile options. Applying a template asks before replacing the dashboard. Templates contain data references, so missing uploads/queries require repair in another browser. Contributed templates must use original compositions rather than recreate another creator's dashboard.
Production build output is dist/. Publishing, deployment and public release
remain separate owner-authorized actions.
Stack and licenses
| Dependency | Version | License | Role |
|---|---|---|---|
| gridstack | 13.x | MIT | Drag/resize dashboard grid |
| @observablehq/plot | 0.6.x | ISC | Chart rendering |
| d3-shape | 3.x | ISC | Donut arcs |
| d3-interpolate | 3.x | ISC | Color ramps |
| htl | 0.3.x | ISC | HTML/SVG templating |
| d3-dsv | 3.x | ISC | CSV parsing for uploads |
| @duckdb/duckdb-wasm | 1.32.0 | MIT | In-browser SQL, lazy-loaded |
| topojson-client | 3.x | ISC | TopoJSON → GeoJSON (choropleth) |
| idb | 8.x | ISC | IndexedDB wrapper (upload store) |
| vite (dev) | 7.x | MIT | Build tooling |
This project itself is MIT (see LICENSE). Browser test tooling uses
@playwright/test and fake-indexeddb, both Apache-2.0 according to their
installed package metadata.
Similar repos


Languages
JavaScript
89.3%
CSS
9.5%
Free, local-first drag-and-drop dashboard builder — Observable Plot charts, in-browser SQL, one-click HTML export
See the codeSee what people are saying
README
Dashboard Builder
A free, local-first dashboard composer. Drag-and-drop grid, nine chart types, in-browser SQL, and one-click export to a self-contained HTML file. No account, no server, no subscription.
Features
- Drag-and-drop, resizable 12-column grid with content-aware tile sizing
- 9 chart types (bar, column, line, scatter + trend, dot, donut, choropleth, KPI, text) rendered with Observable Plot
- CSV/JSON upload processed locally — your data never leaves the browser — plus built-in sample datasets
- Guided upload summary with column-type and missing-value observations plus explainable chart suggestions
- In-browser SQL via DuckDB-WASM: query your uploads, apply results straight to tiles
- 4 themes, 6 starter templates, save/load dashboards as JSON
- Export to a single self-contained HTML file — email it or host it anywhere, no server needed
- Data-integrity guardrails: explicit binding modes, visible sampling notices, per-chart data tables
Quick start
No install needed — open the live demo and start dragging. To run it locally:
npm ci
npm run dev
Template gallery
Explore three original sample dashboards in the starter template gallery:
- Executive overview — KPIs, monthly trend, and category mix.
- Trend deep dive — time series, small multiples, and scatter.
- Geographic snapshot — state map with supporting metrics.
Choose Templates in the composer to try these or the other three starters.
Start from an upload
Choose Data and upload a CSV or JSON file to see its row and column counts, full-file missing-value counts, and inferred column types. Type inference uses up to 5,000 evenly spaced rows; it is a suggestion, not a change to the source data. The composer may offer a small set of charts when existing column-name mapping rules can map the fields conservatively. Review, change field choices, or uncheck suggestions before building. You can also set the upload as dashboard data or keep the current dashboard. Profiling and chart suggestions run locally in the browser.
Contributing
See CONTRIBUTING.md for setup, checks, and PR guidelines. New contributors can browse good first issues.
Development
Run and verify
Use Node 24 (the verified test environment) and an installed desktop Google Chrome for browser tests.
npm ci
npm test
npm run build
npm run test:browser
npm run dev
The dev lifecycle builds the export template before starting Vite. Production builds generate the template and composer together. Vite's runner config loader avoids the Windows sandbox path traversal encountered with its bundling loader. The browser suite starts its own local server at port 4173 and uses isolated browser storage. Close any server on that port first.
The render sweep covers every registry renderer under all four themes (36 cases). Focused tests cover data correctness, migration, precision, limits and serialized queries; browser tests use real DuckDB-WASM, fault injection, fresh storage, keyboard workflows and offline HTML. Evidence and scope are in the remediation report.
Architecture
Data and chart contracts
Each tile's Data control offers samples, a mapped upload, SQL, or following the dashboard default. Missing uploads, queries and SQL tables remain bound to their original references. A blocking notice offers Repair data binding. Choosing sample data is an explicit action; loading or exporting never substitutes it.
Charts use neutral axis labels until a user enters X label / unit or Y label / unit under each tile’s Settings. These choices travel through autosave, JSON, templates and HTML. Small-multiple columns use one zero-inclusive domain by default; disabling Include zero displays a cropped-domain notice.
Donuts combine duplicate labels, sort by contribution and show the largest five categories plus an explicitly labeled Other bucket when needed. Every contribution remains in the total. Negative, nonfinite or zero-total inputs produce a clear unsupported-data state. The eight-category sample totals 48,240.
Every chart has an expandable, paginated text table of its authoritative data. Scatter and line plots with more than 2,000 rows show 2,000 evenly spaced rows and a visible transformation notice. Their underlying rows remain in storage, JSON, HTML and the text table. Trend lines on sampled scatter plots describe the sample; use SQL aggregation when an authoritative statistical result is needed. Bar/category charts refuse more than 100 rows rather than silently omit them.
Layout schema and replacement
Layouts carry app: "dashboard-builder", version: 3, rowHeight: 24, theme, dashboard default,
tile geometry, metadata and explicit binding modes:
{
  "app": "dashboard-builder", "version": 3, "rowHeight": 24, "theme": "paper",
  "defaultDataset": { "kind": "samples" },
  "tiles": [{
    "id": "revenue", "type": "bar", "title": "Revenue", "source": "sales.csv",
    "dataset": "upload:sales", "binding": { "mode": "explicit", "ref": "upload:sales" },
    "sizing": "manual", "tileOptions": { "xLabel": "USD" }, "x": 0, "y": 0, "w": 6, "h": 15
  }]
}
A dashboard follower has dataset: null and binding: {mode:"dashboard"}.
An explicit sample, upload or query reference stays explicit even if it equals a
tile's sample default. Version 1 migrates without guessing: every existing
nonnull reference becomes explicit and missing/null references follow the
dashboard. V1 cannot recover historical intent, so it never converts a matching
sample reference into a follower. Validation clones its input; migration occurs
once and the next save is V3. V1/V2 geometry uses 72px rows; migration
multiplies y/h by three while preserving x/w and data bindings. V3 uses 24px
rows with gutters inside each cell, also used by HTML exports. Other versions
and row heights are rejected.
Manual resize intent is saved with the tile and survives data changes, reload, import and present mode. Settings → Fit content chooses automatic sizing. Plots redraw during pointer resizing and use both available width and height. Very small manually sized tiles retain one outer scrolling fallback so labels, source notes and data alternatives remain reachable.
Autosave remains at dashboard-builder:layout:v1 for storage compatibility.
Imports validate the complete candidate before side effects: own registry types,
unique IDs, bounded finite integer geometry, themes, bindings, options, data,
queries, mappings and size budgets. Conflicting uploaded/query IDs are rejected.
Imports construct controls before persistence, write/read back datasets in one
IndexedDB transaction, and retain a recovery journal at
dashboard-builder:layout:v1:recovery. Construction or storage failure restores
the prior grid, queries and layout and rolls back only new import records.
Templates use the same schema validation and preserve chart options.
Persistence and migration
Uploads live in IndexedDB dashbuilder, object store datasets; queries live
at dashbuilder.queries.v1. Data that cannot persist is labeled session only.
Export JSON provides a backup.
Legacy dataset keys dashbuilder.datasets.v1 and klaroDash.datasets.v1 remain
until every record has been written and read back from IndexedDB. Partial writes,
quota failures, unavailable storage and corrupt input retain the original source
and expose a retry action. The old klaro-dashboard database is retained after
copying. Failed migrations never claim durable persistence.
SQL and portability
DuckDB tables use sample keys (categorical, timeseries, etc.) and
upload_<id>. Only one SELECT/WITH query is supported per run. Table
synchronization and execution share one serialized queue. A successful preview
is eligible to Apply only if its immutable SQL, request token and dataset revision
still match. Editing, starting/failing a run, discarding a result, or changing
datasets invalidates eligibility; mapping changes cannot bypass it. Results from
superseded revisions are rejected. Cache identity includes revision and field
contract, and becomes stale as soon as data changes.
Query dependencies conservatively include all registered uploads at Apply;
legacy queries with unknown dependencies include all registered uploads during
export. Arbitrary SQL is not parsed with a best-effort regular expression.
Export JSON includes eligible inputs, saved SQL and mappings. Missing/oversized
inputs and failed queries are listed before downloading; proceeding retains
broken references and an omittedDependencies list. Each dataset's inline
budget is 500 KiB. Portability therefore depends on carrying every dependency.
HTML export carries materialized query results, all tile rows, theme and options; its viewer runs without SQL or network access. It rejects an export if the dashboard changes during preparation. Errors remain visible per tile.
Exact numbers and dates
Safe SQL integers become Numbers; larger integers become exact decimal strings. KPI/text fields, IndexedDB and JSON preserve those strings. Numeric plotting refuses integers outside the safe Number range. Make approximation explicit in SQL (for example, rounding to a suitable unit) before plotting.
Currency/decimal values requiring exact display must be SQL CAST AS VARCHAR and mapped to a KPI/text field. Arrow Decimal results require that cast, or an explicit CAST AS DOUBLE for approximate plotting. Upload JSON must encode unsafe integers as strings; numeric JSON integers already outside the safe range are rejected.
Date-only strings remain calendar dates. ISO timestamps with offsets and up to millisecond precision can become line-chart dates. SQL timestamp epoch values become UTC ISO strings; sub-millisecond values are refused with instructions to CAST AS VARCHAR to preserve exact text. This is a millisecond Date contract, not a claim of arbitrary timezone or fractional precision support.
Budgets, keyboard and offline scope
Engineering limits are separate from measured device capacity:
| Resource | Limit / behavior |
|---|---|
| Upload | 16 MiB, 250,000 rows, 100 columns |
| SQL returned rows / columns | 10,000 / 100; add LIMIT or aggregate |
| Dense plotted marks | 2,000, with visible sampling notice |
| Category/KPI rows | 100, otherwise unsupported-data notice |
| Small-multiple facets | 12, otherwise filter/aggregate notice |
| Layout | 32 MiB, 100 tiles, twelve columns, max geometry 3,000 rows of 24px (same physical limit as legacy) |
| JSON inline data | 500 KiB per dataset; omitted dependencies listed |
Uploads parse in a worker, show progress, and can be cancelled. SQL runs in its DuckDB worker with a running status. Discarding a running result prevents Apply; it does not terminate the engine computation. Wait for execution to settle before the next Run. Returned results are capped before JS materialization.
Core controls are keyboard operable; dialogs enter/trap/return focus and Escape closes them. Chart tables provide text alternatives. The verified editor viewport is desktop Chrome at 1440×900 and 1024×768. The exported viewer has print rules that keep each tile together and start a page per tile. Chrome print media is tested; printer-specific output, screen-reader acceptance, mobile editing and other browser engines are outside the retained acceptance evidence.
Uploaded data is processed locally. The composer loads application assets and lazy DuckDB/WASM assets from its static host; HTML export fetches a generated viewer template. These are runtime network requests. Downloaded HTML is tested with browser networking disabled. Composer startup and first SQL use offline are not promised; a cache hit is not a verified offline installation mode.
Templates and release
Six original starter templates and user-saved templates retain theme and tile options. Applying a template asks before replacing the dashboard. Templates contain data references, so missing uploads/queries require repair in another browser. Contributed templates must use original compositions rather than recreate another creator's dashboard.
Production build output is dist/. Publishing, deployment and public release
remain separate owner-authorized actions.
Stack and licenses
| Dependency | Version | License | Role |
|---|---|---|---|
| gridstack | 13.x | MIT | Drag/resize dashboard grid |
| @observablehq/plot | 0.6.x | ISC | Chart rendering |
| d3-shape | 3.x | ISC | Donut arcs |
| d3-interpolate | 3.x | ISC | Color ramps |
| htl | 0.3.x | ISC | HTML/SVG templating |
| d3-dsv | 3.x | ISC | CSV parsing for uploads |
| @duckdb/duckdb-wasm | 1.32.0 | MIT | In-browser SQL, lazy-loaded |
| topojson-client | 3.x | ISC | TopoJSON → GeoJSON (choropleth) |
| idb | 8.x | ISC | IndexedDB wrapper (upload store) |
| vite (dev) | 7.x | MIT | Build tooling |
This project itself is MIT (see LICENSE). Browser test tooling uses
@playwright/test and fake-indexeddb, both Apache-2.0 according to their
installed package metadata.
Similar repos
Languages
JavaScript
89.3%
CSS
9.5%