Library for animated data visualizations and data stories.
See the code

Vizzu - Library for animated data visualizations and data stories.
Documentation · Examples · Code reference · Repository · Blog


Vizzu is a free, open-source Javascript/C++ library utilizing a generic dataviz engine that generates many types of charts and seamlessly animates between them. It can be used to create static charts but more importantly, it is designed for building animated data stories and interactive explorers as Vizzu enables showing different perspectives of the data that the viewers can easily follow due to the animation.
Main features:
Install via npm:
npm install vizzu
Or use it from CDN:
<html>
 <head>
  <script type="module">
   import Vizzu from 'https://cdn.jsdelivr.net/npm/vizzu@latest/dist/vizzu.min.js';
  </script>
 </head>
</html>
Create a placeholder element that will contain the rendered chart:
<html>
 <body>
  <div id="myVizzu" style="width:800px; height:480px;">
  </div>
 </body>
</html>
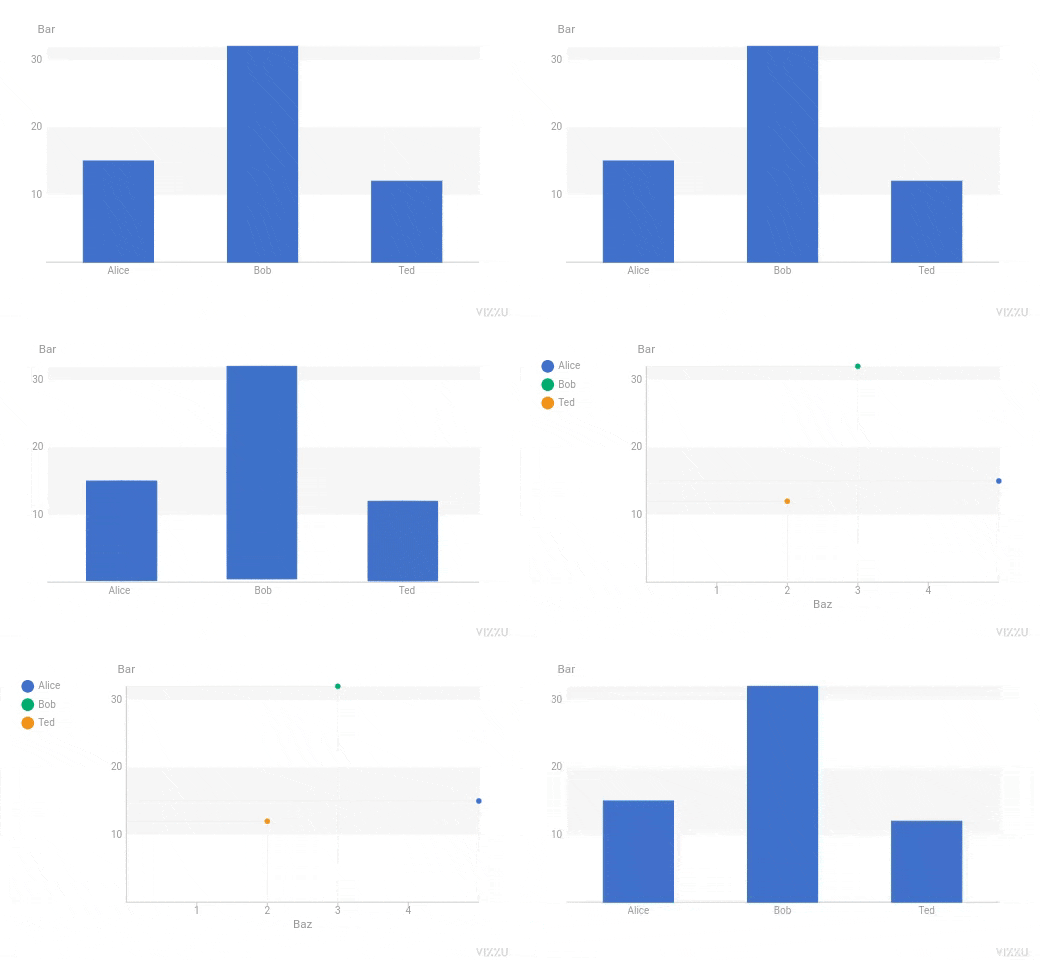
Create a simple bar chart:
import Vizzu from 'https://cdn.jsdelivr.net/npm/vizzu@latest/dist/vizzu.min.js';

let data = {
    series: [{
        name: 'Foo',
        values: ['Alice', 'Bob', 'Ted']
    }, {
        name: 'Bar',
        values: [15, 32, 12]
    }, {
        name: 'Baz',
        values: [5, 3, 2]
    }]
};

let chart = new Vizzu('myVizzu', {
    data
});
chart.animate({
    x: 'Foo',
    y: 'Bar'
});
Then turn it into a scatter plot:
chart.animate({
    color: 'Foo',
    x: 'Baz',
    geometry: 'circle'
});
You can find answers to the most frequently asked questions about using the library in our FAQ.
List of external projects (extensions, bindings, templates, etc) for Vizzu: Projects.
We have a comprehensive list of features we plan to implement, on our Roadmap.
We welcome contributions to the project, visit our contributing guide for further info.
Join our Slack: vizzu-community.slack.com
Drop us a line at hello@vizzu.io
Follow us on Twitter: https://twitter.com/VizzuHQ
Copyright © 2021-2025 Vizzu Inc.
Released under the Apache 2.0 License.
140 followers · starred Sep 2021
402 followers · starred Oct 2021
5,073 followers · starred Nov 2021
1,969 followers · starred Oct 2021
Library for animated data visualizations and data stories.
See the code
Vizzu - Library for animated data visualizations and data stories.
Documentation · Examples · Code reference · Repository · Blog
Vizzu is a free, open-source Javascript/C++ library utilizing a generic dataviz engine that generates many types of charts and seamlessly animates between them. It can be used to create static charts but more importantly, it is designed for building animated data stories and interactive explorers as Vizzu enables showing different perspectives of the data that the viewers can easily follow due to the animation.
Main features:
Install via npm:
npm install vizzu
Or use it from CDN:
<html>
 <head>
  <script type="module">
   import Vizzu from 'https://cdn.jsdelivr.net/npm/vizzu@latest/dist/vizzu.min.js';
  </script>
 </head>
</html>
Create a placeholder element that will contain the rendered chart:
<html>
 <body>
  <div id="myVizzu" style="width:800px; height:480px;">
  </div>
 </body>
</html>
Create a simple bar chart:
import Vizzu from 'https://cdn.jsdelivr.net/npm/vizzu@latest/dist/vizzu.min.js';

let data = {
    series: [{
        name: 'Foo',
        values: ['Alice', 'Bob', 'Ted']
    }, {
        name: 'Bar',
        values: [15, 32, 12]
    }, {
        name: 'Baz',
        values: [5, 3, 2]
    }]
};

let chart = new Vizzu('myVizzu', {
    data
});
chart.animate({
    x: 'Foo',
    y: 'Bar'
});
Then turn it into a scatter plot:
chart.animate({
    color: 'Foo',
    x: 'Baz',
    geometry: 'circle'
});
You can find answers to the most frequently asked questions about using the library in our FAQ.
List of external projects (extensions, bindings, templates, etc) for Vizzu: Projects.
We have a comprehensive list of features we plan to implement, on our Roadmap.
We welcome contributions to the project, visit our contributing guide for further info.
Join our Slack: vizzu-community.slack.com
Drop us a line at hello@vizzu.io
Follow us on Twitter: https://twitter.com/VizzuHQ
Copyright © 2021-2025 Vizzu Inc.
Released under the Apache 2.0 License.
140 followers · starred Sep 2021
402 followers · starred Oct 2021
5,073 followers · starred Nov 2021
1,969 followers · starred Oct 2021



