Composable Charting Library based on reusable D3.js components.
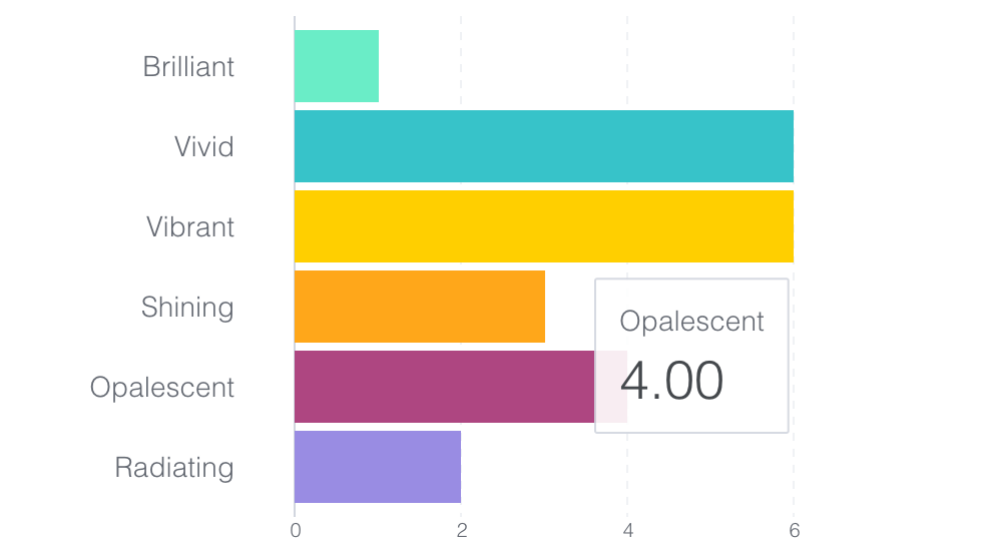
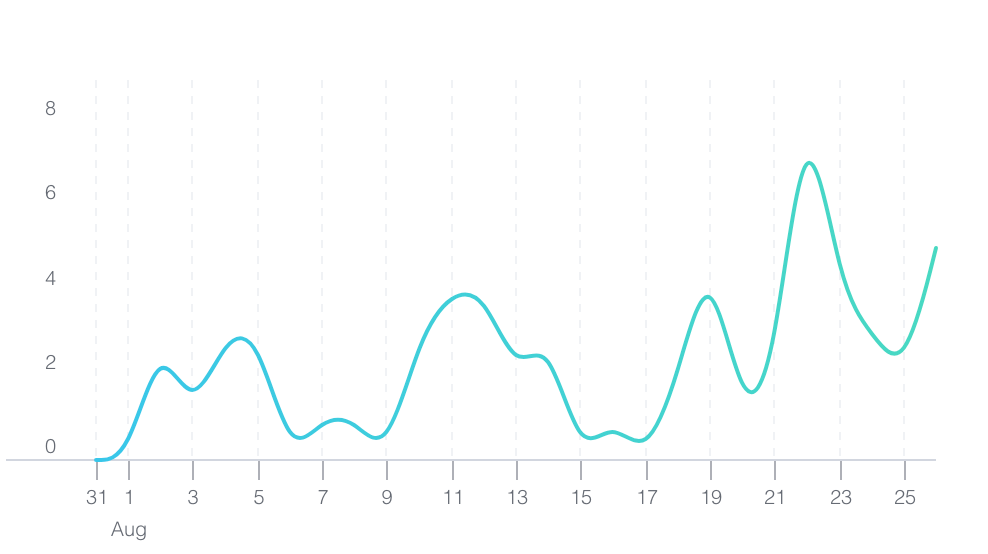
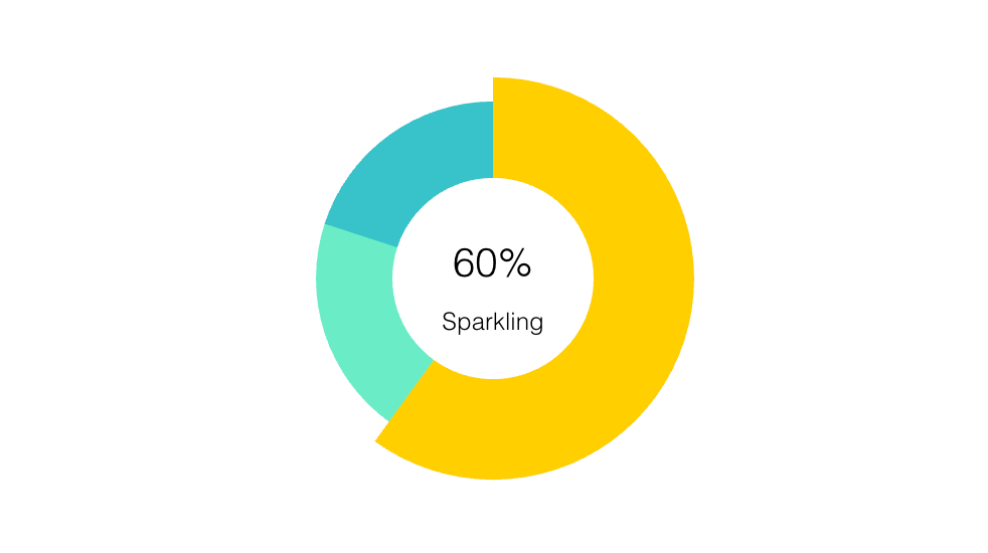
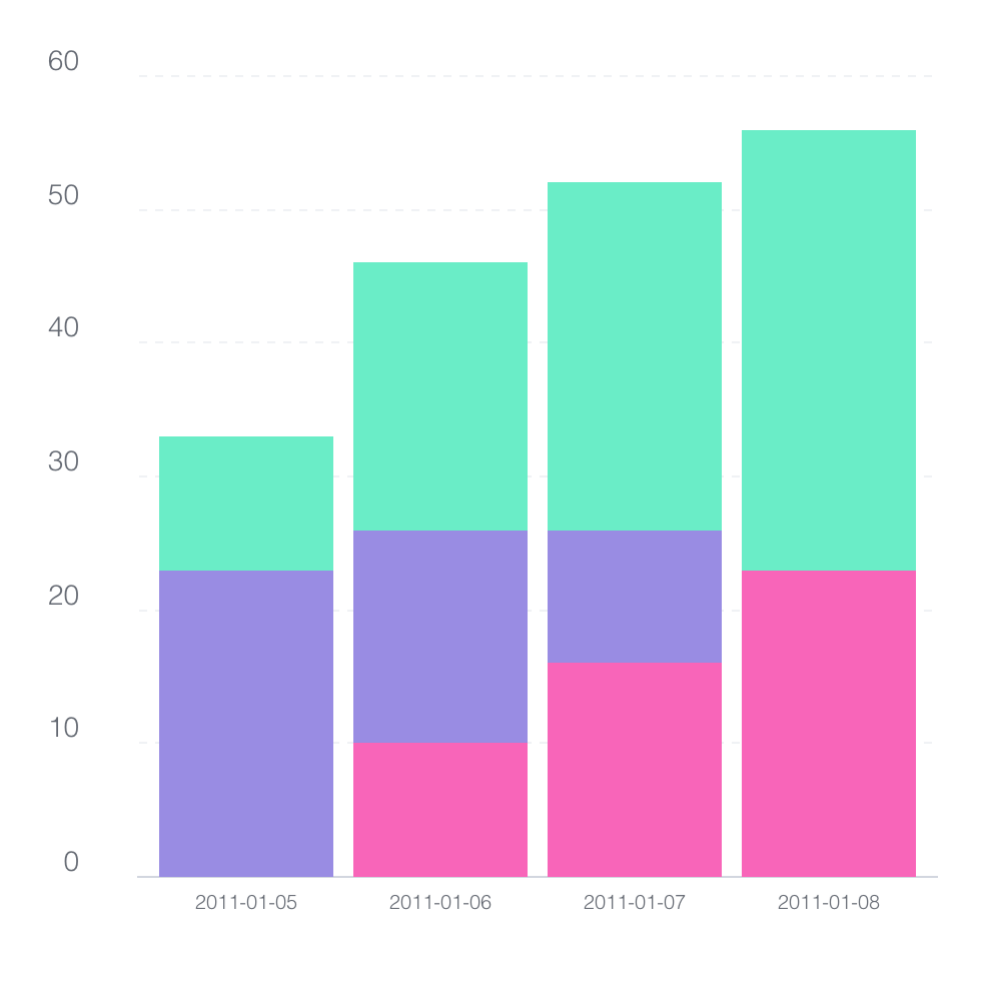
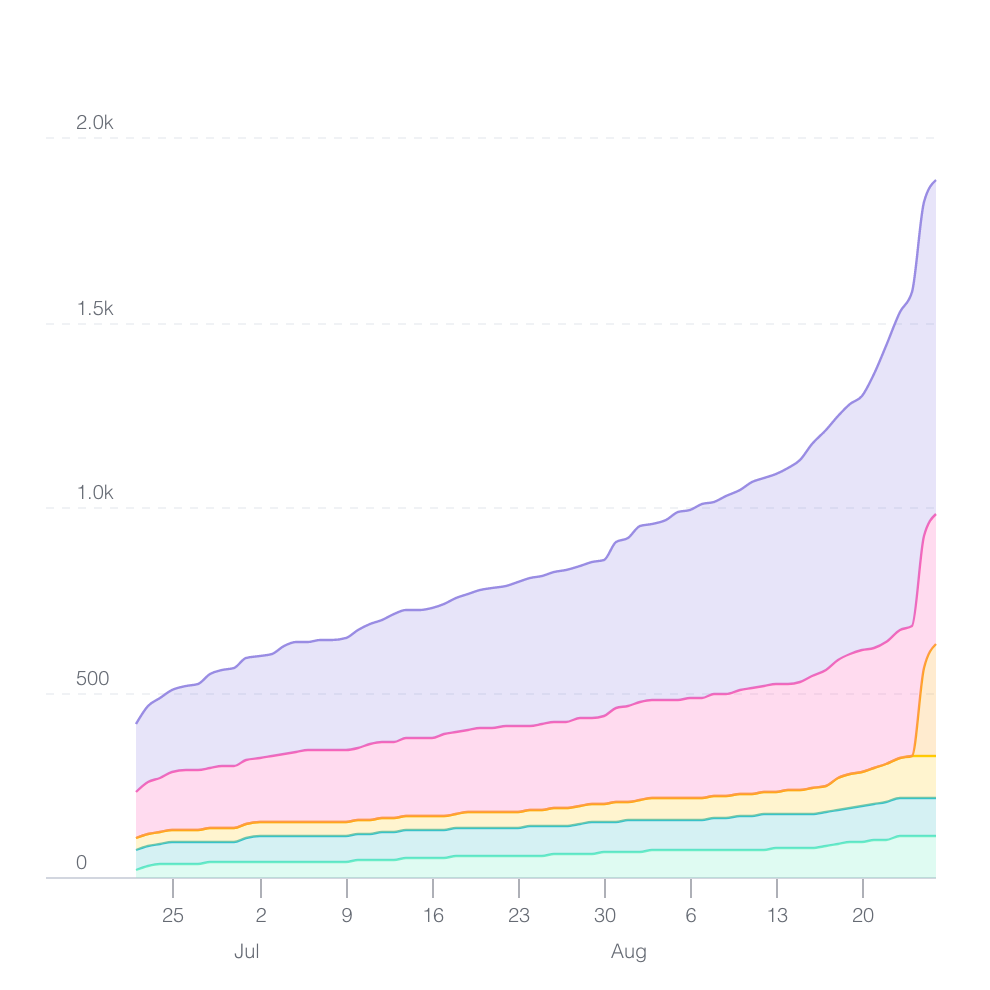
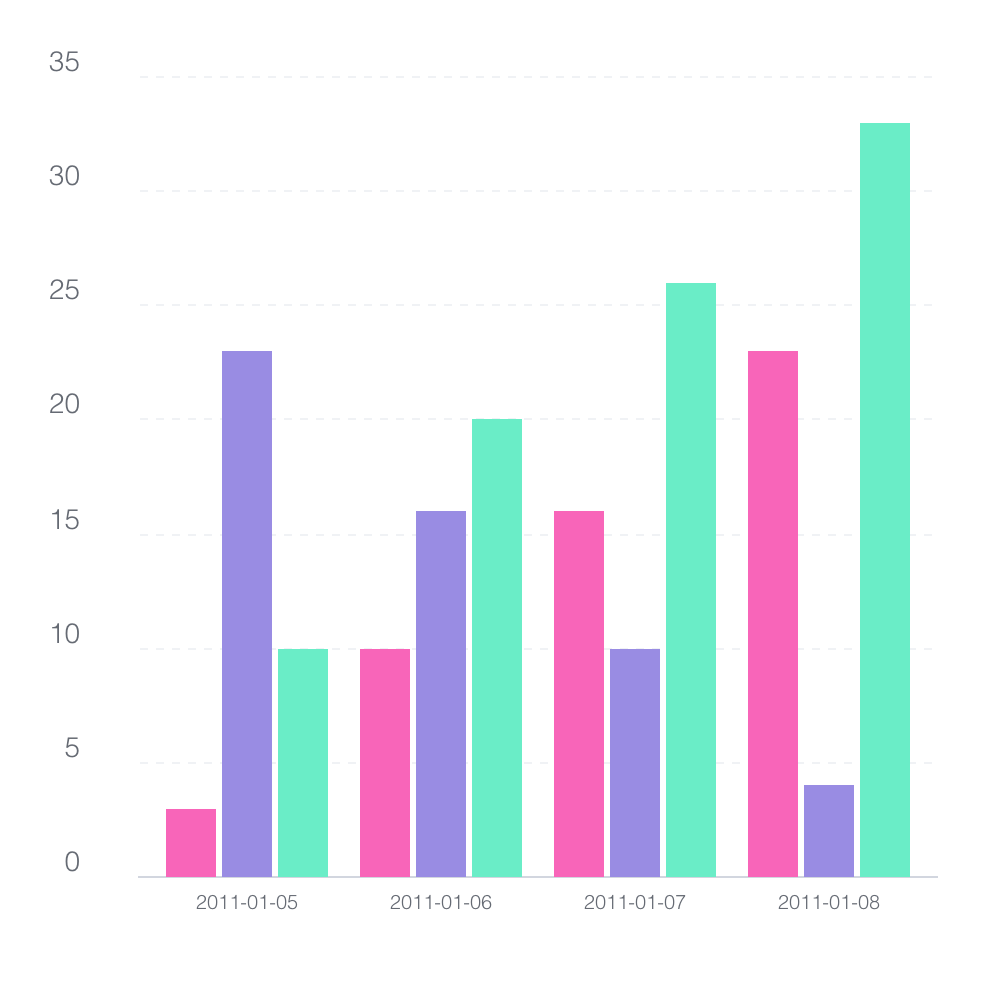
See the codeBritecharts makes it easier to build stunning D3.js-powered interactive charts with little code.






 |  |  |
|---|---|---|
 |  |  |
 |  | 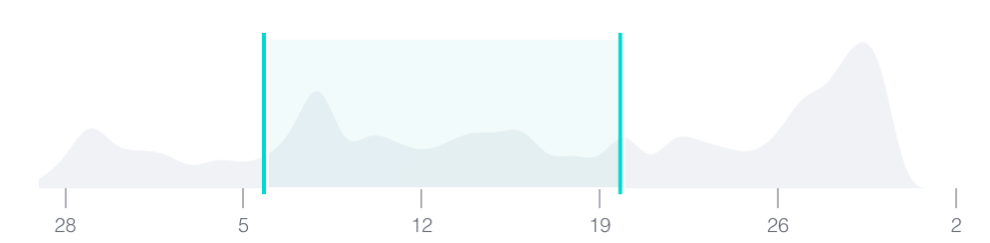 |
Britecharts is a client-side reusable Charting Library based on D3.js that provides easy composition of charts and components to create amazing data visualizations.
Britecharts components have been written in ES2016 with a Test Driven methodology, so they are fully tested, and we are committed to keeping them that way.
The typical use of Britecharts involves creating a chart using its simple API, then rendering it on a container that has previously had data applied to it. The code will look like this:
    import { select } from 'd3-selection';
    import { bar } from '@britecharts/core';

    const barChart = bar();
    const barContainer = select('.bar-chart-container');
    const dataset = [...];

    barChart
        .width(500)
        .height(300);

    barContainer.datum(dataset).call(barChart);
To use Britecharts with React, you will need to use the @britecharts/react package. Also, if you use Angular, check out ngx-britecharts and their demos. We also include a set of wrappers in @britecharts/wrappers that you can use to employ Britecharts with other web frameworks.
All the components expose common API methods like width, height, and margin. Additionally, each component exposes specific methods you can find in the documentation:
Britecharts components are distributed in UMD modules and ES modules, each one exposing a D3.js component written with the Reusable API pattern. To use any of the Britecharts modules, you will need to require the chart in your JS file using CommonJS modules, ES modules, or adding a <script> tag with the src pointing to the file or CDN bundle. You would also need to load the d3-selection submodule to select the chart container.
   npm install --save @britecharts/core d3-selection
   # or
   yarn add @britecharts/core d3-selection
Alternatively, you can load Britecharts from our CDN as we do in this demo page or play around in our CodePen demo projects.
Then, in your JavaScript module file you can now import and use charts:
import { bar } from '@britecharts/core';
import { select } from 'd3-selection';

const barChart = bar();
const container = select('#container');

const barData = [
    { name: 'Luminous', value: 2 },
    { name: 'Glittering', value: 5 },
    { name: 'Intense', value: 4 },
    { name: 'Radiant', value: 3 }
];

barChart
    .margin({ left: 100 })
    .isHorizontal(true)
    .height(400)
    .width(600);

container.datum(barData).call(barChart);
Britecharts comes with a basic set of CSS styles that you would load with a <link> tag in your page's <head>.
<link
    rel="stylesheet"
    href="./node_modules/britecharts/dist/css/britecharts.css"
/>*
You can customize CSS using new styles. Check our Styling Britecharts tutorial to get started.
This project is in active development. We want your input about what is important, for that, add your votes using the 👍 reaction:
Whether you're helping us fix bugs, improving the docs, or spreading the word, we'd love to have you as part of the Britecharts community!
To give your feedback, you can open a new issue. You can also find us in the D3.js slack group, in the #tool-britecharts channel. We are looking for contributors and committers, so if you want to become a part of this project, check the contributing guide for ideas on contributing and get started today!
Britecharts is dedicated to building a welcoming, diverse, and safe community. We expect everyone participating in the Britecharts community to abide by our Code of Conduct. Please read it and follow it.
Sun Dai designs Britecharts, and two books inspired the code, Developing a D3.js Edge and Mastering D3.js. It also leveraged a significant number of examples and articles from the D3.js community overall.
Thanks goes to these wonderful people (emoji key):
This project follows the all-contributors specification. Contributions of any kind are welcome!
Licensed under the Apache License, Version 2.0 (the "License"); you may not use this file except in compliance with the License. You may obtain a copy of the License at
https://www.apache.org/licenses/LICENSE-2.0
Unless required by applicable law or agreed to in writing, software distributed under the License is distributed on an "AS IS" BASIS, WITHOUT WARRANTIES OR CONDITIONS OF ANY KIND, either express or implied. See the License for the specific language governing permissions and limitations under the License.
Read more in the license document
Overall
Maintained
Code review
npm
Latest release
Releases this year
1,120 followers · starred Jan 2022
537 followers · starred May 2017
430 followers · starred May 2017
81 followers · starred May 2017
Composable Charting Library based on reusable D3.js components.
See the codeBritecharts makes it easier to build stunning D3.js-powered interactive charts with little code.
| | |
|---|---|---|
| | |
| | |
Britecharts is a client-side reusable Charting Library based on D3.js that provides easy composition of charts and components to create amazing data visualizations.
Britecharts components have been written in ES2016 with a Test Driven methodology, so they are fully tested, and we are committed to keeping them that way.
The typical use of Britecharts involves creating a chart using its simple API, then rendering it on a container that has previously had data applied to it. The code will look like this:
    import { select } from 'd3-selection';
    import { bar } from '@britecharts/core';

    const barChart = bar();
    const barContainer = select('.bar-chart-container');
    const dataset = [...];

    barChart
        .width(500)
        .height(300);

    barContainer.datum(dataset).call(barChart);
To use Britecharts with React, you will need to use the @britecharts/react package. Also, if you use Angular, check out ngx-britecharts and their demos. We also include a set of wrappers in @britecharts/wrappers that you can use to employ Britecharts with other web frameworks.
All the components expose common API methods like width, height, and margin. Additionally, each component exposes specific methods you can find in the documentation:
Britecharts components are distributed in UMD modules and ES modules, each one exposing a D3.js component written with the Reusable API pattern. To use any of the Britecharts modules, you will need to require the chart in your JS file using CommonJS modules, ES modules, or adding a <script> tag with the src pointing to the file or CDN bundle. You would also need to load the d3-selection submodule to select the chart container.
   npm install --save @britecharts/core d3-selection
   # or
   yarn add @britecharts/core d3-selection
Alternatively, you can load Britecharts from our CDN as we do in this demo page or play around in our CodePen demo projects.
Then, in your JavaScript module file you can now import and use charts:
import { bar } from '@britecharts/core';
import { select } from 'd3-selection';

const barChart = bar();
const container = select('#container');

const barData = [
    { name: 'Luminous', value: 2 },
    { name: 'Glittering', value: 5 },
    { name: 'Intense', value: 4 },
    { name: 'Radiant', value: 3 }
];

barChart
    .margin({ left: 100 })
    .isHorizontal(true)
    .height(400)
    .width(600);

container.datum(barData).call(barChart);
Britecharts comes with a basic set of CSS styles that you would load with a <link> tag in your page's <head>.
<link
    rel="stylesheet"
    href="./node_modules/britecharts/dist/css/britecharts.css"
/>*
You can customize CSS using new styles. Check our Styling Britecharts tutorial to get started.
This project is in active development. We want your input about what is important, for that, add your votes using the 👍 reaction:
Whether you're helping us fix bugs, improving the docs, or spreading the word, we'd love to have you as part of the Britecharts community!
To give your feedback, you can open a new issue. You can also find us in the D3.js slack group, in the #tool-britecharts channel. We are looking for contributors and committers, so if you want to become a part of this project, check the contributing guide for ideas on contributing and get started today!
Britecharts is dedicated to building a welcoming, diverse, and safe community. We expect everyone participating in the Britecharts community to abide by our Code of Conduct. Please read it and follow it.
Sun Dai designs Britecharts, and two books inspired the code, Developing a D3.js Edge and Mastering D3.js. It also leveraged a significant number of examples and articles from the D3.js community overall.
Thanks goes to these wonderful people (emoji key):
This project follows the all-contributors specification. Contributions of any kind are welcome!
Licensed under the Apache License, Version 2.0 (the "License"); you may not use this file except in compliance with the License. You may obtain a copy of the License at
https://www.apache.org/licenses/LICENSE-2.0
Unless required by applicable law or agreed to in writing, software distributed under the License is distributed on an "AS IS" BASIS, WITHOUT WARRANTIES OR CONDITIONS OF ANY KIND, either express or implied. See the License for the specific language governing permissions and limitations under the License.
Read more in the license document
Overall
Maintained
Code review
npm
Latest release
Releases this year
1,120 followers · starred Jan 2022
537 followers · starred May 2017
430 followers · starred May 2017
81 followers · starred May 2017