
[Production Safe] Phoenix Liveview Dashboard for Observability including Ports and Processes details, Tracing/Profiling with erlang debugger, Beam VM metrics and much more
See the codeREADME

Observer Web
Observer Web is an easy-to-use tool that integrates into your application, providing enhanced observability. Leveraging OTP distribution, it offers tracing and profiling through the Erlang debugger, along with detailed insights into process/port statuses and Beam VM statistics.
Powered by Phoenix LiveView, it is distributed, lightweight, fully real-time and safe to use in production. This library is part of the DeployEx project.
Check out some of the available features
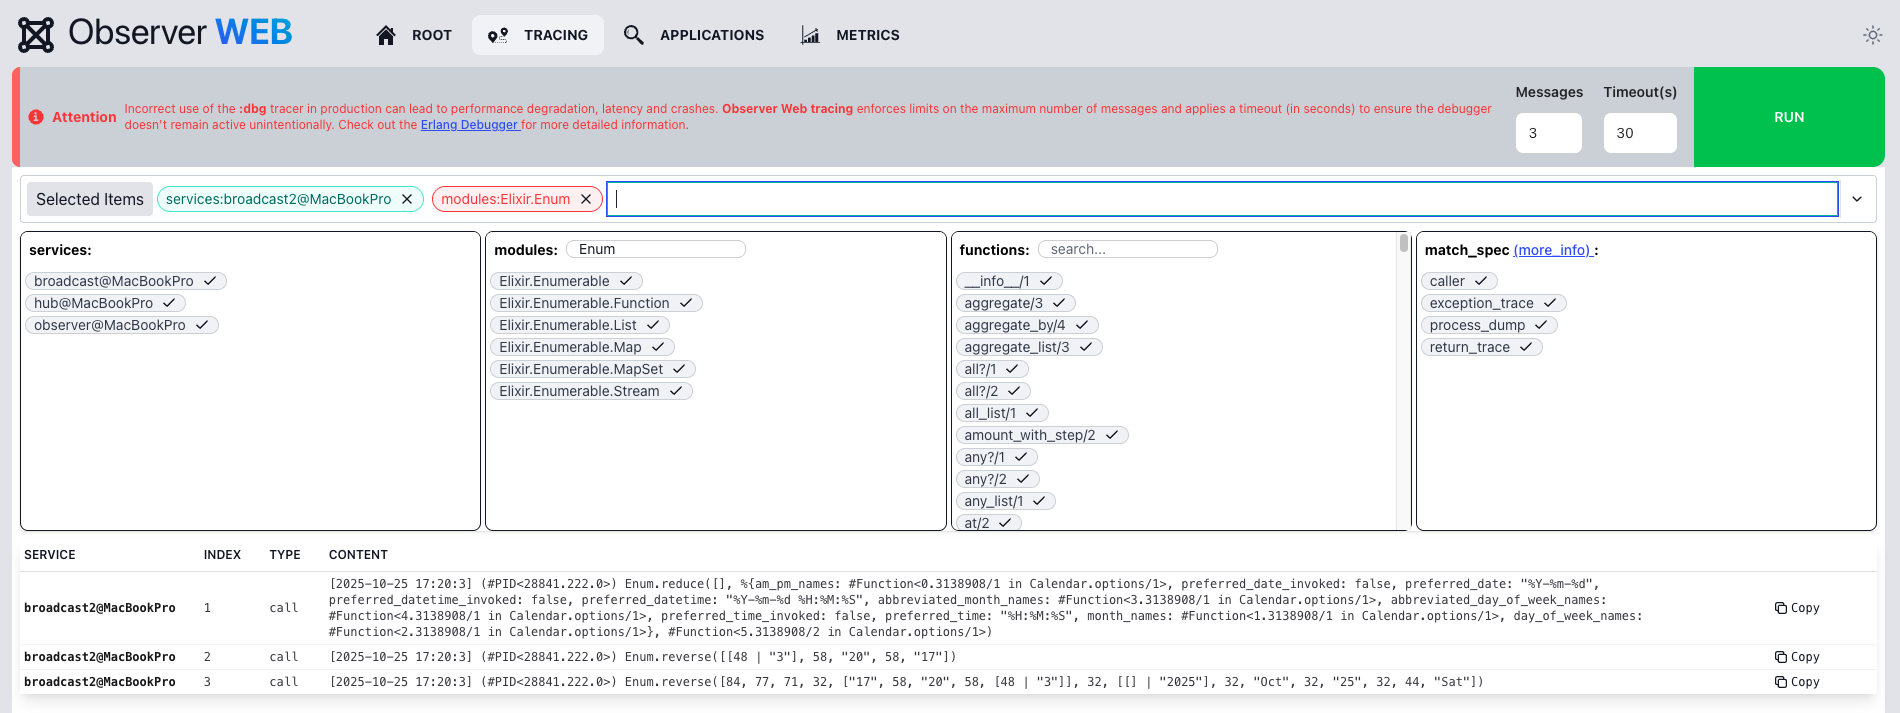
Distributed tracing safe to use in production
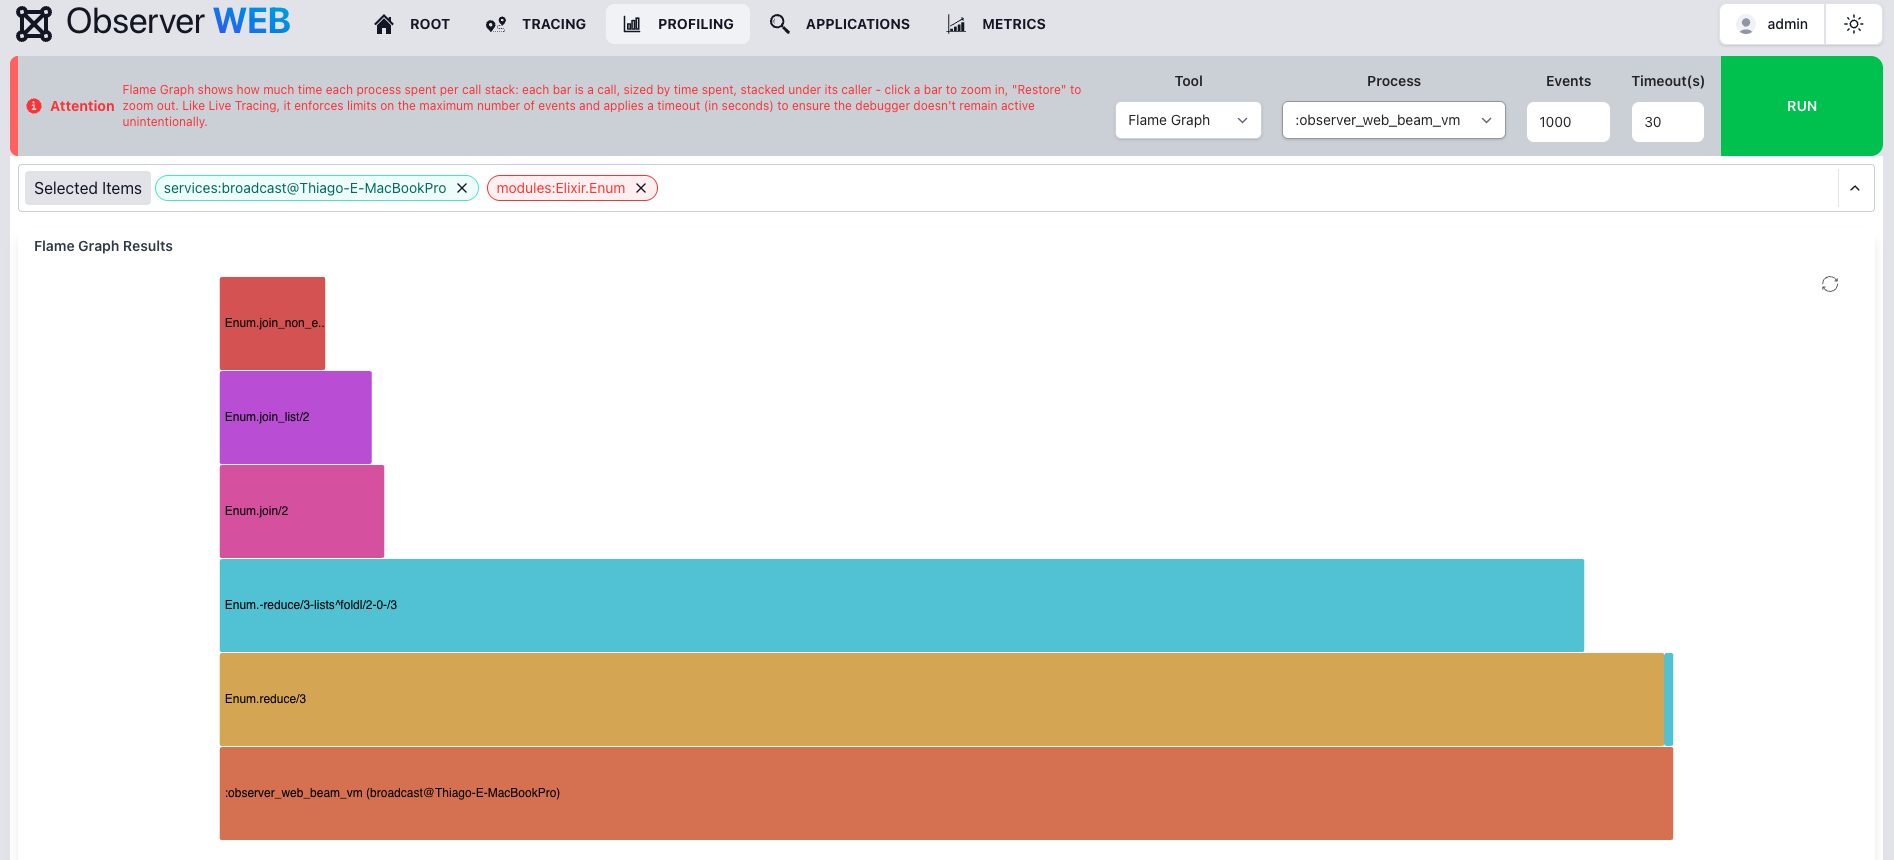
Function profiling with Count, Duration, Call Sequence and Flame Graph tools
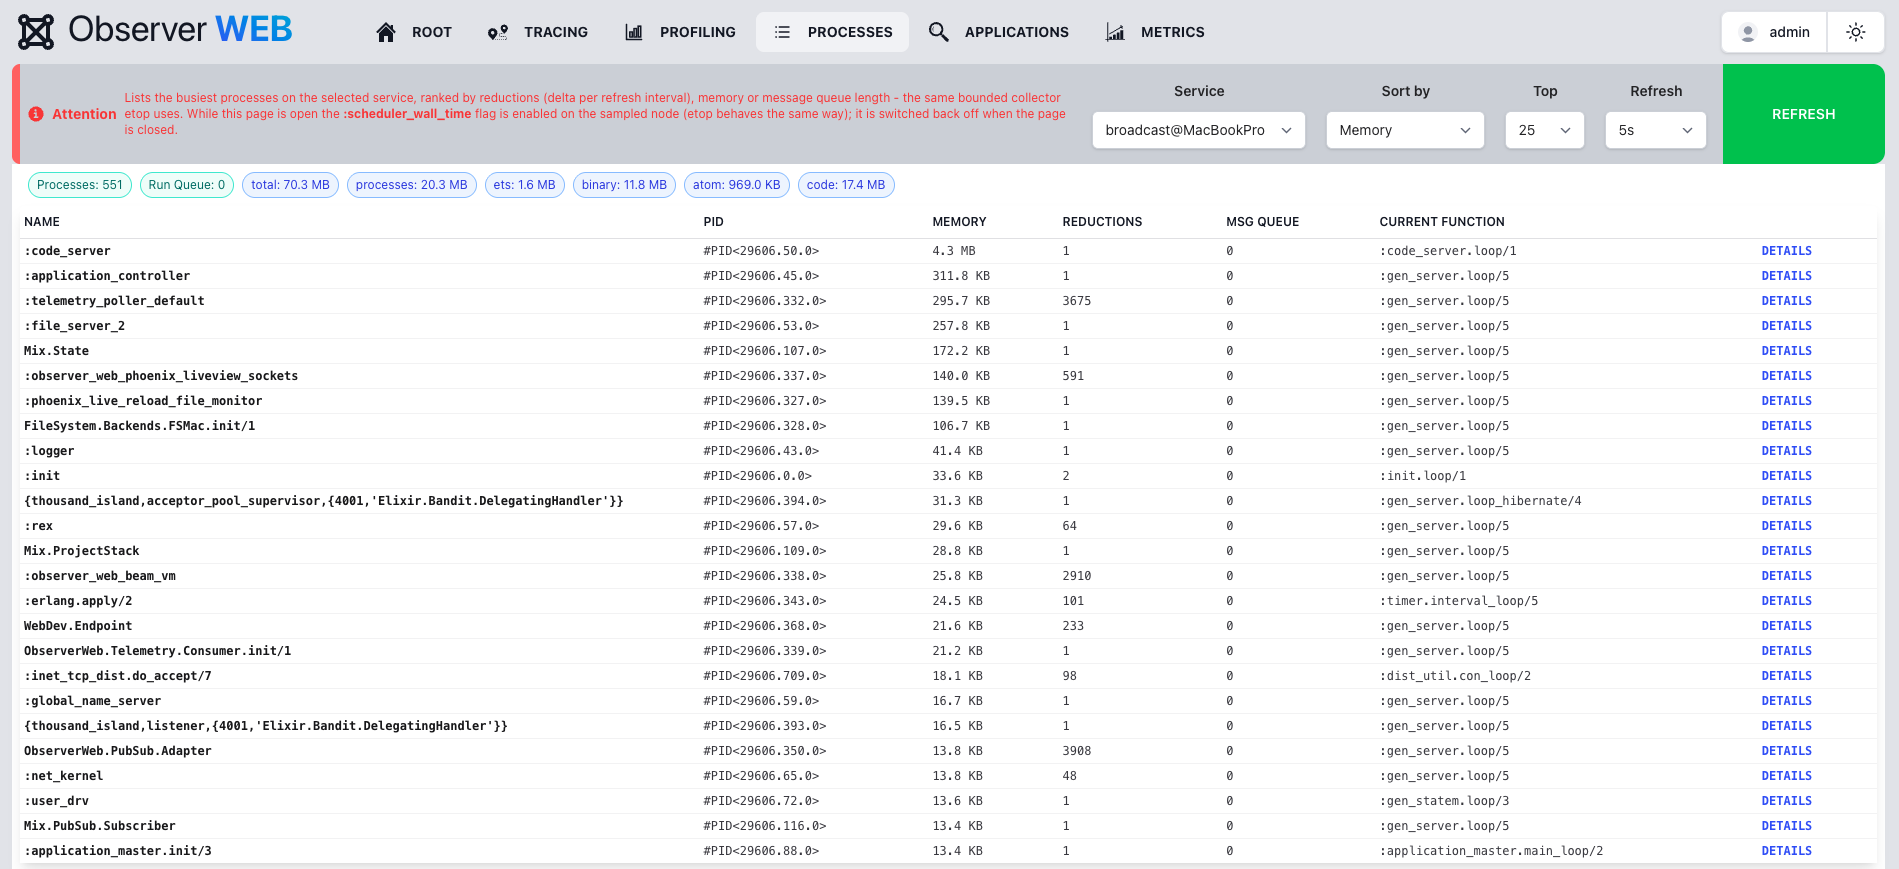
Busiest processes ranked by reductions, memory or message queue (etop style)
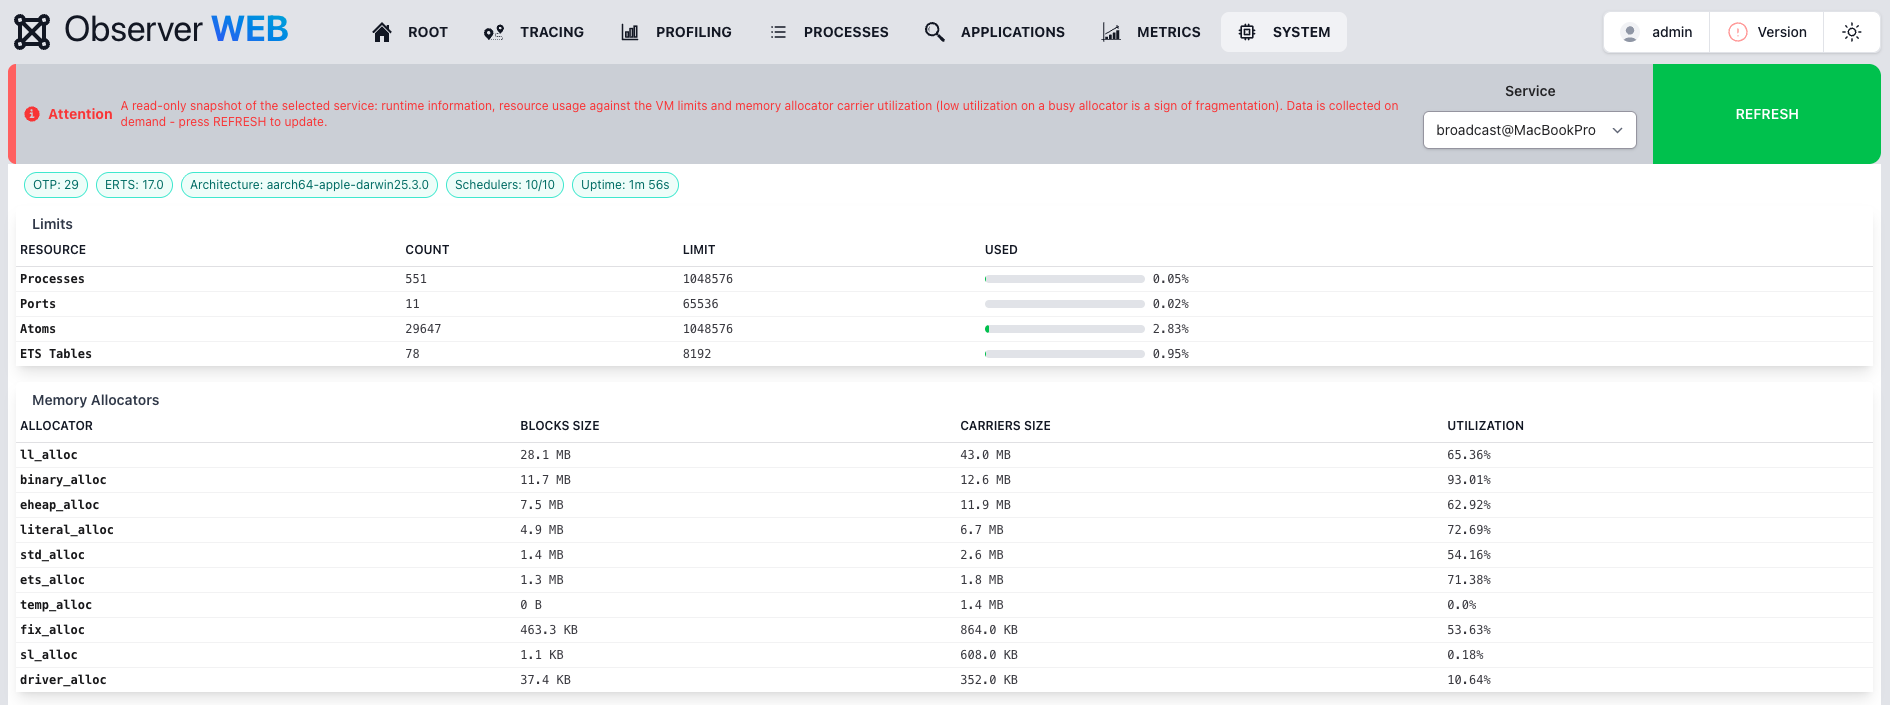
System snapshot with VM limits, memory allocator utilization and OS data (os_mon)
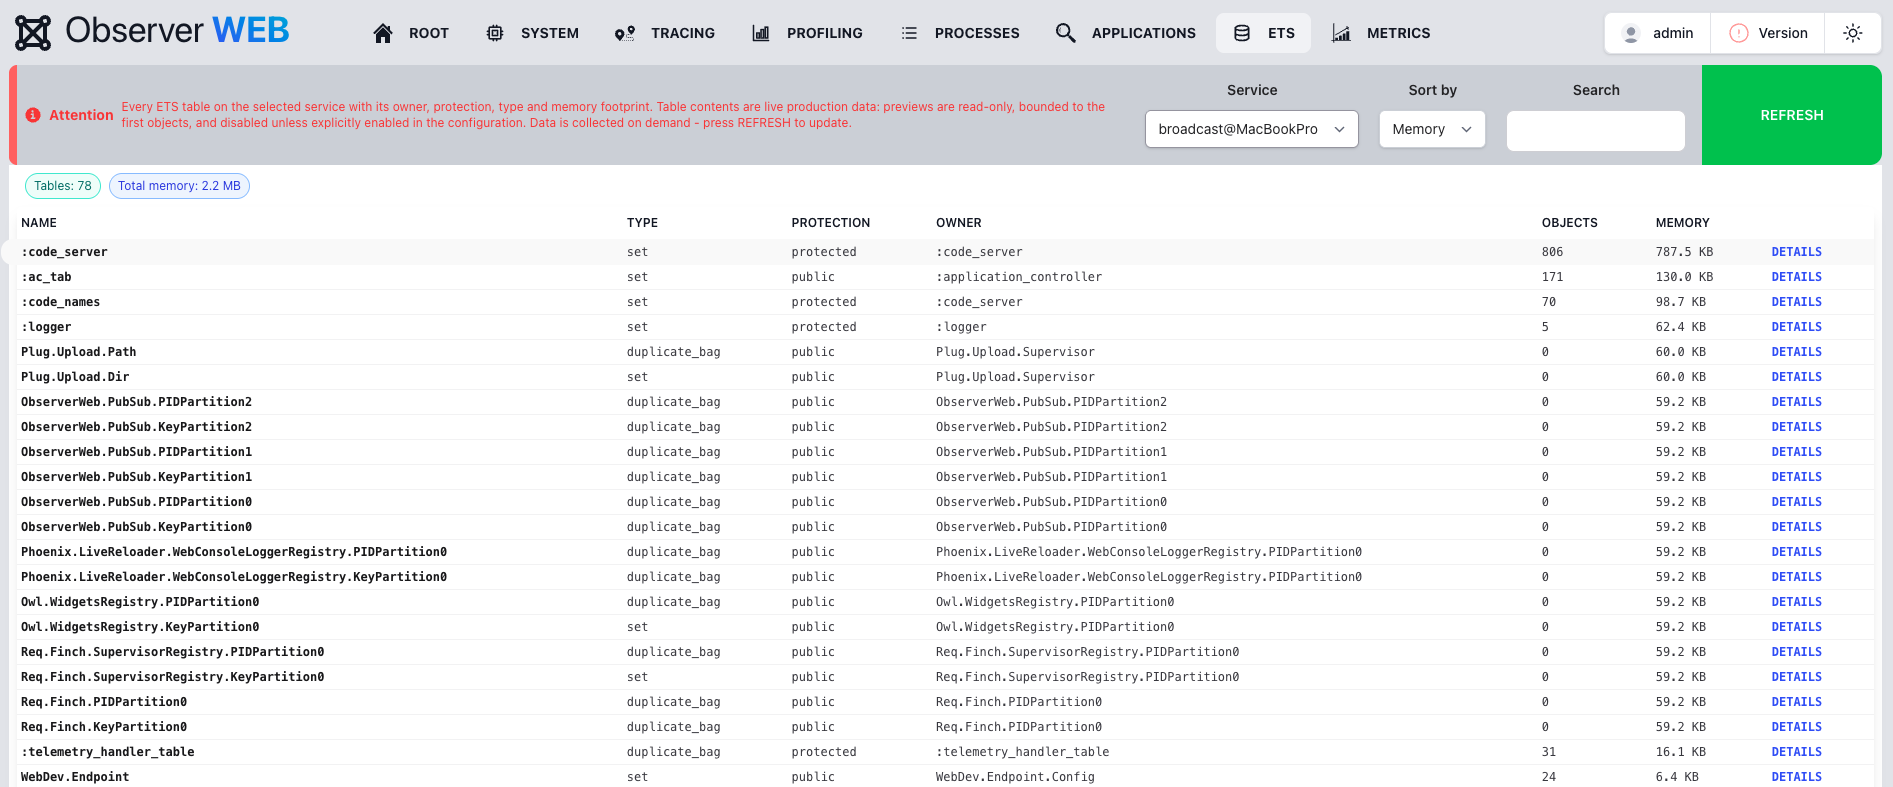
ETS and Mnesia table browser with optional bounded content previews
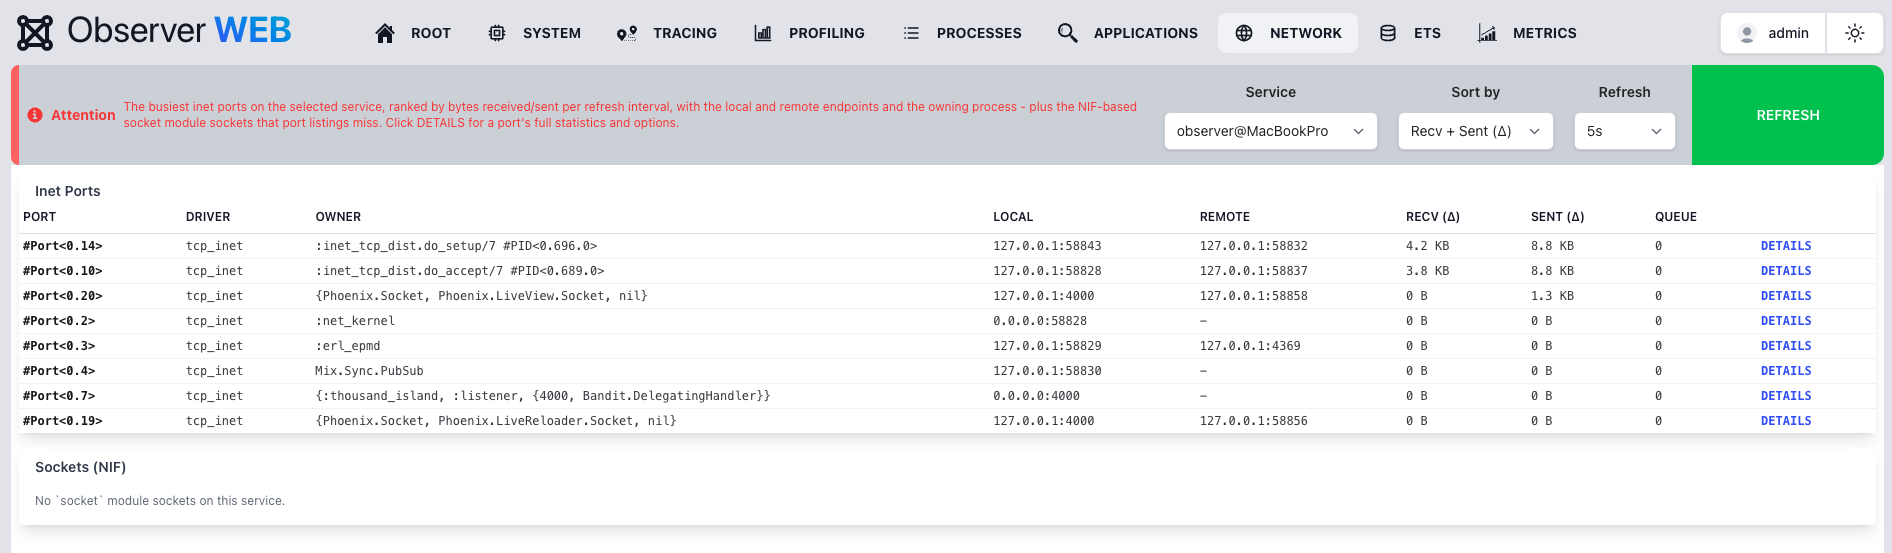
Busiest network connections ranked by throughput, including NIF sockets
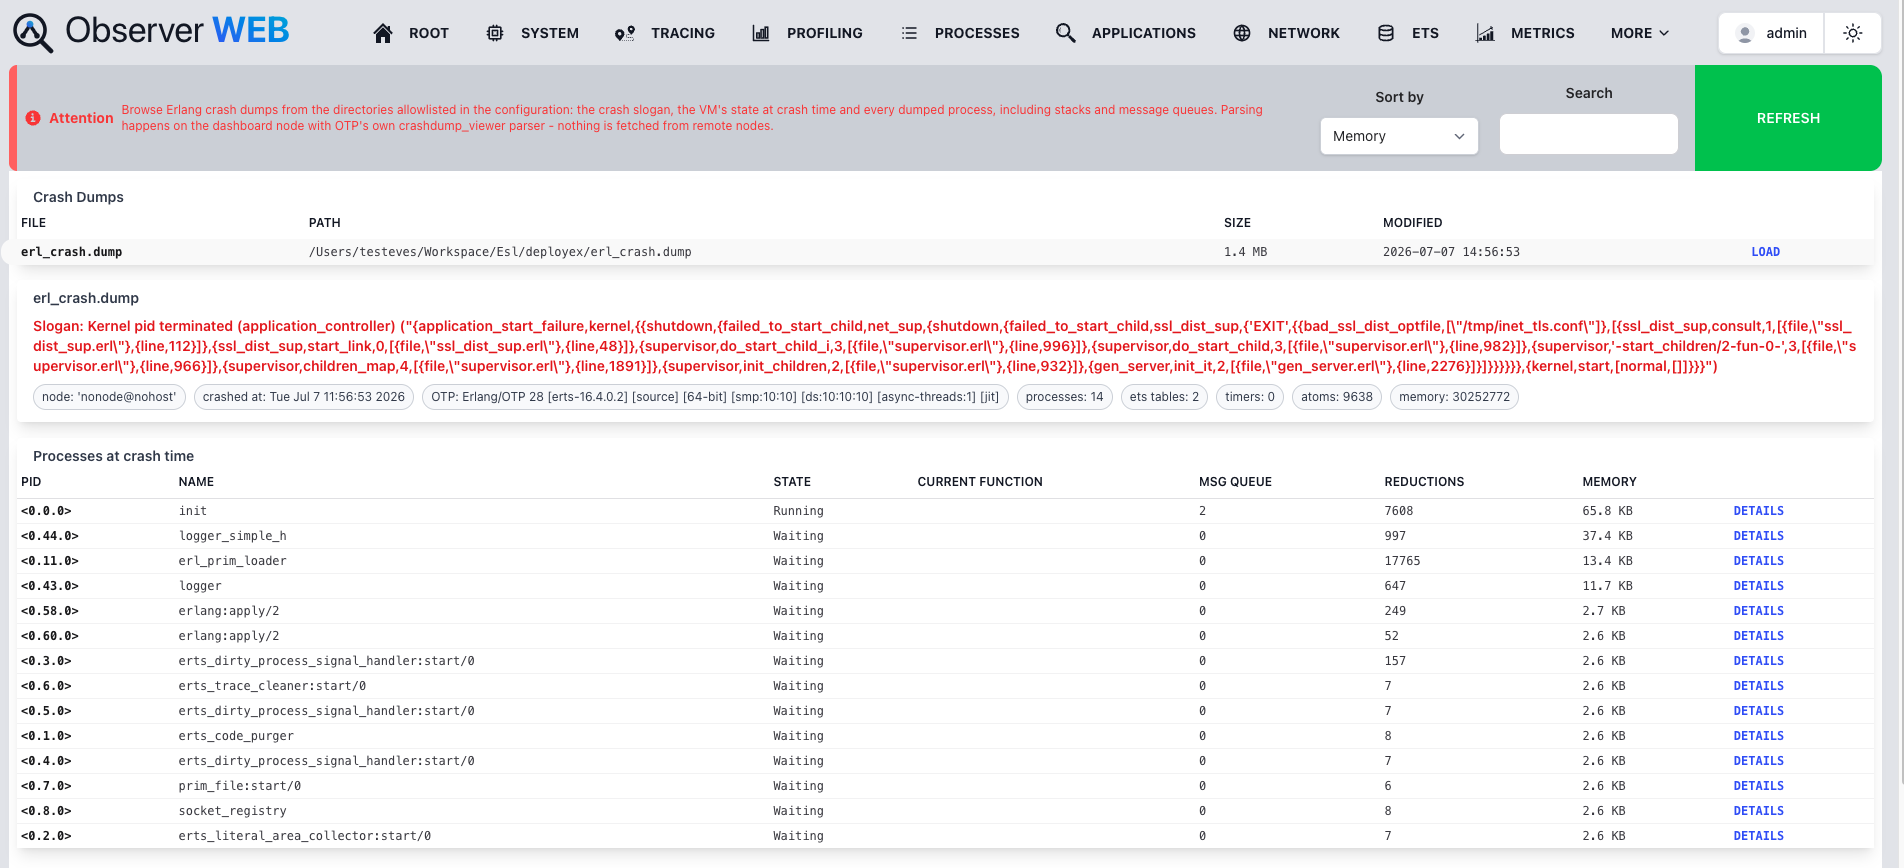
Crash dump browser (upload or host dirs): slogan, VM state and every dumped process
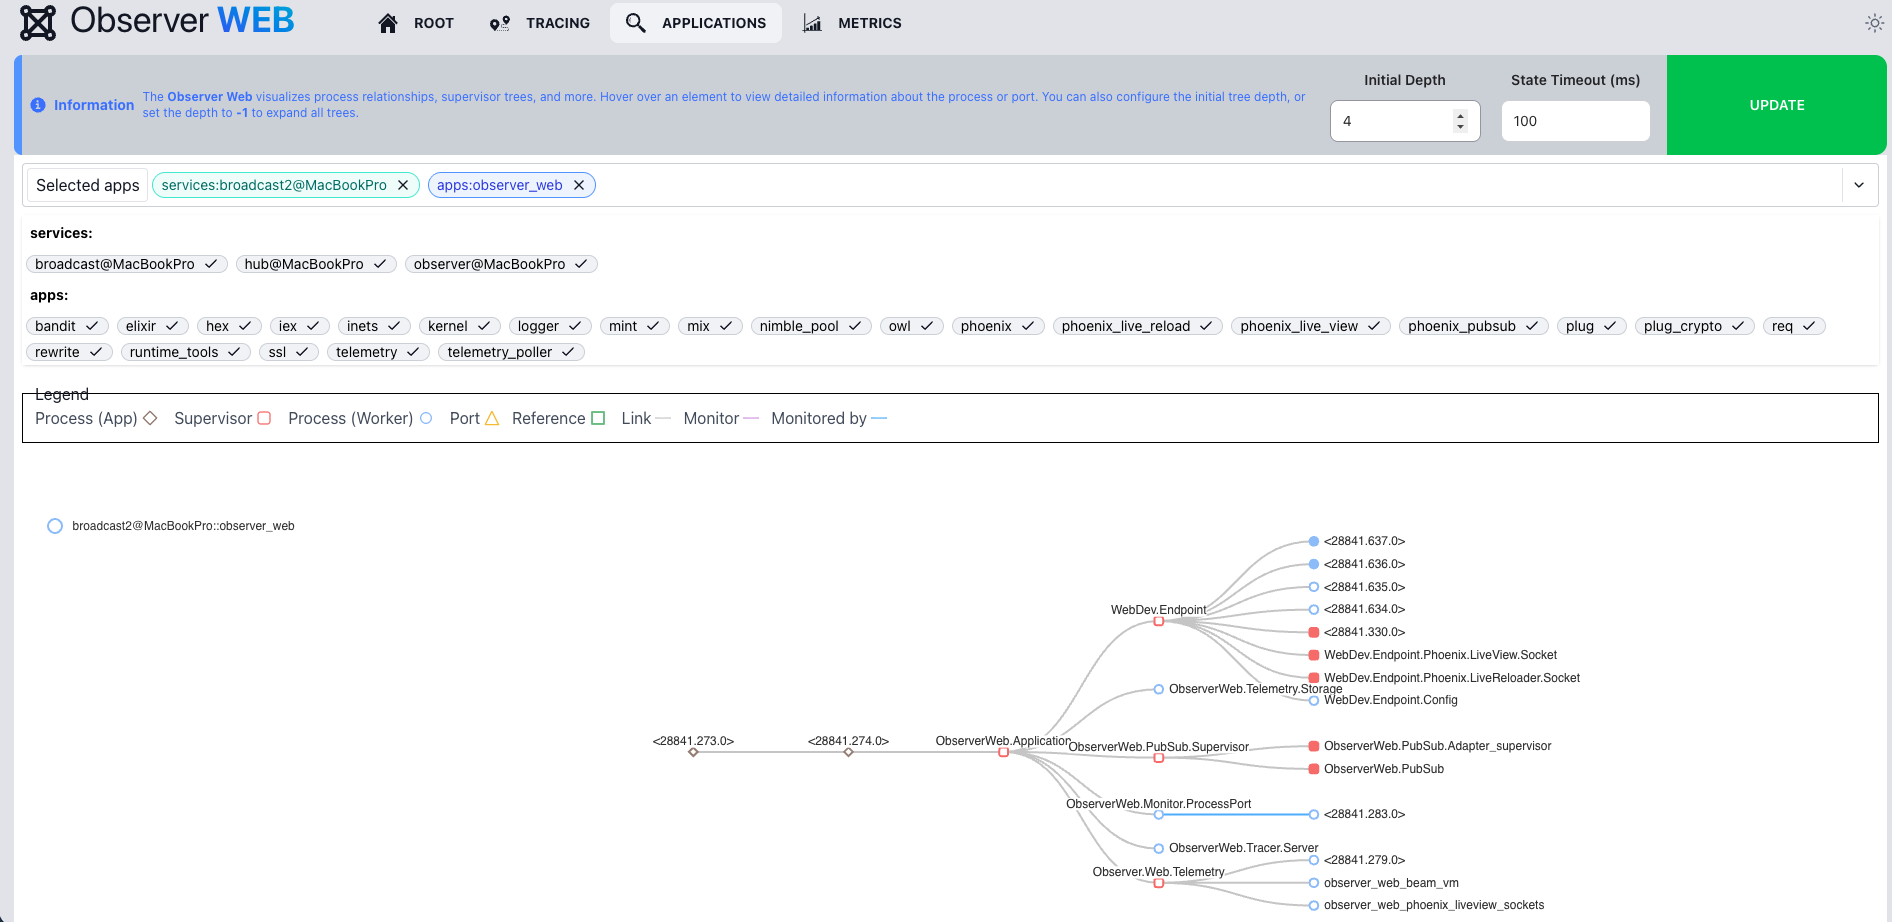
Application topology view with per-app summary, processes, ports, links and relations.
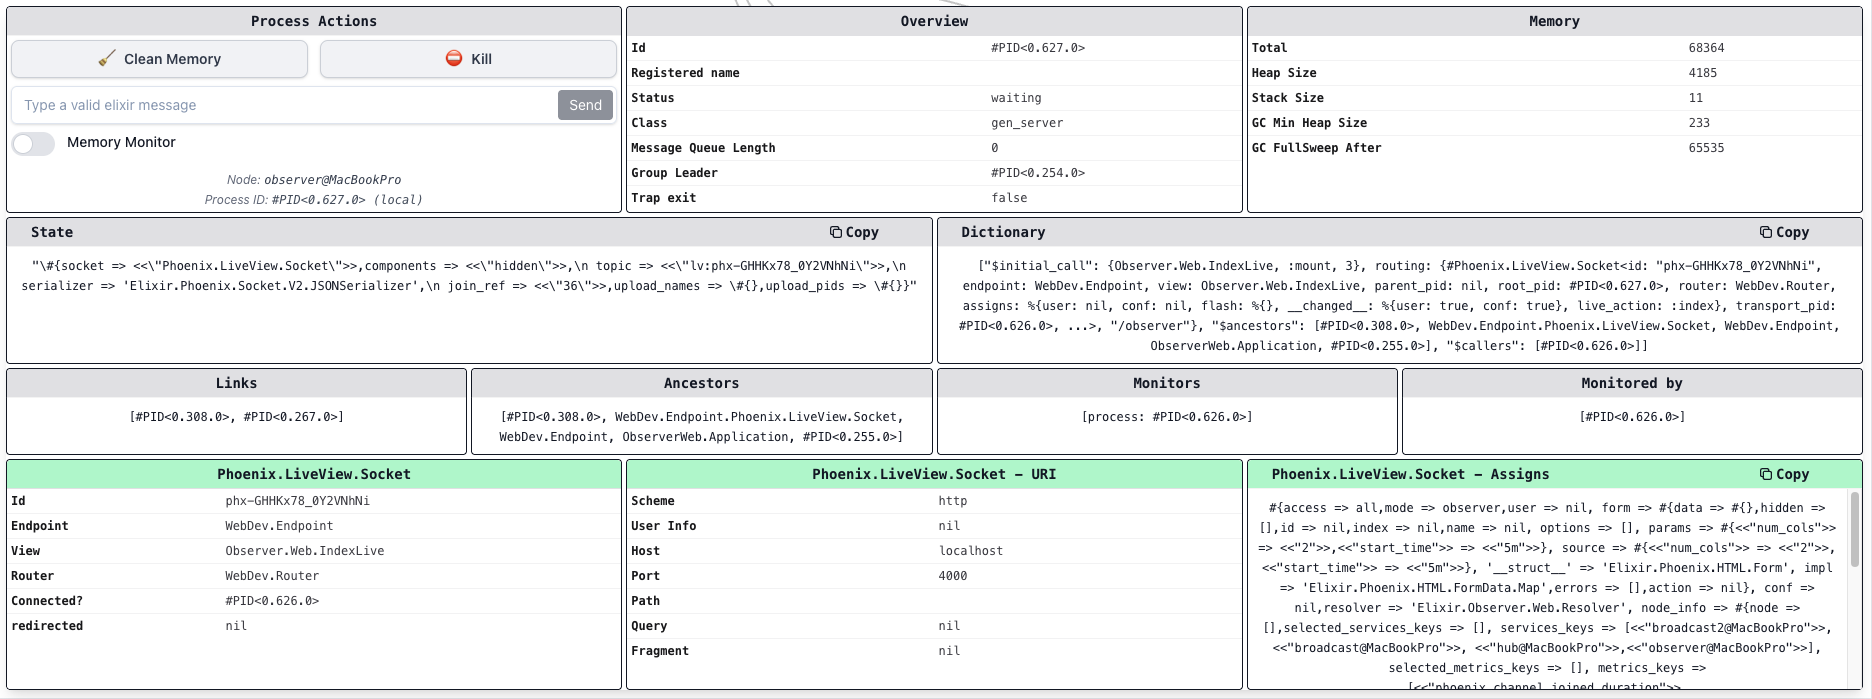
Process inspector with actions (send messages, kill, GC, memory monitoring)
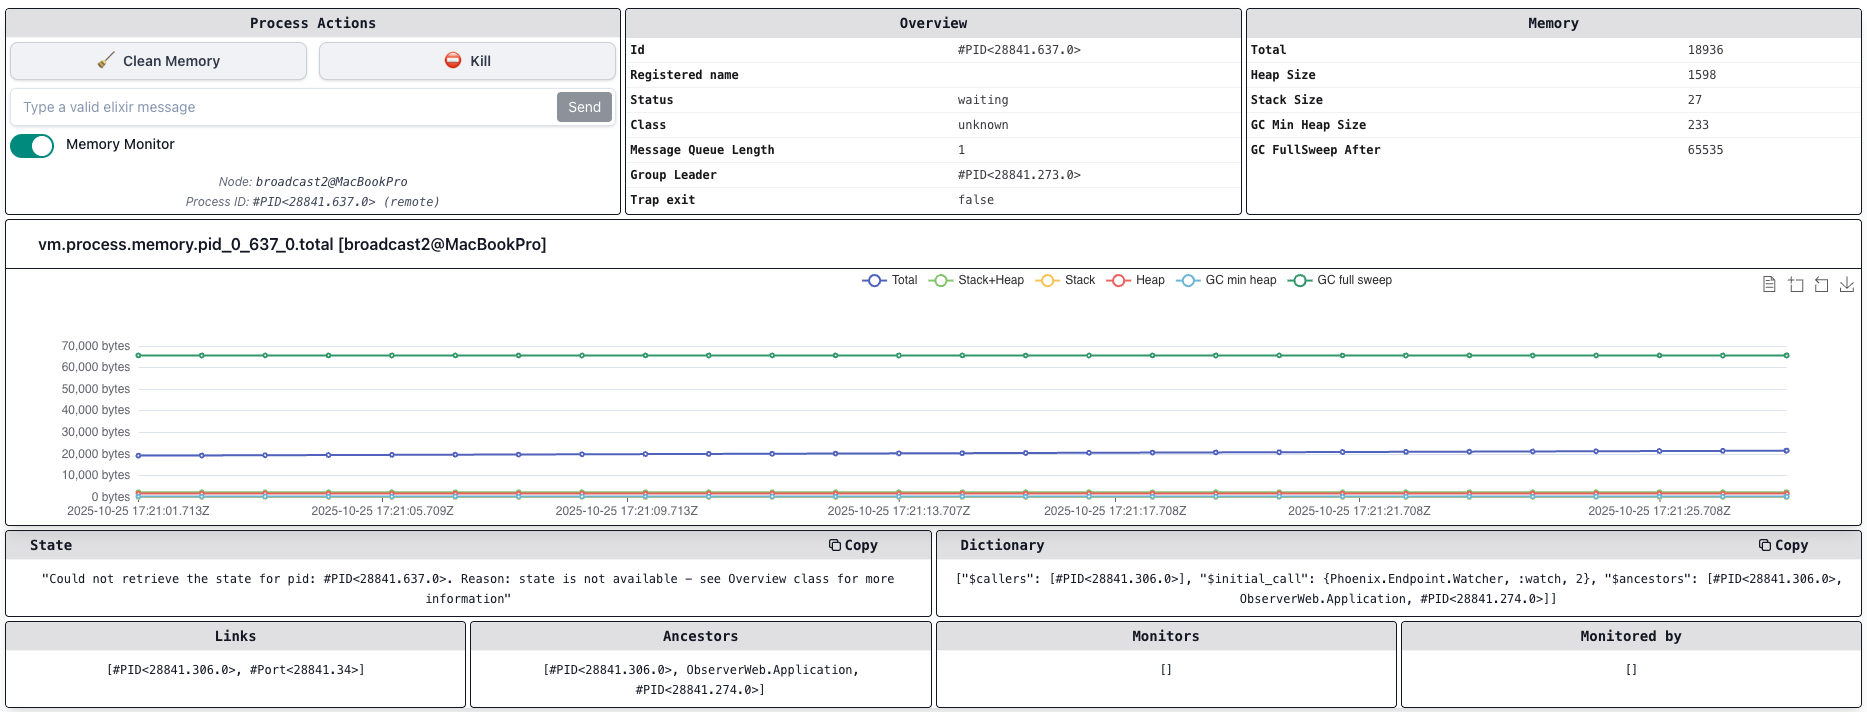
LiveView-specific debugging and state inspection
Port inspector with close and memory monitoring capabilities

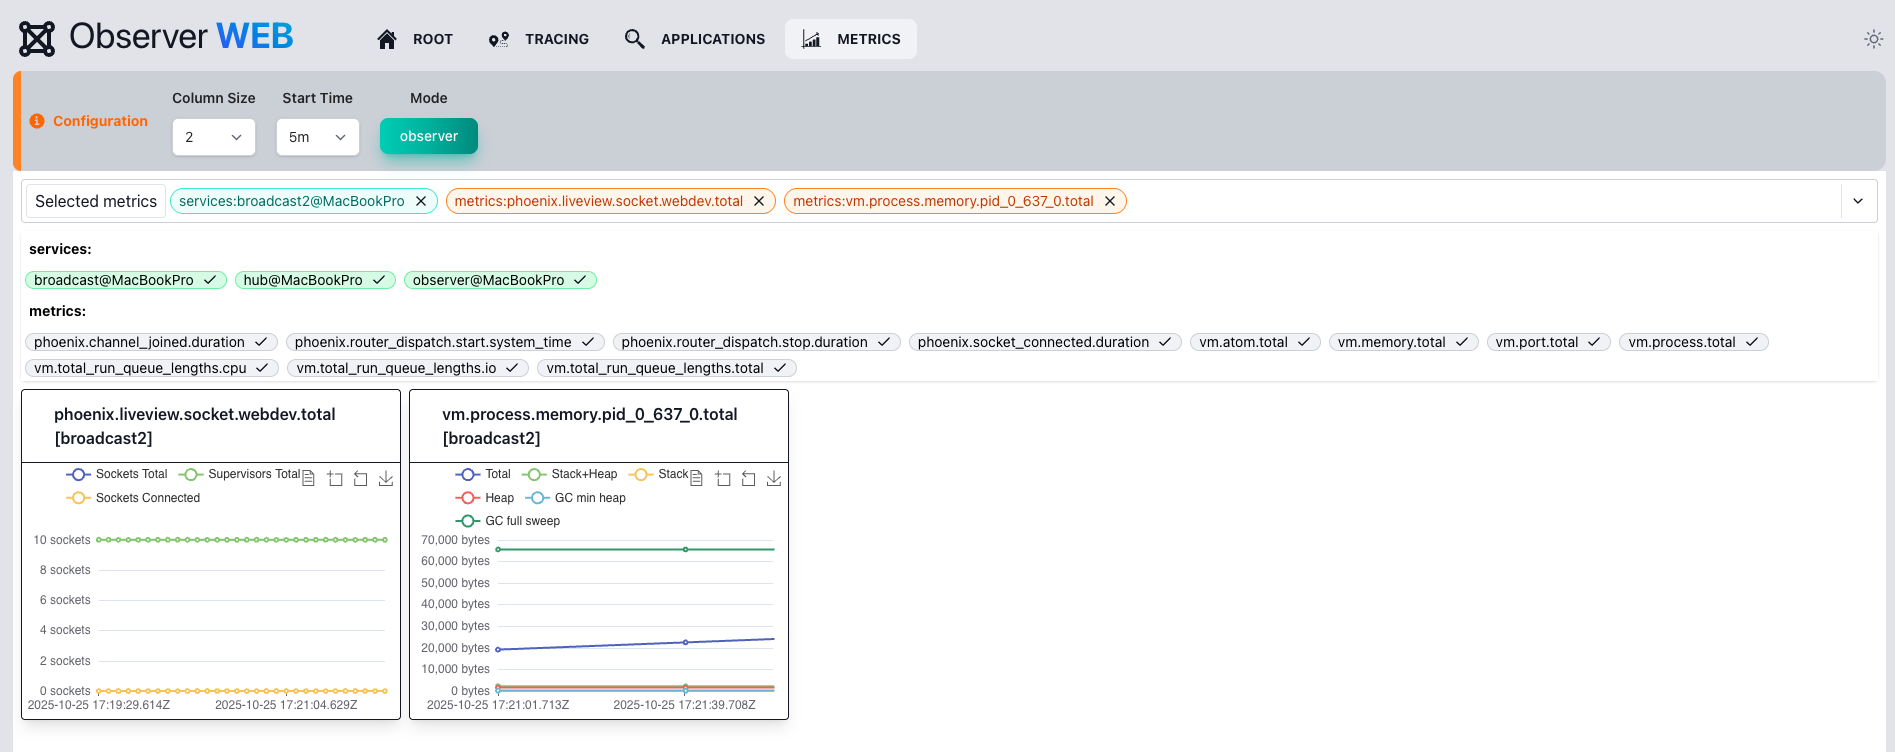
Real-time VM metrics across all distributed nodes
Installation in your App
See the installation guide for details on installing and Configuring.
Running Observer Web as standalone (for testing and development)
Download dependencies
mix deps.get
Fetch and Compile assets
mkdir -p priv/static && touch priv/static/app.css && touch priv/static/app.js
cd assets/
npm install
cd ..
mix assets.build
Run the application for development
Since Observer Web uses the OTP distribution, it is required to have a name when running.
elixir --sname observer -S mix run --no-halt dev.exs
Now you can visit localhost:4000/observer from your browser.
Run multiple nodes with Metric Hub configuration
- Start the nodes
Open a new terminal (Terminal 1) and run the application in observer mode:
export PORT=4000
export OBSERVER_WEB_TELEMETRY_MODE=observer
elixir --sname observer --cookie cookie -S mix run --no-halt dev.exs
Open a new terminal (Terminal 2) and run the application in broadcast mode:
export PORT=4001
export OBSERVER_WEB_TELEMETRY_MODE=broadcast
elixir --sname broadcast --cookie cookie -S mix run --no-halt dev.exs
- Connect the nodes
Open a new terminal (Terminal 3) and run:
iex --sname hub --cookie cookie -S mix phx.server
After the Phoenix server starts, you'll see the Elixir interactive shell prompt. Connect the nodes by executing these commands:
# Connect to the observer node
{:ok, hostname} = :inet.gethostname()
Node.connect(:"observer@#{hostname}")
# Should return: true

# Connect to the broadcast node
{:ok, hostname} = :inet.gethostname()
Node.connect(:"broadcast@#{hostname}")
# Should return: true
You can close the Terminal 3 if you want, this terminal is only for supporting the node connection.
To verify everything is working properly:
- Visit
localhost:4000/observer/metricsin your browser to confirm the application is running inobservermode. - Visit
localhost:4001/observer/metricsto confirm the application is running inbroadcastmode.
You can now explore the observer mode, checking that the data is persisted even if the other app in
broadcast mode restarts.
Connecting to a remote node (e.g. a device on the network)
To observe any remote node - a Nerves device, a server, or another machine on the network -
rather than another local dev instance, set OBSERVER_WEB_DEV_CONNECT_NODE to that node's full
name before starting the dev server.
dev.exs connects to it automatically on boot, so no interactive shell is needed:
OBSERVER_WEB_DEV_CONNECT_NODE=<remote-node>@<remote-hostname> elixir --name observer@<your-hostname> --cookie cookie -S mix run --no-halt dev.exs
A few things this depends on:
- The target's node name must match exactly, including its hostname suffix - a mismatch (e.g. a different domain suffix, or an IP address instead of the registered hostname) silently connects to a nonexistent node and fails.
--name(not--sname) is required whenever either side has a dotted hostname, since Erlang distribution requires both nodes to use the same short-name/long-name mode.--cookiemust match the cookie the remote node is actually running with; check it there viaNode.get_cookie().- Both sides need network access to each other's
epmd(port4369by default).
☕ Support the project
ObserverWeb is free and open source. If it's useful to you, consider supporting its development:
- GitHub Sponsors: github.com/sponsors/thiagoesteves
- BTC Wallet Address:
bc1q3f5eyg2qlun6dc4l597yuyygmkh2qvklwecw8r - ETH Wallet Address:
0x151C3A7AE305b3fF385c7EEce72C6c4E23dE05Fa
Contributors


Similar repos


Languages
Elixir
98.1%
JavaScript
1.5%
[Production Safe] Phoenix Liveview Dashboard for Observability including Ports and Processes details, Tracing/Profiling with erlang debugger, Beam VM metrics and much more
See the codeREADME
Observer Web
Observer Web is an easy-to-use tool that integrates into your application, providing enhanced observability. Leveraging OTP distribution, it offers tracing and profiling through the Erlang debugger, along with detailed insights into process/port statuses and Beam VM statistics.
Powered by Phoenix LiveView, it is distributed, lightweight, fully real-time and safe to use in production. This library is part of the DeployEx project.
Check out some of the available features
Distributed tracing safe to use in production
Function profiling with Count, Duration, Call Sequence and Flame Graph tools
Busiest processes ranked by reductions, memory or message queue (etop style)
System snapshot with VM limits, memory allocator utilization and OS data (os_mon)
ETS and Mnesia table browser with optional bounded content previews
Busiest network connections ranked by throughput, including NIF sockets
Crash dump browser (upload or host dirs): slogan, VM state and every dumped process
Application topology view with per-app summary, processes, ports, links and relations.
Process inspector with actions (send messages, kill, GC, memory monitoring)
LiveView-specific debugging and state inspection
Port inspector with close and memory monitoring capabilities
Real-time VM metrics across all distributed nodes
Installation in your App
See the installation guide for details on installing and Configuring.
Running Observer Web as standalone (for testing and development)
Download dependencies
mix deps.get
Fetch and Compile assets
mkdir -p priv/static && touch priv/static/app.css && touch priv/static/app.js
cd assets/
npm install
cd ..
mix assets.build
Run the application for development
Since Observer Web uses the OTP distribution, it is required to have a name when running.
elixir --sname observer -S mix run --no-halt dev.exs
Now you can visit localhost:4000/observer from your browser.
Run multiple nodes with Metric Hub configuration
- Start the nodes
Open a new terminal (Terminal 1) and run the application in observer mode:
export PORT=4000
export OBSERVER_WEB_TELEMETRY_MODE=observer
elixir --sname observer --cookie cookie -S mix run --no-halt dev.exs
Open a new terminal (Terminal 2) and run the application in broadcast mode:
export PORT=4001
export OBSERVER_WEB_TELEMETRY_MODE=broadcast
elixir --sname broadcast --cookie cookie -S mix run --no-halt dev.exs
- Connect the nodes
Open a new terminal (Terminal 3) and run:
iex --sname hub --cookie cookie -S mix phx.server
After the Phoenix server starts, you'll see the Elixir interactive shell prompt. Connect the nodes by executing these commands:
# Connect to the observer node
{:ok, hostname} = :inet.gethostname()
Node.connect(:"observer@#{hostname}")
# Should return: true

# Connect to the broadcast node
{:ok, hostname} = :inet.gethostname()
Node.connect(:"broadcast@#{hostname}")
# Should return: true
You can close the Terminal 3 if you want, this terminal is only for supporting the node connection.
To verify everything is working properly:
- Visit
localhost:4000/observer/metricsin your browser to confirm the application is running inobservermode. - Visit
localhost:4001/observer/metricsto confirm the application is running inbroadcastmode.
You can now explore the observer mode, checking that the data is persisted even if the other app in
broadcast mode restarts.
Connecting to a remote node (e.g. a device on the network)
To observe any remote node - a Nerves device, a server, or another machine on the network -
rather than another local dev instance, set OBSERVER_WEB_DEV_CONNECT_NODE to that node's full
name before starting the dev server.
dev.exs connects to it automatically on boot, so no interactive shell is needed:
OBSERVER_WEB_DEV_CONNECT_NODE=<remote-node>@<remote-hostname> elixir --name observer@<your-hostname> --cookie cookie -S mix run --no-halt dev.exs
A few things this depends on:
- The target's node name must match exactly, including its hostname suffix - a mismatch (e.g. a different domain suffix, or an IP address instead of the registered hostname) silently connects to a nonexistent node and fails.
--name(not--sname) is required whenever either side has a dotted hostname, since Erlang distribution requires both nodes to use the same short-name/long-name mode.--cookiemust match the cookie the remote node is actually running with; check it there viaNode.get_cookie().- Both sides need network access to each other's
epmd(port4369by default).
☕ Support the project
ObserverWeb is free and open source. If it's useful to you, consider supporting its development:
- GitHub Sponsors: github.com/sponsors/thiagoesteves
- BTC Wallet Address:
bc1q3f5eyg2qlun6dc4l597yuyygmkh2qvklwecw8r - ETH Wallet Address:
0x151C3A7AE305b3fF385c7EEce72C6c4E23dE05Fa
Similar repos
Contributors
Languages
Elixir
98.1%
JavaScript
1.5%