
Graph-grounded verification of LLM-generated root cause analysis for Kubernetes. 18 scenarios, 54 runs, 1,950 claims — with a negative result: graph provenance does not predict claim correctness.
Python
0
76 commits
updated Sep 1, 2026
README
🚀 CloudGraph
Graph-Grounded Verification of LLM-Generated Root Cause Analysis for Kubernetes
CloudGraph builds a temporal knowledge graph from live cluster telemetry, retrieves incident context over it, has five specialist LLM agents diagnose the incident, and then — the part this project is actually about: checks every claim in the generated explanation against graph evidence.
The research question is not "can an LLM write a plausible root cause?" It is "can we tell whether it made that up?"













Experiment 1 · 18 RCAEval RE2 scenarios × 3 conditions · 54 runs · 1,950 claims · 135 tests
📌 Overview
Large language models write fluent incident explanations. They also invent them. CloudGraph is a system and a study for telling the two apart.
It ingests Loki logs, Kubernetes objects and Git/Argo CD events into a temporal property graph (Neo4j), retrieves incident context by k-hop traversal fused with dense vectors (Qdrant), runs five specialist agents over that context, and then scores every atomic claim in the resulting narrative two independent ways:
- GPCS (Graph-Provenance Claim Scoring) — evidence-grounded: is this claim supported by the incident graph? Costs no extra model calls.
- Self-consistency — model-internal: does this claim recur when the model is sampled again? Costs two extra full generations.
Comparing those two verifiers, on real chaos-injected telemetry, is the experiment.
Two properties of the implementation that bound how the results read.
Metrics are synthetic on the live-cluster path. Experiment 1 seeds real RCAEval telemetry into its
Metricnodes (services/api/app/demo/seeding.py), so its metric evidence is measured data. Experiment 2 has no such source: everyMetricnode there is produced by_simulate_pod_metrics()(services/api/app/adapters/k8s_discovery.py:236), which generates values withrandom.uniform(). A Prometheus ingestion endpoint exists (POST /api/v1/telemetry/metrics) but nothing calls it and no metrics-server is deployed, so no metric figure in an Experiment 2 diagnosis reflects measured telemetry. Metric evidence is excluded from retrieval and from provenance scoring in Experiment 2 for that reason.GPCS's semantic term is a constant in Experiment 1. Its evidence comes from graph traversal, which assigns a fixed score (
0.75within two hops,0.6beyond) rather than a measured similarity. The trust score is therefore determined by graph reachability:0.45×0.75 + 0.35×0.50 + 0.25×0.81 − 0.15×0.05 = 0.7075 ≈ 0.708, which is the value taken by 85 of the 1,950 claims. Read those results as measuring reachability, not semantic provenance.
The headline result is a measurement, not a win. Only 4.8% of the claims an LLM generates about an incident can be adjudicated at all using standard RCA benchmark metadata. That ceiling — not the choice of verifier — is what binds this whole line of work, and it applies to any claim-level verifier evaluated this way.
| Evaluation | 18 RCAEval RE2 scenarios × 3 retrieval conditions · 54 runs · 1,950 claims |
| Adjudicable | 93 of 1,950 claims (4.8%) |
| Tests | 135 |
| Deployment | Kubernetes via Helm — verified on kubeadm and OrbStack |
🧪 Two experiments, two different jobs
experiment-1-benchmark/ | experiment-2-live-demo/ | |
|---|---|---|
| Purpose | measure verification | demonstrate the pipeline |
| Evidence comes from | an RCAEval file, seeded into the stores | the real cluster, via the ingestion pipeline |
| Exercises ingestion? | no | yes |
| Ground truth | labelled, 1,950 claims | known but unlabelled |
| Scale | 18 faults x 3 conditions = 54 runs | 1 fault |
| Produces results? | yes — every number in this README | no |
flowchart TB
    subgraph E1["Experiment 1 — benchmark (all results)"]
        direction TB
        F["RCAEval RE2 file<br/><small>26 observations per scenario</small>"] --> S["seed into Neo4j + Qdrant"]
        S --> R1["retrieve<br/><small>scenario-scoped</small>"]
    end
    subgraph E2["Experiment 2 — live demo (no results)"]
        direction TB
        K["real Kubernetes cluster"] --> I["ingestion pipeline<br/><small>discovery + pod logs</small>"]
        I --> G[("Neo4j + Qdrant")] --> R2["retrieve<br/><small>unscoped</small>"]
    end
    R1 --> P["5 agents -> consensus -> atomic claims"]
    R2 --> P
    P --> V["GPCS + self-consistency"]
    V --> L["labelled ground truth<br/><i>Experiment 1 only</i>"]

    classDef e1 fill:#dbeafe,stroke:#1d4ed8,color:#172554
    classDef e2 fill:#dcfce7,stroke:#15803d,color:#052e16
    class F,S,R1 e1
    class K,I,G,R2 e2
No data from the host cluster reaches any prompt in Experiment 1. Its telemetry is seeded from a file and torn down after each run. That is deliberate: incidents on a live cluster have no labelled ground truth, so claim correctness could not be scored; and holding the evidence pool constant is what lets a difference in outcome be attributed to retrieval strategy rather than to which data happened to exist.
The consequence is that Experiment 1 measures evidence selection, not evidence discovery. Experiment 2 exists to exercise the ingestion pipeline that Experiment 1 deliberately bypasses — it demonstrates, and measures nothing.
📊 Results & Key Findings
Every number below is derived from the 54 run logs across 18 benchmark scenarios. Full analysis is detailed in experiment-1-benchmark/results/EXPERIMENT_FINAL_RESULTS.md.
1. Retrieval Condition Breakdown (NONE vs RAW vs HYBRID)
| Metric | NONE (No Context) | RAW (Full Dump) | HYBRID (Ranked Graph) | Takeaway |
|---|---|---|---|---|
| Total Claims Extracted | 628 | 703 | 619 | HYBRID: fewest claims (36.1/run pooled). |
| GPCS Unsupported % (Pooled) | 78.3% | 80.1% | 79.3% | Flat across conditions. |
| Self-Consistency Unsupported % | 57.0% | 49.2% | 53.3% | RAW: highest recurrence. |
| Mean Request Payload | 1,651 ch | 27,406 ch | 13,196 ch | HYBRID: 51.9% smaller than RAW. |
| Evaluable Correctness Coverage | 4.8% (30/628) | 3.6% (25/703) | 6.1% (38/619) | HYBRID: most adjudicable claims. |
| Consistent : Contradicted | 14 : 16 | 10 : 15 | 12 : 26 | NONE: best ratio; HYBRID worst. |
2. Does either verifier track correctness?
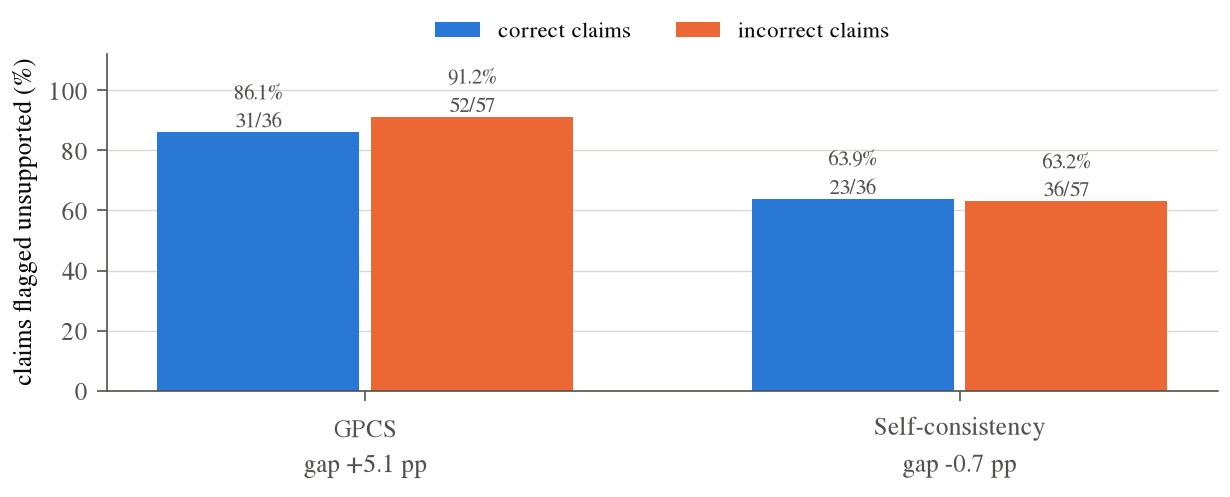
Figure 1 — Neither verifier separates correct claims from incorrect ones. A verifier that worked would show a tall orange bar beside a short blue one. GPCS flags incorrect claims 5.1 pp more often than correct ones (about three claims); self-consistency flags them 0.7 pp less often. Counts appear beneath each percentage — the 93 adjudicable claims split 36 correct / 57 incorrect.
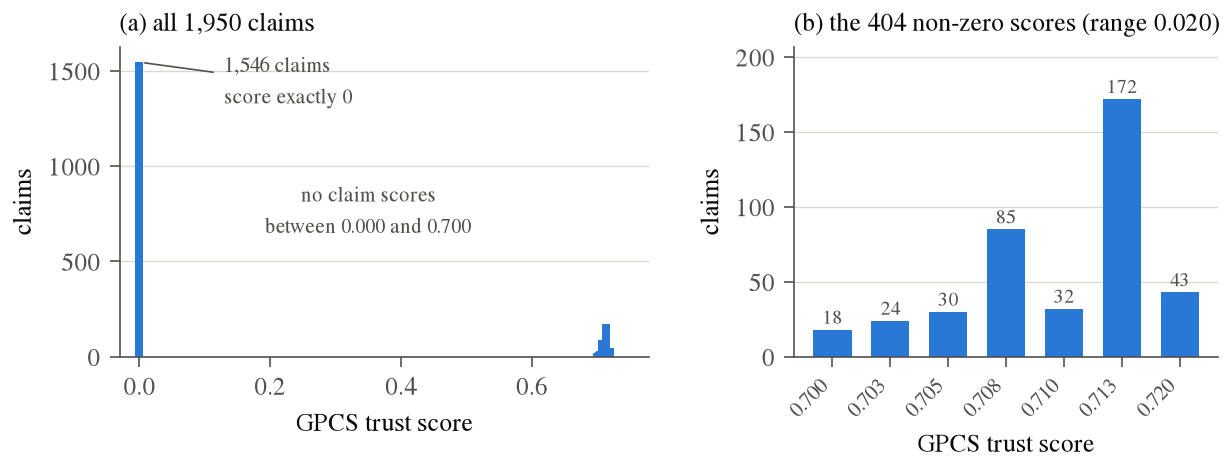
Figure 2 — The trust score is a gate, not a graded confidence. Across 1,950
claims it takes only eight distinct values. 1,546 sit at exactly 0.000, and
nothing at all falls between 0.000 and 0.700; the 404 non-zero scores occupy
a band 0.020 wide. This is the mechanism behind Figure 1 — a threshold cannot be
tuned on a distribution with this shape.
3. Research Questions (RQ) Support Matrix
The project has one research-question register, RQ1-RQ7, defined in
docs/PROJECT_EXPLAINED.md. Every verdict below
comes from the 18-scenario evaluation, which computes no inferential statistics
- no verdict here rests on a p-value or a confidence interval.
| RQ | Question | Verdict |
|---|---|---|
| RQ1 | Does GPCS behave differently from self-consistency, and does either flag track claim correctness? | Partly against. Distinct - 79.3% vs 53.0% unsupported, stricter in all 54 runs. But on 93 adjudicable claims neither tracks correctness (GPCS +5.1 pp at 0.627 precision, SC -0.7 pp at 0.610, base rate 0.613). |
| RQ2 | Is the measured result real end-to-end, not an artefact of a simulated scorer? | Yes. 54/54 runs completed, zero fallbacks or timeouts, paired verdicts for all 1,950 claims, deterministic labeller, claims.csv regenerable by committed script. |
| RQ3 | Does graph-structured retrieval beat dumping all evidence into context? | Cost win only. HYBRID cuts the request payload 51.9% vs RAW and gives the best evaluable coverage (6.1%), but the worst consistent:contradicted ratio (12:26). No accuracy advantage. |
| RQ4 | Is any retrieval benefit symbolic-structural or neural-semantic? | Not measured. No retrieval ablation was run. Highest-value experiment outstanding. |
| RQ5 | Does the five-agent architecture beat a single model at matched compute? | Deferred to v2. |
| RQ6 | Are the confidence scores calibrated, and would fitted weights beat hand-set ones? | Deferred to v2. |
| RQ7 | Which claim types are each verifier's blind spot? | Deferred to v2 - 4.8% coverage is still too thin to stratify. |
What the evaluation establishes operationally - engineering results, not research claims: the pipeline runs reliably end-to-end across 54 runs and 1,057 LLM calls with zero failures; GPCS supplies an evidence gate at zero additional LLM cost against self-consistency's 2 extra generations per claim; and requiring both verifiers to accept keeps just 308 of 1,950 claims — an 84.2% reduction in volume.
4. The five hypotheses
The project rests on five claims. Four are supported; one is refuted — and the refuted one is the claim the whole design was built on.
| # | Hypothesis | Verdict | Evidence |
|---|---|---|---|
| H1 | An operational system already carries a real dependency graph, obtainable free rather than at extra cost. | ✅ Supported | All 54 runs built a typed property graph from RCAEval telemetry with no annotation step. |
| H2 | The pipeline runs reliably end to end at scale. | ✅ Supported | 54/54 runs completed. Zero fallbacks or timeouts across 1,057 LLM calls and 5.20 h, producing paired verdicts for all 1,950 claims. |
| H3 | A graph can verify generated claims at no additional model cost. | ✅ Supported | GPCS scores every claim by database query at 0 extra LLM calls, against self-consistency's 2 extra generations. It also behaves distinctly: 79.3% unsupported vs 53.0%. |
| H4 | Ranked graph retrieval reduces context cost against dumping all evidence. | ✅ Supported | HYBRID cuts the mean request payload 51.9% (13,196 vs 27,406 chars), produces the fewest claims, and gives the best evaluable coverage (6.1%). |
| H5 | A claim traceable to nearby graph evidence is more likely to be true. | ❌ Refuted | On 93 adjudicable claims GPCS's flag-rate gap is +5.1 pp at precision 0.627 against a 0.613 base rate — the score for flagging everything. Self-consistency is −0.7 pp. |
H5 is the load-bearing one. H1–H4 establish that the graph is free, the system is reliable, verification is cheap and ranked retrieval is cheaper. None of that matters much if traceable evidence does not indicate a true claim — and it does not. Provenance predicts reachability, not truth. That is the finding, and it is negative.
→ Full Pooled Results · Joint-Verifier Comparison · Experiment 1 Methodology
⚠️ What These Results Do Not Establish (Scope & Limitations)
To keep evaluation findings honest and transparent, here is what the results do not claim:
- Strictness ≠ Superior Accuracy: GPCS is stricter than Self-Consistency (rejection rate 79.3% vs 53.0%), but flagging more claims reflects a stricter database evidence gate—not higher accuracy. Across the 22 ground-truth claims, both verifiers differ by only 1 claim net.
- Single-Run Flag Rates Are Not Accuracy: A single scenario run measures verifier strictness, not overall Precision/Recall. True verifier accuracy is evaluated over the combined 6-scenario dataset.
- Fault Diagnosis, Not Service Localization: The benchmark identifies the affected target service (
ts-order-service,carts, etc.) in advance. The system diagnoses how/why the service failed, not which service failed across the cluster. - Coarse Evidence Gate (Binary Thresholding): GPCS trust scores operate as a strict pass/fail evidence gate (79.3% of claims score
0.000because no graph evidence cleared the vector similarity floor), rather than a calibrated continuous confidence score.
⚡ Quick Start
git clone https://github.com/shivamshashank/CloudGraph.git
cd CloudGraph
go build -o cloudgraph ./cmd/cloudgraph
sudo ./cloudgraph deploy
Then open the UI, configure an LLM provider on the Settings page, and run a diagnosis.
- 📖 Installation guide — prerequisites, kubeadm + Helm provisioning, configuration, troubleshooting
- 🏃 Quickstart — deploy in a few minutes
- 🖥️ UI walkthrough — every screen, tab and button, with 14 screenshots from a live deployment against a real LLM
📚 Documentation
Start here
| Document | Describes | |
|---|---|---|
| 🧭 | Project explained | What this is, in plain language |
| 🧮 | Formulas & Framework | Complete formulas, variables, code blocks & literature references |
| ⚙️ | Mechanisms | Every algorithm, with its formula |
| 🔎 | Verification flow | How a claim becomes a verdict |
The experiment
| Document | Describes | |
|---|---|---|
| 🧪 | Experiment 1 | Scenarios, layout, reproduction, pipeline state |
| 📈 | Final results | Pooled and per-scenario |
| ⚖️ | Joint verifier comparison | GPCS and self-consistency used together |
| 🧵 | How the traces work | The runner, the log format, the nine steps |
| 🏷️ | Labelling policy | Pre-registration and the deviation log D-1…D-4 |
Design and architecture
| Document | Describes | |
|---|---|---|
| 🏗️ | Architecture index | Every design doc, marked built vs planned |
| 🗺️ | System overview | Lifecycle, install through investigation |
| 🖼️ | Current architecture | Evaluated pipeline — solid built, dashed planned |
| 🧮 | GPCS design | Graph-Provenance Claim Scoring — the contribution |
| 📉 | GCP design | Graph Confidence Propagation — Noisy-OR, live path only |
Research and dissertation
| Document | Describes | |
|---|---|---|
| 🕳️ | Research gaps | CloudGraph against the literature |
| 💡 | Novel contributions | Candidates with falsification criteria |
🏗️ Architecture
flowchart TB
    subgraph SRC["📡 Telemetry sources"]
        PROM["Prometheus<br/>metrics"]
        LOKI["Loki<br/>logs"]
        K8S["Kubernetes API<br/>pods · services · deployments"]
        GIT["Git / Argo CD<br/>webhooks"]
    end

    subgraph STORE["🗄️ Stores"]
        NEO[("Neo4j<br/>temporal property graph<br/>Pod · Service · Log · Incident")]
        QD[("Qdrant<br/>384-dim embeddings<br/>all-MiniLM-L6-v2")]
    end

    subgraph RET["🔍 GraphRAG retrieval"]
        TRAV["k-hop Cypher traversal<br/>bounded, time-windowed"]
        RANK["Hybrid ranker<br/>0.50·vector + 0.30·graph + 0.20·recency"]
    end

    subgraph AGENTS["🤖 Investigation engine — 5 specialists"]
        MON["Monitoring"]
        LOG["Log"]
        DEP["Deployment"]
        TOP["Topology"]
        SEC["Security"]
    end

    CONS["⚖️ ConsensusEngine<br/><i>static weighted aggregation</i>"]
    GCP["📈 GCP<br/>Noisy-OR propagation<br/><i>live path only</i>"]
    INC["🗒️ Incident node<br/>root_cause_confidence"]
    VERIFY["🛡️ Claim verification<br/>GPCS vs self-consistency"]
    UI["🖥️ Web UI + Go CLI"]

    PROM & LOKI & K8S & GIT --> NEO
    LOKI --> QD
    NEO --> TRAV --> RANK
    QD --> RANK
    RANK --> MON & LOG & DEP & TOP & SEC
    MON & LOG & DEP & TOP & SEC --> CONS
    CONS --> VERIFY
    CONS -.live path only.-> GCP --> INC
    NEO -.evidence.-> VERIFY
    NEO -.topology.-> GCP
    GCP -.writes confidence back.-> NEO
    VERIFY --> UI
    INC --> UI

    classDef store fill:#d1fae5,stroke:#047857,stroke-width:2px,color:#064e3b
    classDef contrib fill:#fde68a,stroke:#b45309,stroke-width:3px,color:#451a03
    class NEO,QD store
    class VERIFY,GCP contrib
The amber boxes are the research contribution. Everything upstream is infrastructure that exists to make verification possible.
Two things the diagram makes explicit that are easy to get wrong:
GCP does not feed verification. They are computed independently.
GraphProvenanceClaimScorer never reads GCP's output — GCP's two scores go only
to the Incident node's root_cause_confidence and recommendation_confidence
properties. And GCP runs only on the live investigation path
(/api/v1/investigations/trigger); the evaluation that produced every number
above never calls it. So the reported results test GPCS against
self-consistency, and say nothing about GCP.
GCP writes its output back onto the graph, and reads that property in preference to its content rules on the next run — so each run's output becomes the next run's input. It is therefore not idempotent, and repeated investigation of the same cluster inflates confidences toward saturation. This is documented rather than repaired.
The verification step
This is what the study measures: the same claims scored two independent ways.
flowchart TB
    RCA["RCA narrative from consensus"] --> EX["Atomic claim extraction<br/><small>27–52 per run, mean 36.7</small>"]

    EX --> G["<b>GPCS</b> — evidence-grounded<br/>0.45·semantic + 0.35·proximity<br/>+ 0.25·reliability − 0.15·(min_hop·0.05)<br/><small>0 extra LLM calls</small>"]
    EX --> S["<b>Self-consistency</b> — model-internal<br/>3 samples @ T=0.8<br/>cosine recurrence ≥ 0.8<br/><small>2 extra generations</small>"]

    G --> GV["trust ≥ 0.50 → supported"]
    S --> SV["recurrence ≥ 0.5 → supported"]

    GV --> CMP{{"Concordance — same verdict?"}}
    SV --> CMP
    CMP --> R["<b>79.3% vs 53.0% flagged unsupported</b><br/>pooled over 1,950 claims · stricter in 54/54 runs"]

    classDef contrib fill:#fde68a,stroke:#b45309,stroke-width:3px,color:#451a03
    classDef result fill:#dbeafe,stroke:#1d4ed8,stroke-width:2px,color:#172554
    class G,S contrib
    class R result
⚠️ Concordance is not accuracy. The comparison establishes that the two verifiers differ, not that either is right: see known limitations.
Ingestion. Metrics, logs, Kubernetes objects and webhook events become a
temporal property graph — (:Pod)-[:RUNS_ON]->(:Node),
(:Pod)-[:BELONGS_TO]->(:Service), (:Commit)-[:TRIGGERED_BY]->(:Deployment).
Writes use MERGE on object UIDs, so repeated discovery is idempotent.
Retrieval. Bounded k-hop Cypher traversal from an incident seed, fused with
dense vectors (all-MiniLM-L6-v2, 384-dim) by a hybrid ranker:
hybrid_score = 0.50·vector_similarity + 0.30·graph_proximity + 0.20·recency
Every result carries a score_breakdown, so any ranking can be explained term
by term in the UI.
Verification. The narrative is split into atomic claims, then scored by GPCS —
trust = 0.45·semantic + 0.35·proximity + 0.25·reliability − 0.15·(min_hop·0.05)
— and independently by self-consistency (3 samples at temperature 0.8; a claim that fails to recur is flagged).
🤖 Agent Architecture
Five specialists, each an independent LLM call over its own evidence slice,
returning a finding and a confidence in [0,1]:
| Agent | Interprets |
|---|---|
| 🔍 Monitoring | Metrics, alerts, resource saturation |
| 📝 Log | Error signatures, repeated exceptions, warning bursts |
| 🚢 Deployment | Commits, releases, configuration drift |
| 🕸️ Topology | Service dependencies, blast radius, propagation paths |
| 🔐 Security | RBAC, secrets, policy changes, authentication failures |
A ConsensusEngine fuses them into one report. The consensus step is a
static weighted aggregation, not a reasoning agent: an accurate description
matters here, because "multi-agent" often implies debate or critique, and this
system has neither.
Each specialist is gated on finding evidence first. The monitoring agent's
model call sits behind if metrics_log:, the security agent's behind
if threat_detected:, and so on; without evidence the agent takes a rules path
and still returns a finding, but makes no LLM call.
This is measurable in the logs, and the measured cost is not five specialist calls. On every RCAEval scenario the security specialist takes the rules path — a chaos-injected resource fault is not a threat — so each generation is 4 specialist calls + 1 consensus call:
| calls | |
|---|---|
| in-cluster (4 specialists + 1 consensus) × 3 generations | 15 |
| in-process (claim extraction) × 3 generations | 3 |
| total per scenario | 18 |
Five specialists is therefore the architecture, not a guaranteed cost.
📂 Repository Structure
cmd/cloudgraph/          Go CLI — deploy, ingest, report, health
services/
  api/                   FastAPI: ingestion, retrieval, GPCS, GCP, evaluation
  investigation-engine/  The five specialist agents
  agent-orchestrator/    ConsensusEngine
  ui/                    Static HTML/CSS/vanilla-JS (no framework, no build)
deployments/helm/        Helm chart — API, agents, UI, Neo4j, Qdrant, OTel, RBAC
graph/schema.cypher      Node labels, constraints, indexes
experiment-1-benchmark/  Experiment 1 — the evaluation. 54 run logs, 10 traces,
                         results, claims.csv. Seeded RCAEval data; no live cluster.
experiment-2-live-demo/  Experiment 2 — end-to-end demonstration on a real
                         Kubernetes cluster. No results, no statistics.
scripts/                 trace_scenario.py — the instrumented runner for Experiment 1
research/                Labelling policy, gaps against the literature, contributions
docs/                    Architecture, algorithm design, guides
testing/                 End-to-end runbook and reproduction scripts
🔬 Reproducing the Evaluation
The logs cannot be reproduced byte-for-byte: generation runs at temperature
0.8, and identical configurations were measured to vary by up to 25.7 pp on
verifier rates — three runs of rcaeval-03/hybrid gave concordance of 68.6%,
42.9% and 68.4% with nothing changed between them. Treat any single
scenario-condition cell as uninformative on its own. What is reproducible is
the analysis.
gunzip -k experiment-1-benchmark/logs/*.gz
To re-run one scenario end to end (requires the cluster and port-forwards):
cd services/api
AUTH=$(kubectl get secret cloudgraph-neo4j-auth -n cloudgraph-system -o jsonpath='{.data.NEO4J_AUTH}' | base64 -d)
NEO4J_URI=bolt://127.0.0.1:7687 NEO4J_AUTH="$AUTH" QDRANT_HOST=127.0.0.1 QDRANT_PORT=6333 AGENT_ORCHESTRATOR_URL=http://localhost:8082 .venv/bin/python ../../scripts/trace_scenario.py rcaeval-03 hybrid out.log
Scenarios must run sequentially. teardown_benchmark_data() deletes every
is_benchmark node without scenario scoping, and assert_semantic_store_isolated()
fails if the vector store holds any foreign scenario. Parallel runs break both.
🛡️ Evaluation controls
The pipeline enforces the following, and every run records enough to check them:
| Control | Enforced by |
|---|---|
| Ground truth never enters a prompt | test_no_ground_truth_leakage_into_observations — rejects both the claim text and the bare fault phrase |
| Observations span all services, not just the faulted one | test_observations_span_multiple_services — showing only the anomalous service would be leakage by selection |
| Retrieval sees one scenario only | scenario_id filter on the Neo4j query and the Qdrant filter, plus the file-fallback path |
| Scenarios do not overlap | teardown_benchmark_data() between runs; store census printed before and after seeding |
| Claims join to their own scores | scores and claim text carried together, verified per run |
| Prompts are what the services actually sent | in-cluster request and response bodies captured from pod stdout, not reconstructed |
Two limits of these controls are worth stating:
- Isolation is enforced at query time, not by assertion. The
assert_semantic_store_isolated()check inspects a collection the evaluation does not write to, so it passes unconditionally. What actually prevents cross-scenario evidence is thescenario_idfilter, and the run logs record the store census that demonstrates it. - Claim text in
results/claims.csvis truncated to 52 characters. Full text is in the run logs and the traces.
Labelling follows a pre-registered policy with its deviations recorded in
research/LABELLING_POLICY.md.
🧪 Testing
cd services/api && .venv/bin/python -m pytest tests/ -q -n auto
go build ./... && go test ./...
135 Python tests plus the Go CLI suite. CI runs both, alongside pre-commit (ruff, black, flake8, pylint, markdownlint, shellcheck, gitleaks).
🚧 Known limitations
| Limitation | Consequence |
|---|---|
| Eighteen scenarios, one sample per cell | Results are counts and rates. No inferential statistics are reported, and the N1 null is underpowered. |
| 4.8% adjudicable coverage | Verifier comparisons rest on 93 labelled claims. GPCS can be shown stricter, not better aimed. |
| GPCS resolution | Trust takes eight distinct values, 79.3% of them exactly 0.000. It is a gate, not a continuous confidence. |
| Nothing is calibrated | GPCS thresholds (0.30 floor, 0.50 cut) and GCP edge weights are hand-set defaults. No reliability diagrams or Brier scores. |
| Metrics are synthetic | No metric-based diagnosis is grounded in measured telemetry. |
| Scope is resource and network faults | RCAEval RE2 has no config errors, security events, deployment failures, DNS faults or certificate expiry. |
| Task is fault-type diagnosis | The faulted service is given. Nothing here demonstrates root-cause service localisation. |
/api/v1/settings is unauthenticated | It returns the stored provider key in cleartext. Acceptable on localhost, not otherwise. |
Qdrant evidence collection is not created on a fresh deploy | The semantic store falls back to a local file until it is created. |
| Traces are not ingested | The Tempo adapter is wired but unused; CALLS edges fall back to naming heuristics. |
🤝 Contributing
git checkout -b feature/new-feature
git commit -m "feat: add new feature"
git push origin feature/new-feature
See CONTRIBUTING.md ·
SECURITY.md ·
CODE_OF_CONDUCT.md
📄 License & Citation
MIT — see LICENSE.
Citing this work
The evaluation dataset — all 54 run logs, claims.csv, the 18 scenario
definitions and the analysis scripts — is archived on Zenodo:
Shashank, S. (2026). CloudGraph: Evaluation Dataset for Graph-Grounded Verification of LLM-Generated Root Cause Analysis in Kubernetes (v1) [Data set]. Zenodo. 10.5281/zenodo.22142635
@misc{cloudgraphdata,
  author    = {Shashank, Shivam},
  title     = {CloudGraph: Evaluation Dataset for Graph-Grounded Verification
               of LLM-Generated Root Cause Analysis in Kubernetes},
  year      = {2026},
  publisher = {Zenodo},
  version   = {v1},
  doi       = {10.5281/zenodo.22142635}
}
The archived claims.csv is byte-identical to
experiment-1-benchmark/results/claims.csv
in this repository, so every figure below can be reproduced from either.
Upstream corpus
The benchmark corpus is RCAEval (MIT), Zenodo DOI 10.5281/zenodo.14590730, arXiv 2412.17015. This dataset is a derivative of it and inherits its MIT terms.
👤 Author
Shivam Shashank — MSc dissertation, University of Birmingham. Supervisor: Dr Vincent Rahli.
- 🌐 Portfolio: shivam-shashank.me
- 💼 LinkedIn: shivam-shashank-2b5766217
- 📧 Email: shivamkumar872000@gmail.com
- 🐙 GitHub: shivamshashank
⭐ If CloudGraph helps you, please star the repository
Contributors

76 commits
Similar repos


Languages
Python
69.2%
Go
7.8%
JavaScript
7.6%
HTML
7.1%
Shell
4.0%
CSS
3.5%
Graph-grounded verification of LLM-generated root cause analysis for Kubernetes. 18 scenarios, 54 runs, 1,950 claims — with a negative result: graph provenance does not predict claim correctness.
Python
0
76 commits
updated Sep 1, 2026
README
🚀 CloudGraph
Graph-Grounded Verification of LLM-Generated Root Cause Analysis for Kubernetes
CloudGraph builds a temporal knowledge graph from live cluster telemetry, retrieves incident context over it, has five specialist LLM agents diagnose the incident, and then — the part this project is actually about: checks every claim in the generated explanation against graph evidence.
The research question is not "can an LLM write a plausible root cause?" It is "can we tell whether it made that up?"
Experiment 1 · 18 RCAEval RE2 scenarios × 3 conditions · 54 runs · 1,950 claims · 135 tests
📌 Overview
Large language models write fluent incident explanations. They also invent them. CloudGraph is a system and a study for telling the two apart.
It ingests Loki logs, Kubernetes objects and Git/Argo CD events into a temporal property graph (Neo4j), retrieves incident context by k-hop traversal fused with dense vectors (Qdrant), runs five specialist agents over that context, and then scores every atomic claim in the resulting narrative two independent ways:
- GPCS (Graph-Provenance Claim Scoring) — evidence-grounded: is this claim supported by the incident graph? Costs no extra model calls.
- Self-consistency — model-internal: does this claim recur when the model is sampled again? Costs two extra full generations.
Comparing those two verifiers, on real chaos-injected telemetry, is the experiment.
Two properties of the implementation that bound how the results read.
Metrics are synthetic on the live-cluster path. Experiment 1 seeds real RCAEval telemetry into its
Metricnodes (services/api/app/demo/seeding.py), so its metric evidence is measured data. Experiment 2 has no such source: everyMetricnode there is produced by_simulate_pod_metrics()(services/api/app/adapters/k8s_discovery.py:236), which generates values withrandom.uniform(). A Prometheus ingestion endpoint exists (POST /api/v1/telemetry/metrics) but nothing calls it and no metrics-server is deployed, so no metric figure in an Experiment 2 diagnosis reflects measured telemetry. Metric evidence is excluded from retrieval and from provenance scoring in Experiment 2 for that reason.GPCS's semantic term is a constant in Experiment 1. Its evidence comes from graph traversal, which assigns a fixed score (
0.75within two hops,0.6beyond) rather than a measured similarity. The trust score is therefore determined by graph reachability:0.45×0.75 + 0.35×0.50 + 0.25×0.81 − 0.15×0.05 = 0.7075 ≈ 0.708, which is the value taken by 85 of the 1,950 claims. Read those results as measuring reachability, not semantic provenance.
The headline result is a measurement, not a win. Only 4.8% of the claims an LLM generates about an incident can be adjudicated at all using standard RCA benchmark metadata. That ceiling — not the choice of verifier — is what binds this whole line of work, and it applies to any claim-level verifier evaluated this way.
| Evaluation | 18 RCAEval RE2 scenarios × 3 retrieval conditions · 54 runs · 1,950 claims |
| Adjudicable | 93 of 1,950 claims (4.8%) |
| Tests | 135 |
| Deployment | Kubernetes via Helm — verified on kubeadm and OrbStack |
🧪 Two experiments, two different jobs
experiment-1-benchmark/ | experiment-2-live-demo/ | |
|---|---|---|
| Purpose | measure verification | demonstrate the pipeline |
| Evidence comes from | an RCAEval file, seeded into the stores | the real cluster, via the ingestion pipeline |
| Exercises ingestion? | no | yes |
| Ground truth | labelled, 1,950 claims | known but unlabelled |
| Scale | 18 faults x 3 conditions = 54 runs | 1 fault |
| Produces results? | yes — every number in this README | no |
flowchart TB
    subgraph E1["Experiment 1 — benchmark (all results)"]
        direction TB
        F["RCAEval RE2 file<br/><small>26 observations per scenario</small>"] --> S["seed into Neo4j + Qdrant"]
        S --> R1["retrieve<br/><small>scenario-scoped</small>"]
    end
    subgraph E2["Experiment 2 — live demo (no results)"]
        direction TB
        K["real Kubernetes cluster"] --> I["ingestion pipeline<br/><small>discovery + pod logs</small>"]
        I --> G[("Neo4j + Qdrant")] --> R2["retrieve<br/><small>unscoped</small>"]
    end
    R1 --> P["5 agents -> consensus -> atomic claims"]
    R2 --> P
    P --> V["GPCS + self-consistency"]
    V --> L["labelled ground truth<br/><i>Experiment 1 only</i>"]

    classDef e1 fill:#dbeafe,stroke:#1d4ed8,color:#172554
    classDef e2 fill:#dcfce7,stroke:#15803d,color:#052e16
    class F,S,R1 e1
    class K,I,G,R2 e2
No data from the host cluster reaches any prompt in Experiment 1. Its telemetry is seeded from a file and torn down after each run. That is deliberate: incidents on a live cluster have no labelled ground truth, so claim correctness could not be scored; and holding the evidence pool constant is what lets a difference in outcome be attributed to retrieval strategy rather than to which data happened to exist.
The consequence is that Experiment 1 measures evidence selection, not evidence discovery. Experiment 2 exists to exercise the ingestion pipeline that Experiment 1 deliberately bypasses — it demonstrates, and measures nothing.
📊 Results & Key Findings
Every number below is derived from the 54 run logs across 18 benchmark scenarios. Full analysis is detailed in experiment-1-benchmark/results/EXPERIMENT_FINAL_RESULTS.md.
1. Retrieval Condition Breakdown (NONE vs RAW vs HYBRID)
| Metric | NONE (No Context) | RAW (Full Dump) | HYBRID (Ranked Graph) | Takeaway |
|---|---|---|---|---|
| Total Claims Extracted | 628 | 703 | 619 | HYBRID: fewest claims (36.1/run pooled). |
| GPCS Unsupported % (Pooled) | 78.3% | 80.1% | 79.3% | Flat across conditions. |
| Self-Consistency Unsupported % | 57.0% | 49.2% | 53.3% | RAW: highest recurrence. |
| Mean Request Payload | 1,651 ch | 27,406 ch | 13,196 ch | HYBRID: 51.9% smaller than RAW. |
| Evaluable Correctness Coverage | 4.8% (30/628) | 3.6% (25/703) | 6.1% (38/619) | HYBRID: most adjudicable claims. |
| Consistent : Contradicted | 14 : 16 | 10 : 15 | 12 : 26 | NONE: best ratio; HYBRID worst. |
2. Does either verifier track correctness?
Figure 1 — Neither verifier separates correct claims from incorrect ones. A verifier that worked would show a tall orange bar beside a short blue one. GPCS flags incorrect claims 5.1 pp more often than correct ones (about three claims); self-consistency flags them 0.7 pp less often. Counts appear beneath each percentage — the 93 adjudicable claims split 36 correct / 57 incorrect.
Figure 2 — The trust score is a gate, not a graded confidence. Across 1,950
claims it takes only eight distinct values. 1,546 sit at exactly 0.000, and
nothing at all falls between 0.000 and 0.700; the 404 non-zero scores occupy
a band 0.020 wide. This is the mechanism behind Figure 1 — a threshold cannot be
tuned on a distribution with this shape.
3. Research Questions (RQ) Support Matrix
The project has one research-question register, RQ1-RQ7, defined in
docs/PROJECT_EXPLAINED.md. Every verdict below
comes from the 18-scenario evaluation, which computes no inferential statistics
- no verdict here rests on a p-value or a confidence interval.
| RQ | Question | Verdict |
|---|---|---|
| RQ1 | Does GPCS behave differently from self-consistency, and does either flag track claim correctness? | Partly against. Distinct - 79.3% vs 53.0% unsupported, stricter in all 54 runs. But on 93 adjudicable claims neither tracks correctness (GPCS +5.1 pp at 0.627 precision, SC -0.7 pp at 0.610, base rate 0.613). |
| RQ2 | Is the measured result real end-to-end, not an artefact of a simulated scorer? | Yes. 54/54 runs completed, zero fallbacks or timeouts, paired verdicts for all 1,950 claims, deterministic labeller, claims.csv regenerable by committed script. |
| RQ3 | Does graph-structured retrieval beat dumping all evidence into context? | Cost win only. HYBRID cuts the request payload 51.9% vs RAW and gives the best evaluable coverage (6.1%), but the worst consistent:contradicted ratio (12:26). No accuracy advantage. |
| RQ4 | Is any retrieval benefit symbolic-structural or neural-semantic? | Not measured. No retrieval ablation was run. Highest-value experiment outstanding. |
| RQ5 | Does the five-agent architecture beat a single model at matched compute? | Deferred to v2. |
| RQ6 | Are the confidence scores calibrated, and would fitted weights beat hand-set ones? | Deferred to v2. |
| RQ7 | Which claim types are each verifier's blind spot? | Deferred to v2 - 4.8% coverage is still too thin to stratify. |
What the evaluation establishes operationally - engineering results, not research claims: the pipeline runs reliably end-to-end across 54 runs and 1,057 LLM calls with zero failures; GPCS supplies an evidence gate at zero additional LLM cost against self-consistency's 2 extra generations per claim; and requiring both verifiers to accept keeps just 308 of 1,950 claims — an 84.2% reduction in volume.
4. The five hypotheses
The project rests on five claims. Four are supported; one is refuted — and the refuted one is the claim the whole design was built on.
| # | Hypothesis | Verdict | Evidence |
|---|---|---|---|
| H1 | An operational system already carries a real dependency graph, obtainable free rather than at extra cost. | ✅ Supported | All 54 runs built a typed property graph from RCAEval telemetry with no annotation step. |
| H2 | The pipeline runs reliably end to end at scale. | ✅ Supported | 54/54 runs completed. Zero fallbacks or timeouts across 1,057 LLM calls and 5.20 h, producing paired verdicts for all 1,950 claims. |
| H3 | A graph can verify generated claims at no additional model cost. | ✅ Supported | GPCS scores every claim by database query at 0 extra LLM calls, against self-consistency's 2 extra generations. It also behaves distinctly: 79.3% unsupported vs 53.0%. |
| H4 | Ranked graph retrieval reduces context cost against dumping all evidence. | ✅ Supported | HYBRID cuts the mean request payload 51.9% (13,196 vs 27,406 chars), produces the fewest claims, and gives the best evaluable coverage (6.1%). |
| H5 | A claim traceable to nearby graph evidence is more likely to be true. | ❌ Refuted | On 93 adjudicable claims GPCS's flag-rate gap is +5.1 pp at precision 0.627 against a 0.613 base rate — the score for flagging everything. Self-consistency is −0.7 pp. |
H5 is the load-bearing one. H1–H4 establish that the graph is free, the system is reliable, verification is cheap and ranked retrieval is cheaper. None of that matters much if traceable evidence does not indicate a true claim — and it does not. Provenance predicts reachability, not truth. That is the finding, and it is negative.
→ Full Pooled Results · Joint-Verifier Comparison · Experiment 1 Methodology
⚠️ What These Results Do Not Establish (Scope & Limitations)
To keep evaluation findings honest and transparent, here is what the results do not claim:
- Strictness ≠ Superior Accuracy: GPCS is stricter than Self-Consistency (rejection rate 79.3% vs 53.0%), but flagging more claims reflects a stricter database evidence gate—not higher accuracy. Across the 22 ground-truth claims, both verifiers differ by only 1 claim net.
- Single-Run Flag Rates Are Not Accuracy: A single scenario run measures verifier strictness, not overall Precision/Recall. True verifier accuracy is evaluated over the combined 6-scenario dataset.
- Fault Diagnosis, Not Service Localization: The benchmark identifies the affected target service (
ts-order-service,carts, etc.) in advance. The system diagnoses how/why the service failed, not which service failed across the cluster. - Coarse Evidence Gate (Binary Thresholding): GPCS trust scores operate as a strict pass/fail evidence gate (79.3% of claims score
0.000because no graph evidence cleared the vector similarity floor), rather than a calibrated continuous confidence score.
⚡ Quick Start
git clone https://github.com/shivamshashank/CloudGraph.git
cd CloudGraph
go build -o cloudgraph ./cmd/cloudgraph
sudo ./cloudgraph deploy
Then open the UI, configure an LLM provider on the Settings page, and run a diagnosis.
- 📖 Installation guide — prerequisites, kubeadm + Helm provisioning, configuration, troubleshooting
- 🏃 Quickstart — deploy in a few minutes
- 🖥️ UI walkthrough — every screen, tab and button, with 14 screenshots from a live deployment against a real LLM
📚 Documentation
Start here
| Document | Describes | |
|---|---|---|
| 🧭 | Project explained | What this is, in plain language |
| 🧮 | Formulas & Framework | Complete formulas, variables, code blocks & literature references |
| ⚙️ | Mechanisms | Every algorithm, with its formula |
| 🔎 | Verification flow | How a claim becomes a verdict |
The experiment
| Document | Describes | |
|---|---|---|
| 🧪 | Experiment 1 | Scenarios, layout, reproduction, pipeline state |
| 📈 | Final results | Pooled and per-scenario |
| ⚖️ | Joint verifier comparison | GPCS and self-consistency used together |
| 🧵 | How the traces work | The runner, the log format, the nine steps |
| 🏷️ | Labelling policy | Pre-registration and the deviation log D-1…D-4 |
Design and architecture
| Document | Describes | |
|---|---|---|
| 🏗️ | Architecture index | Every design doc, marked built vs planned |
| 🗺️ | System overview | Lifecycle, install through investigation |
| 🖼️ | Current architecture | Evaluated pipeline — solid built, dashed planned |
| 🧮 | GPCS design | Graph-Provenance Claim Scoring — the contribution |
| 📉 | GCP design | Graph Confidence Propagation — Noisy-OR, live path only |
Research and dissertation
| Document | Describes | |
|---|---|---|
| 🕳️ | Research gaps | CloudGraph against the literature |
| 💡 | Novel contributions | Candidates with falsification criteria |
🏗️ Architecture
flowchart TB
    subgraph SRC["📡 Telemetry sources"]
        PROM["Prometheus<br/>metrics"]
        LOKI["Loki<br/>logs"]
        K8S["Kubernetes API<br/>pods · services · deployments"]
        GIT["Git / Argo CD<br/>webhooks"]
    end

    subgraph STORE["🗄️ Stores"]
        NEO[("Neo4j<br/>temporal property graph<br/>Pod · Service · Log · Incident")]
        QD[("Qdrant<br/>384-dim embeddings<br/>all-MiniLM-L6-v2")]
    end

    subgraph RET["🔍 GraphRAG retrieval"]
        TRAV["k-hop Cypher traversal<br/>bounded, time-windowed"]
        RANK["Hybrid ranker<br/>0.50·vector + 0.30·graph + 0.20·recency"]
    end

    subgraph AGENTS["🤖 Investigation engine — 5 specialists"]
        MON["Monitoring"]
        LOG["Log"]
        DEP["Deployment"]
        TOP["Topology"]
        SEC["Security"]
    end

    CONS["⚖️ ConsensusEngine<br/><i>static weighted aggregation</i>"]
    GCP["📈 GCP<br/>Noisy-OR propagation<br/><i>live path only</i>"]
    INC["🗒️ Incident node<br/>root_cause_confidence"]
    VERIFY["🛡️ Claim verification<br/>GPCS vs self-consistency"]
    UI["🖥️ Web UI + Go CLI"]

    PROM & LOKI & K8S & GIT --> NEO
    LOKI --> QD
    NEO --> TRAV --> RANK
    QD --> RANK
    RANK --> MON & LOG & DEP & TOP & SEC
    MON & LOG & DEP & TOP & SEC --> CONS
    CONS --> VERIFY
    CONS -.live path only.-> GCP --> INC
    NEO -.evidence.-> VERIFY
    NEO -.topology.-> GCP
    GCP -.writes confidence back.-> NEO
    VERIFY --> UI
    INC --> UI

    classDef store fill:#d1fae5,stroke:#047857,stroke-width:2px,color:#064e3b
    classDef contrib fill:#fde68a,stroke:#b45309,stroke-width:3px,color:#451a03
    class NEO,QD store
    class VERIFY,GCP contrib
The amber boxes are the research contribution. Everything upstream is infrastructure that exists to make verification possible.
Two things the diagram makes explicit that are easy to get wrong:
GCP does not feed verification. They are computed independently.
GraphProvenanceClaimScorer never reads GCP's output — GCP's two scores go only
to the Incident node's root_cause_confidence and recommendation_confidence
properties. And GCP runs only on the live investigation path
(/api/v1/investigations/trigger); the evaluation that produced every number
above never calls it. So the reported results test GPCS against
self-consistency, and say nothing about GCP.
GCP writes its output back onto the graph, and reads that property in preference to its content rules on the next run — so each run's output becomes the next run's input. It is therefore not idempotent, and repeated investigation of the same cluster inflates confidences toward saturation. This is documented rather than repaired.
The verification step
This is what the study measures: the same claims scored two independent ways.
flowchart TB
    RCA["RCA narrative from consensus"] --> EX["Atomic claim extraction<br/><small>27–52 per run, mean 36.7</small>"]

    EX --> G["<b>GPCS</b> — evidence-grounded<br/>0.45·semantic + 0.35·proximity<br/>+ 0.25·reliability − 0.15·(min_hop·0.05)<br/><small>0 extra LLM calls</small>"]
    EX --> S["<b>Self-consistency</b> — model-internal<br/>3 samples @ T=0.8<br/>cosine recurrence ≥ 0.8<br/><small>2 extra generations</small>"]

    G --> GV["trust ≥ 0.50 → supported"]
    S --> SV["recurrence ≥ 0.5 → supported"]

    GV --> CMP{{"Concordance — same verdict?"}}
    SV --> CMP
    CMP --> R["<b>79.3% vs 53.0% flagged unsupported</b><br/>pooled over 1,950 claims · stricter in 54/54 runs"]

    classDef contrib fill:#fde68a,stroke:#b45309,stroke-width:3px,color:#451a03
    classDef result fill:#dbeafe,stroke:#1d4ed8,stroke-width:2px,color:#172554
    class G,S contrib
    class R result
⚠️ Concordance is not accuracy. The comparison establishes that the two verifiers differ, not that either is right: see known limitations.
Ingestion. Metrics, logs, Kubernetes objects and webhook events become a
temporal property graph — (:Pod)-[:RUNS_ON]->(:Node),
(:Pod)-[:BELONGS_TO]->(:Service), (:Commit)-[:TRIGGERED_BY]->(:Deployment).
Writes use MERGE on object UIDs, so repeated discovery is idempotent.
Retrieval. Bounded k-hop Cypher traversal from an incident seed, fused with
dense vectors (all-MiniLM-L6-v2, 384-dim) by a hybrid ranker:
hybrid_score = 0.50·vector_similarity + 0.30·graph_proximity + 0.20·recency
Every result carries a score_breakdown, so any ranking can be explained term
by term in the UI.
Verification. The narrative is split into atomic claims, then scored by GPCS —
trust = 0.45·semantic + 0.35·proximity + 0.25·reliability − 0.15·(min_hop·0.05)
— and independently by self-consistency (3 samples at temperature 0.8; a claim that fails to recur is flagged).
🤖 Agent Architecture
Five specialists, each an independent LLM call over its own evidence slice,
returning a finding and a confidence in [0,1]:
| Agent | Interprets |
|---|---|
| 🔍 Monitoring | Metrics, alerts, resource saturation |
| 📝 Log | Error signatures, repeated exceptions, warning bursts |
| 🚢 Deployment | Commits, releases, configuration drift |
| 🕸️ Topology | Service dependencies, blast radius, propagation paths |
| 🔐 Security | RBAC, secrets, policy changes, authentication failures |
A ConsensusEngine fuses them into one report. The consensus step is a
static weighted aggregation, not a reasoning agent: an accurate description
matters here, because "multi-agent" often implies debate or critique, and this
system has neither.
Each specialist is gated on finding evidence first. The monitoring agent's
model call sits behind if metrics_log:, the security agent's behind
if threat_detected:, and so on; without evidence the agent takes a rules path
and still returns a finding, but makes no LLM call.
This is measurable in the logs, and the measured cost is not five specialist calls. On every RCAEval scenario the security specialist takes the rules path — a chaos-injected resource fault is not a threat — so each generation is 4 specialist calls + 1 consensus call:
| calls | |
|---|---|
| in-cluster (4 specialists + 1 consensus) × 3 generations | 15 |
| in-process (claim extraction) × 3 generations | 3 |
| total per scenario | 18 |
Five specialists is therefore the architecture, not a guaranteed cost.
📂 Repository Structure
cmd/cloudgraph/          Go CLI — deploy, ingest, report, health
services/
  api/                   FastAPI: ingestion, retrieval, GPCS, GCP, evaluation
  investigation-engine/  The five specialist agents
  agent-orchestrator/    ConsensusEngine
  ui/                    Static HTML/CSS/vanilla-JS (no framework, no build)
deployments/helm/        Helm chart — API, agents, UI, Neo4j, Qdrant, OTel, RBAC
graph/schema.cypher      Node labels, constraints, indexes
experiment-1-benchmark/  Experiment 1 — the evaluation. 54 run logs, 10 traces,
                         results, claims.csv. Seeded RCAEval data; no live cluster.
experiment-2-live-demo/  Experiment 2 — end-to-end demonstration on a real
                         Kubernetes cluster. No results, no statistics.
scripts/                 trace_scenario.py — the instrumented runner for Experiment 1
research/                Labelling policy, gaps against the literature, contributions
docs/                    Architecture, algorithm design, guides
testing/                 End-to-end runbook and reproduction scripts
🔬 Reproducing the Evaluation
The logs cannot be reproduced byte-for-byte: generation runs at temperature
0.8, and identical configurations were measured to vary by up to 25.7 pp on
verifier rates — three runs of rcaeval-03/hybrid gave concordance of 68.6%,
42.9% and 68.4% with nothing changed between them. Treat any single
scenario-condition cell as uninformative on its own. What is reproducible is
the analysis.
gunzip -k experiment-1-benchmark/logs/*.gz
To re-run one scenario end to end (requires the cluster and port-forwards):
cd services/api
AUTH=$(kubectl get secret cloudgraph-neo4j-auth -n cloudgraph-system -o jsonpath='{.data.NEO4J_AUTH}' | base64 -d)
NEO4J_URI=bolt://127.0.0.1:7687 NEO4J_AUTH="$AUTH" QDRANT_HOST=127.0.0.1 QDRANT_PORT=6333 AGENT_ORCHESTRATOR_URL=http://localhost:8082 .venv/bin/python ../../scripts/trace_scenario.py rcaeval-03 hybrid out.log
Scenarios must run sequentially. teardown_benchmark_data() deletes every
is_benchmark node without scenario scoping, and assert_semantic_store_isolated()
fails if the vector store holds any foreign scenario. Parallel runs break both.
🛡️ Evaluation controls
The pipeline enforces the following, and every run records enough to check them:
| Control | Enforced by |
|---|---|
| Ground truth never enters a prompt | test_no_ground_truth_leakage_into_observations — rejects both the claim text and the bare fault phrase |
| Observations span all services, not just the faulted one | test_observations_span_multiple_services — showing only the anomalous service would be leakage by selection |
| Retrieval sees one scenario only | scenario_id filter on the Neo4j query and the Qdrant filter, plus the file-fallback path |
| Scenarios do not overlap | teardown_benchmark_data() between runs; store census printed before and after seeding |
| Claims join to their own scores | scores and claim text carried together, verified per run |
| Prompts are what the services actually sent | in-cluster request and response bodies captured from pod stdout, not reconstructed |
Two limits of these controls are worth stating:
- Isolation is enforced at query time, not by assertion. The
assert_semantic_store_isolated()check inspects a collection the evaluation does not write to, so it passes unconditionally. What actually prevents cross-scenario evidence is thescenario_idfilter, and the run logs record the store census that demonstrates it. - Claim text in
results/claims.csvis truncated to 52 characters. Full text is in the run logs and the traces.
Labelling follows a pre-registered policy with its deviations recorded in
research/LABELLING_POLICY.md.
🧪 Testing
cd services/api && .venv/bin/python -m pytest tests/ -q -n auto
go build ./... && go test ./...
135 Python tests plus the Go CLI suite. CI runs both, alongside pre-commit (ruff, black, flake8, pylint, markdownlint, shellcheck, gitleaks).
🚧 Known limitations
| Limitation | Consequence |
|---|---|
| Eighteen scenarios, one sample per cell | Results are counts and rates. No inferential statistics are reported, and the N1 null is underpowered. |
| 4.8% adjudicable coverage | Verifier comparisons rest on 93 labelled claims. GPCS can be shown stricter, not better aimed. |
| GPCS resolution | Trust takes eight distinct values, 79.3% of them exactly 0.000. It is a gate, not a continuous confidence. |
| Nothing is calibrated | GPCS thresholds (0.30 floor, 0.50 cut) and GCP edge weights are hand-set defaults. No reliability diagrams or Brier scores. |
| Metrics are synthetic | No metric-based diagnosis is grounded in measured telemetry. |
| Scope is resource and network faults | RCAEval RE2 has no config errors, security events, deployment failures, DNS faults or certificate expiry. |
| Task is fault-type diagnosis | The faulted service is given. Nothing here demonstrates root-cause service localisation. |
/api/v1/settings is unauthenticated | It returns the stored provider key in cleartext. Acceptable on localhost, not otherwise. |
Qdrant evidence collection is not created on a fresh deploy | The semantic store falls back to a local file until it is created. |
| Traces are not ingested | The Tempo adapter is wired but unused; CALLS edges fall back to naming heuristics. |
🤝 Contributing
git checkout -b feature/new-feature
git commit -m "feat: add new feature"
git push origin feature/new-feature
See CONTRIBUTING.md ·
SECURITY.md ·
CODE_OF_CONDUCT.md
📄 License & Citation
MIT — see LICENSE.
Citing this work
The evaluation dataset — all 54 run logs, claims.csv, the 18 scenario
definitions and the analysis scripts — is archived on Zenodo:
Shashank, S. (2026). CloudGraph: Evaluation Dataset for Graph-Grounded Verification of LLM-Generated Root Cause Analysis in Kubernetes (v1) [Data set]. Zenodo. 10.5281/zenodo.22142635
@misc{cloudgraphdata,
  author    = {Shashank, Shivam},
  title     = {CloudGraph: Evaluation Dataset for Graph-Grounded Verification
               of LLM-Generated Root Cause Analysis in Kubernetes},
  year      = {2026},
  publisher = {Zenodo},
  version   = {v1},
  doi       = {10.5281/zenodo.22142635}
}
The archived claims.csv is byte-identical to
experiment-1-benchmark/results/claims.csv
in this repository, so every figure below can be reproduced from either.
Upstream corpus
The benchmark corpus is RCAEval (MIT), Zenodo DOI 10.5281/zenodo.14590730, arXiv 2412.17015. This dataset is a derivative of it and inherits its MIT terms.
👤 Author
Shivam Shashank — MSc dissertation, University of Birmingham. Supervisor: Dr Vincent Rahli.
- 🌐 Portfolio: shivam-shashank.me
- 💼 LinkedIn: shivam-shashank-2b5766217
- 📧 Email: shivamkumar872000@gmail.com
- 🐙 GitHub: shivamshashank
⭐ If CloudGraph helps you, please star the repository
Similar repos
Contributors
76 commits
Languages
Python
69.2%
Go
7.8%
JavaScript
7.6%
HTML
7.1%
Shell
4.0%
CSS
3.5%