Productivity Tools for Plotly + Pandas
Jupyter Notebook
3,099
426 commits
updated Jul 3, 2024
This library binds the power of plotly with the flexibility of pandas for easy plotting.
This library is available on https://github.com/santosjorge/cufflinks
This tutorial assumes that the plotly user credentials have already been configured as stated on the getting started guide.
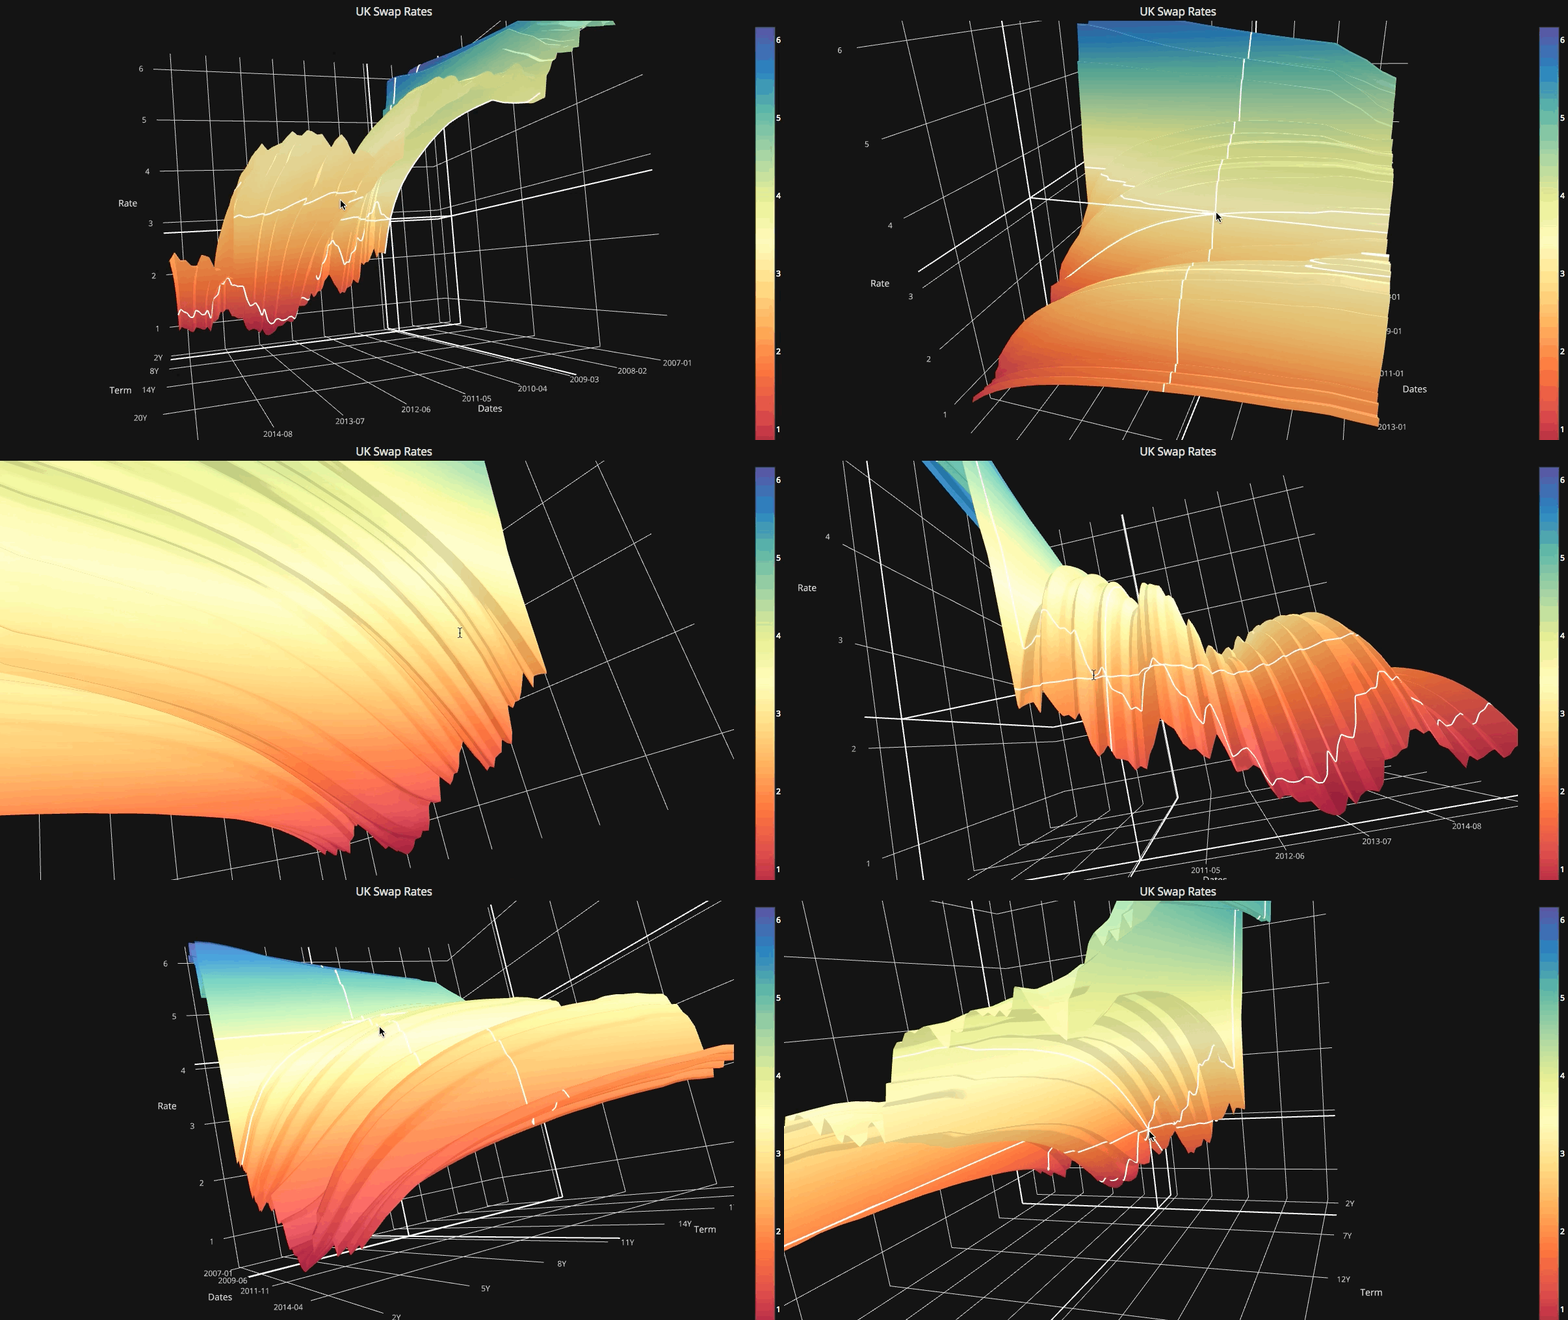
Support for Plotly 4.x
Cufflinks is no longer compatible with Plotly 3.x
Support for Plotly 3.0
New iplot helper.
To see a comprehensive list of parameters
cf.help()
# For a list of supported figures
cf.help()
# Or to see the parameters supported that apply to a given figure try
cf.help('scatter')
cf.help('candle') #etc
Removed dependecies on ta-lib. This library is no longer required. All studies have be rewritten in Python.
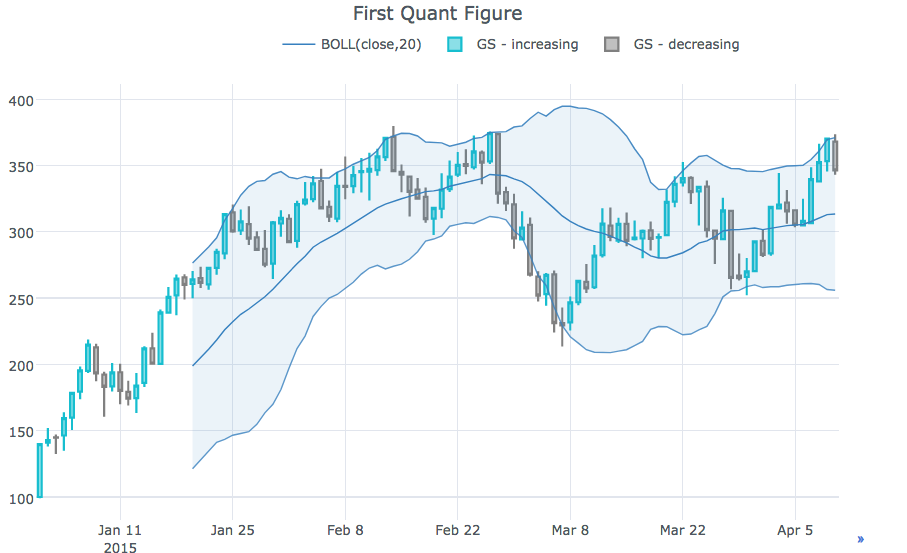
QuantFigure is a new class that will generate a graph object with persistence.
Parameters can be added/modified at any given point.This can be as easy as:
df=cf.datagen.ohlc()
qf=cf.QuantFig(df,title='First Quant Figure',legend='top',name='GS')
qf.add_bollinger_bands()
qf.iplot()
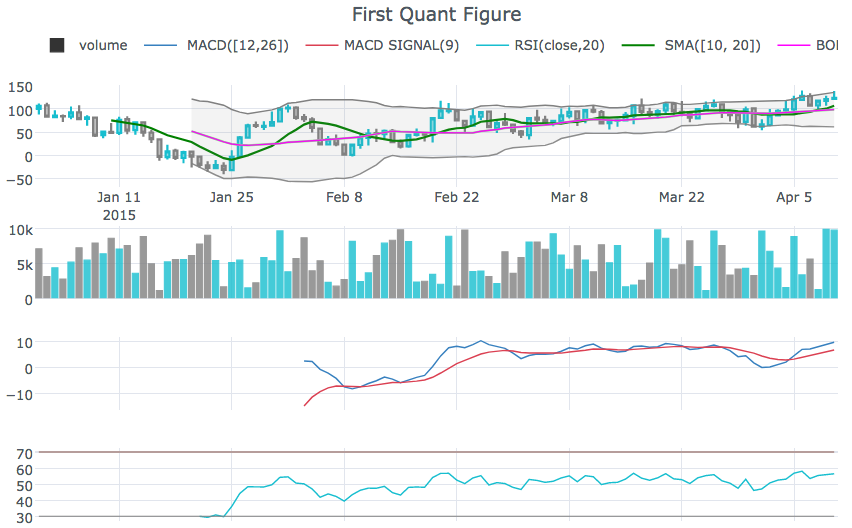
qf.add_sma([10,20],width=2,color=['green','lightgreen'],legendgroup=True)
qf.add_rsi(periods=20,color='java')
qf.add_bollinger_bands(periods=20,boll_std=2,colors=['magenta','grey'],fill=True)
qf.add_volume()
qf.add_macd()
qf.iplot()
rangeslider to display a date range slider at the bottom
cf.datagen.ohlc().iplot(kind='candle',rangeslider=True)rangeselector to display buttons to change the date range displayed
cf.datagen.ohlc(500).iplot(kind='candle', rangeselector={ 'steps':['1y','2 months','5 weeks','ytd','2mtd','reset'], 'bgcolor' : ('grey',.3), 'x': 0.3 , 'y' : 0.95})fontsize,fontcolor,textangle
cf.datagen.lines(1,mode='stocks').iplot(kind='line', annotations={'2015-02-02':'Market Crash', '2015-03-01':'Recovery'}, textangle=-70,fontsize=13,fontcolor='grey')cf.datagen.lines(1,mode='stocks').iplot(kind='line', annotations=[{'text':'exactly here','x':'0.2', 'xref':'paper','arrowhead':2, 'textangle':-10,'ay':150,'arrowcolor':'red'}])Figure.iplot() to plot figurescf.datagen.ohlc().iplot(kind='candle')iplotxrange, yrange and zrange can be specified in iplot and getLayout
cf.datagen.lines(1).iplot(yrange=[5,15])layout_update can be set in iplot and getLayout to explicitly update any Layout valuecf.datagen.pie().iplot(kind='pie',labels='labels',values='values')datagen.ohlc()ohlc=cf.datagen.ohlc()ohlc.iplot(kind='candle',up_color='blue',down_color='red')ohlc=cf.datagen.ohlc()ohlc.iplot(kind='ohlc',up_color='blue',down_color='red')df=pd.DataFrame([x**2] for x in range(100))df.iplot(kind='lines',logy=True)cf.datagen.lines(1,5).iplot(kind='bar',error_y=[1,2,3.5,2,2])cf.datagen.lines(1,5).iplot(kind='bar',error_y=20, error_type='percent')cf.datagen.lines(1).iplot(kind='lines',error_y=20,error_type='continuous_percent')cf.datagen.lines(1).iplot(kind='lines',error_y=10,error_type='continuous',color='blue')cf.datagen.lines(1,500).ta_plot(study='sma',periods=[13,21,55])cf.datagen.lines(1,200).ta_plot(study='boll',periods=14)cf.datagen.lines(1,200).ta_plot(study='rsi',periods=14)cf.datagen.lines(1,200).ta_plot(study='macd',fast_period=12,slow_period=26, signal_period=9)cf.go_offline()cf.go_online()cf.iplot(figure,online=True) (To force online whilst on offline mode)fig=cf.datagen.lines(3,columns=['a','b','c']).figure()fig=fig.set_axis('b',side='right')cf.iplot(fig)cufflinks.set_config_file(theme='pearl')cufflinks.datagen.lines(5).iplot(theme='ggplot')cufflinks.datagen.lines(2).iplot(kind='barh',barmode='stack',bargap=.1)cufflinks.datagen.histogram().iplot(kind='histogram',orientation='h',norm='probability')cufflinks.datagen.lines(4).iplot(kind='area',fill=True,opacity=1)cufflinks.datagen.histogram(4).iplot(kind='histogram',subplots=True,bins=50)cufflinks.datagen.lines(4).iplot(subplots=True,shape=(4,1),shared_xaxes=True,vertical_spacing=.02,fill=True)cufflinks.datagen.lines(4,1000).scatter_matrix()cufflinks.datagen.lines(3).iplot(hline=[2,3])cufflinks.datagen.lines(3).iplot(hline=dict(y=2,color='blue',width=3))cufflinks.datagen.lines(3).iplot(hspan=(-1,2))cufflinks.datagen.lines(3).iplot(hspan=dict(y0=-1,y1=2,color='orange',fill=True,opacity=.4))cufflinks.set_config_file(world_readable=True)cufflinks.datagen.lines(2).iplot(kind='spread')cufflinks.datagen.heatmap().iplot(kind='heatmap')cufflinks.datagen.bubble(4).iplot(kind='bubble',x='x',y='y',text='text',size='size',categories='categories')cufflinks.datagen.bubble3d(4).iplot(kind='bubble3d',x='x',y='y',z='z',text='text',size='size',categories='categories')cufflinks.datagen.box().iplot(kind='box')cufflinks.datagen.surface().iplot(kind='surface')cufflinks.datagen.scatter3d().iplot(kind='scatter3d',x='x',y='y',z='z',text='text',categories='categories')cufflinks.datagen.histogram(2).iplot(kind='histogram')cufflinks.datagencufflinks.to_df(Figure)iplot(colorscale='accent') to plot a chart using an accent color scaleiplot(colors=['pink','red','yellow'])Overall
Maintained
Code review
PyPI
Latest release
Releases this year
1,556 followers · starred Jul 2017
796 followers · starred Jan 2018
1,005 followers · starred Sep 2018
128 followers · starred Oct 2021
Productivity Tools for Plotly + Pandas
Jupyter Notebook
3,099
426 commits
updated Jul 3, 2024
This library binds the power of plotly with the flexibility of pandas for easy plotting.
This library is available on https://github.com/santosjorge/cufflinks
This tutorial assumes that the plotly user credentials have already been configured as stated on the getting started guide.
Support for Plotly 4.x
Cufflinks is no longer compatible with Plotly 3.x
Support for Plotly 3.0
New iplot helper.
To see a comprehensive list of parameters
cf.help()
# For a list of supported figures
cf.help()
# Or to see the parameters supported that apply to a given figure try
cf.help('scatter')
cf.help('candle') #etc
Removed dependecies on ta-lib. This library is no longer required. All studies have be rewritten in Python.
QuantFigure is a new class that will generate a graph object with persistence.
Parameters can be added/modified at any given point.This can be as easy as:
df=cf.datagen.ohlc()
qf=cf.QuantFig(df,title='First Quant Figure',legend='top',name='GS')
qf.add_bollinger_bands()
qf.iplot()
qf.add_sma([10,20],width=2,color=['green','lightgreen'],legendgroup=True)
qf.add_rsi(periods=20,color='java')
qf.add_bollinger_bands(periods=20,boll_std=2,colors=['magenta','grey'],fill=True)
qf.add_volume()
qf.add_macd()
qf.iplot()
rangeslider to display a date range slider at the bottom
cf.datagen.ohlc().iplot(kind='candle',rangeslider=True)rangeselector to display buttons to change the date range displayed
cf.datagen.ohlc(500).iplot(kind='candle', rangeselector={ 'steps':['1y','2 months','5 weeks','ytd','2mtd','reset'], 'bgcolor' : ('grey',.3), 'x': 0.3 , 'y' : 0.95})fontsize,fontcolor,textangle
cf.datagen.lines(1,mode='stocks').iplot(kind='line', annotations={'2015-02-02':'Market Crash', '2015-03-01':'Recovery'}, textangle=-70,fontsize=13,fontcolor='grey')cf.datagen.lines(1,mode='stocks').iplot(kind='line', annotations=[{'text':'exactly here','x':'0.2', 'xref':'paper','arrowhead':2, 'textangle':-10,'ay':150,'arrowcolor':'red'}])Figure.iplot() to plot figurescf.datagen.ohlc().iplot(kind='candle')iplotxrange, yrange and zrange can be specified in iplot and getLayout
cf.datagen.lines(1).iplot(yrange=[5,15])layout_update can be set in iplot and getLayout to explicitly update any Layout valuecf.datagen.pie().iplot(kind='pie',labels='labels',values='values')datagen.ohlc()ohlc=cf.datagen.ohlc()ohlc.iplot(kind='candle',up_color='blue',down_color='red')ohlc=cf.datagen.ohlc()ohlc.iplot(kind='ohlc',up_color='blue',down_color='red')df=pd.DataFrame([x**2] for x in range(100))df.iplot(kind='lines',logy=True)cf.datagen.lines(1,5).iplot(kind='bar',error_y=[1,2,3.5,2,2])cf.datagen.lines(1,5).iplot(kind='bar',error_y=20, error_type='percent')cf.datagen.lines(1).iplot(kind='lines',error_y=20,error_type='continuous_percent')cf.datagen.lines(1).iplot(kind='lines',error_y=10,error_type='continuous',color='blue')cf.datagen.lines(1,500).ta_plot(study='sma',periods=[13,21,55])cf.datagen.lines(1,200).ta_plot(study='boll',periods=14)cf.datagen.lines(1,200).ta_plot(study='rsi',periods=14)cf.datagen.lines(1,200).ta_plot(study='macd',fast_period=12,slow_period=26, signal_period=9)cf.go_offline()cf.go_online()cf.iplot(figure,online=True) (To force online whilst on offline mode)fig=cf.datagen.lines(3,columns=['a','b','c']).figure()fig=fig.set_axis('b',side='right')cf.iplot(fig)cufflinks.set_config_file(theme='pearl')cufflinks.datagen.lines(5).iplot(theme='ggplot')cufflinks.datagen.lines(2).iplot(kind='barh',barmode='stack',bargap=.1)cufflinks.datagen.histogram().iplot(kind='histogram',orientation='h',norm='probability')cufflinks.datagen.lines(4).iplot(kind='area',fill=True,opacity=1)cufflinks.datagen.histogram(4).iplot(kind='histogram',subplots=True,bins=50)cufflinks.datagen.lines(4).iplot(subplots=True,shape=(4,1),shared_xaxes=True,vertical_spacing=.02,fill=True)cufflinks.datagen.lines(4,1000).scatter_matrix()cufflinks.datagen.lines(3).iplot(hline=[2,3])cufflinks.datagen.lines(3).iplot(hline=dict(y=2,color='blue',width=3))cufflinks.datagen.lines(3).iplot(hspan=(-1,2))cufflinks.datagen.lines(3).iplot(hspan=dict(y0=-1,y1=2,color='orange',fill=True,opacity=.4))cufflinks.set_config_file(world_readable=True)cufflinks.datagen.lines(2).iplot(kind='spread')cufflinks.datagen.heatmap().iplot(kind='heatmap')cufflinks.datagen.bubble(4).iplot(kind='bubble',x='x',y='y',text='text',size='size',categories='categories')cufflinks.datagen.bubble3d(4).iplot(kind='bubble3d',x='x',y='y',z='z',text='text',size='size',categories='categories')cufflinks.datagen.box().iplot(kind='box')cufflinks.datagen.surface().iplot(kind='surface')cufflinks.datagen.scatter3d().iplot(kind='scatter3d',x='x',y='y',z='z',text='text',categories='categories')cufflinks.datagen.histogram(2).iplot(kind='histogram')cufflinks.datagencufflinks.to_df(Figure)iplot(colorscale='accent') to plot a chart using an accent color scaleiplot(colors=['pink','red','yellow'])Overall
Maintained
Code review
PyPI
Latest release
Releases this year
1,556 followers · starred Jul 2017
796 followers · starred Jan 2018
1,005 followers · starred Sep 2018
128 followers · starred Oct 2021