Performant and effortless finance plotting for Python
Python
1,186
374 commits
updated Sep 24, 2026
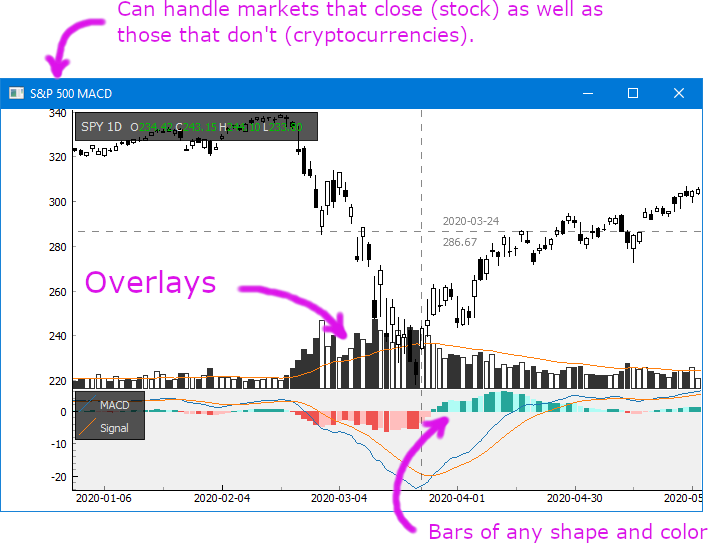
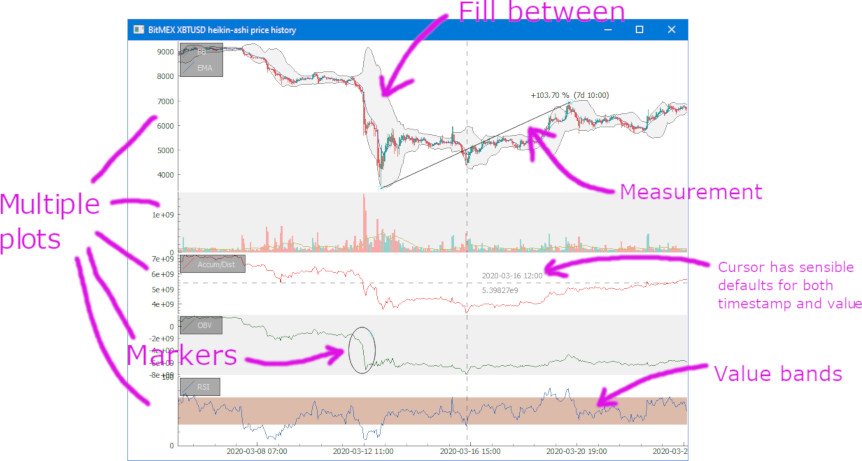
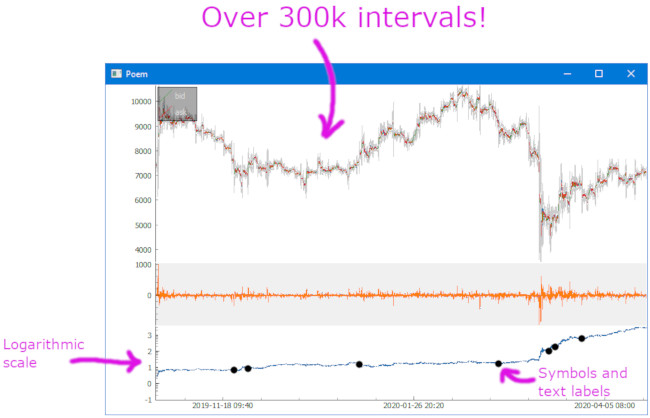
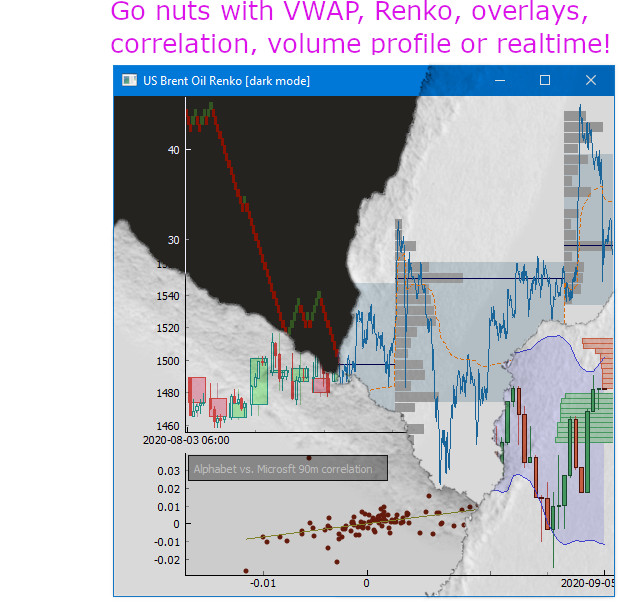
Finance Plotter, or finplot, is a performant library with a clean api to help you with your backtesting. It's optionated with good defaults, so you can start doing your work without having to setup plots, colors, scales, autoscaling, keybindings, handle panning+vertical zooming (which all non-finance libraries have problems with). And best of all: it can show hundreds of thousands of datapoints without batting an eye.


finplot is not a web app. It does not help you create an homebrew exchange. It does not work with Jupyter Labs.
It is only intended for you to do backtesting in. That is not to say that you can't create a ticker or a trade widget yourself. The library is based on the eminent pyqtgraph, which is fast and flexible, so feel free to hack away if that's what you want.
$ pip install finplot
Note: A recent fix ensures compatibility with Python 3.14 by avoiding in-place numpy operations on potentially read-only arrays. If you encountered a "read-only" error during normalization, please upgrade to the latest version.
It's straight-forward to start using. This shows every daily candle of Apple since the 80'ies:
import finplot as fplt
import yfinance

df = yfinance.download('AAPL')
fplt.candlestick_ochl(df[['Open', 'Close', 'High', 'Low']])
fplt.show()
For more examples and a bunch of snippets, see the examples directory or the wiki. There you'll find how to plot MACD, Parabolic SAR, RSI, volume profile and much more.
For future support and features, consider a small donation.
BTC: bc1qk8m8yh86l2pz4eypflchr0tkn5aeud6cmt426m
ETH: 0x684d7d4C52ed428AE9a36B2407ba909D896cDB67
Overall
Maintained
Code review
PyPI
Latest release
Releases this year
802 followers · starred Oct 2023
22 followers · starred Oct 2024
Performant and effortless finance plotting for Python
Python
1,186
374 commits
updated Sep 24, 2026
Finance Plotter, or finplot, is a performant library with a clean api to help you with your backtesting. It's optionated with good defaults, so you can start doing your work without having to setup plots, colors, scales, autoscaling, keybindings, handle panning+vertical zooming (which all non-finance libraries have problems with). And best of all: it can show hundreds of thousands of datapoints without batting an eye.
finplot is not a web app. It does not help you create an homebrew exchange. It does not work with Jupyter Labs.
It is only intended for you to do backtesting in. That is not to say that you can't create a ticker or a trade widget yourself. The library is based on the eminent pyqtgraph, which is fast and flexible, so feel free to hack away if that's what you want.
$ pip install finplot
Note: A recent fix ensures compatibility with Python 3.14 by avoiding in-place numpy operations on potentially read-only arrays. If you encountered a "read-only" error during normalization, please upgrade to the latest version.
It's straight-forward to start using. This shows every daily candle of Apple since the 80'ies:
import finplot as fplt
import yfinance

df = yfinance.download('AAPL')
fplt.candlestick_ochl(df[['Open', 'Close', 'High', 'Low']])
fplt.show()
For more examples and a bunch of snippets, see the examples directory or the wiki. There you'll find how to plot MACD, Parabolic SAR, RSI, volume profile and much more.
For future support and features, consider a small donation.
BTC: bc1qk8m8yh86l2pz4eypflchr0tkn5aeud6cmt426m
ETH: 0x684d7d4C52ed428AE9a36B2407ba909D896cDB67
Overall
Maintained
Code review
PyPI
Latest release
Releases this year
802 followers · starred Oct 2023
22 followers · starred Oct 2024



