
README
Jev vs Laya on Typed Decisions
A benchmark of two System One decision models on LocalLLaMA/typed-decisions, measuring accuracy against gold and inference speed.
| Model | How it runs |
|---|---|
| Jev | TypeSafe System One API (typesafe-sdk), commercial GPUs, zero-shot |
| Laya | convaiinnovations/laya, typed-decisions weights, local Apple M1 Pro CPU |
Dataset
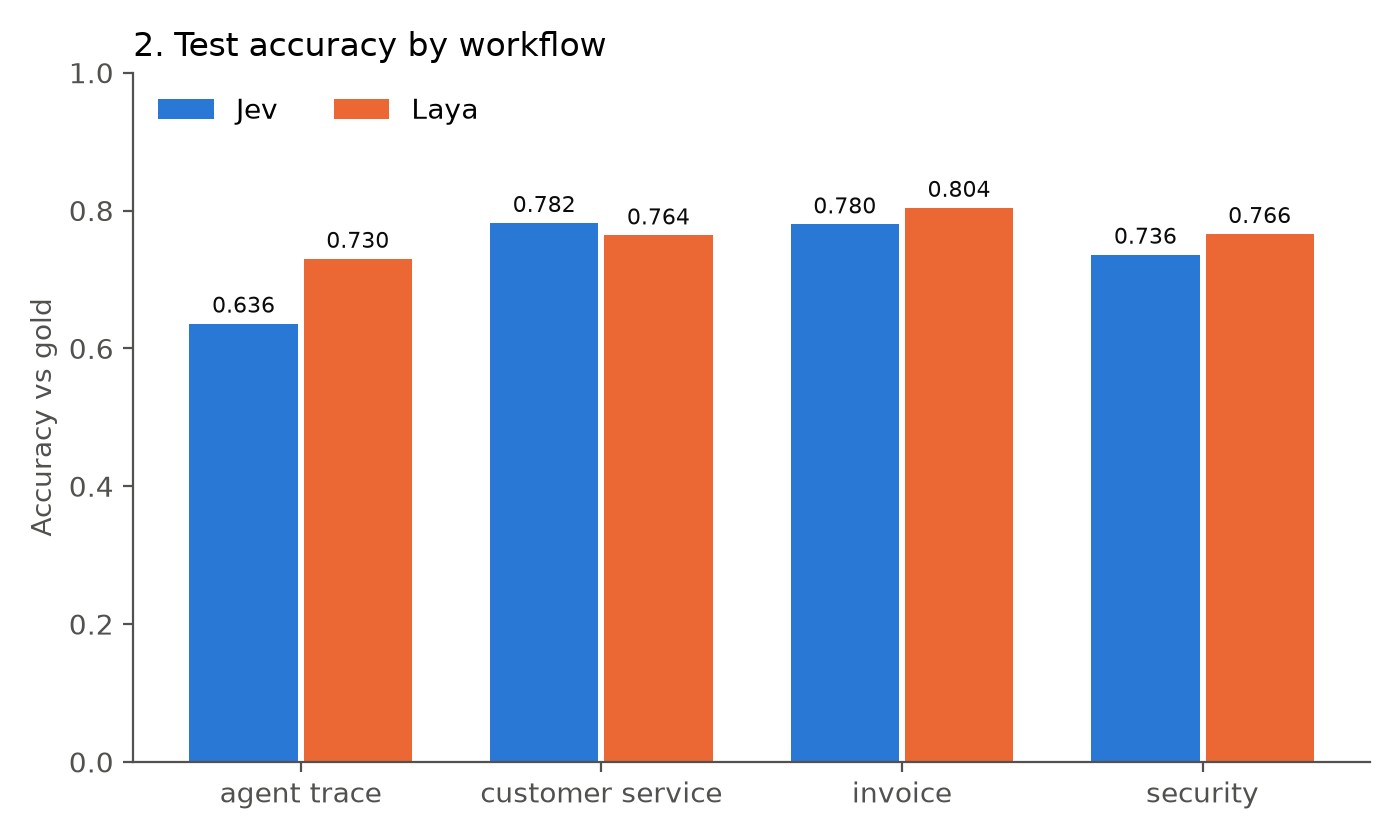
- 1,600 unique cases (1,200 train / 400 test) across 4 workflows: agent trace observability, customer service, invoice processing, security incidents.
- Each case asks 5 typed questions about one shared state:
choice(one of N labels),score(ordered rubric),noul(yes/no). That is 8,000 decisions per model. - Gold labels are the mean of 3 teacher-model samples. A prediction counts as correct when its most likely answer matches the gold label.
- Hugging Face lists 3,200 rows because the
allconfig duplicates the 4 per-workflow configs. The benchmark usesallonly, so no case is counted twice.
Results (test split, 400 cases)
| Model | Accuracy | choice | score | noul | p50 latency | p95 latency |
|---|---|---|---|---|---|---|
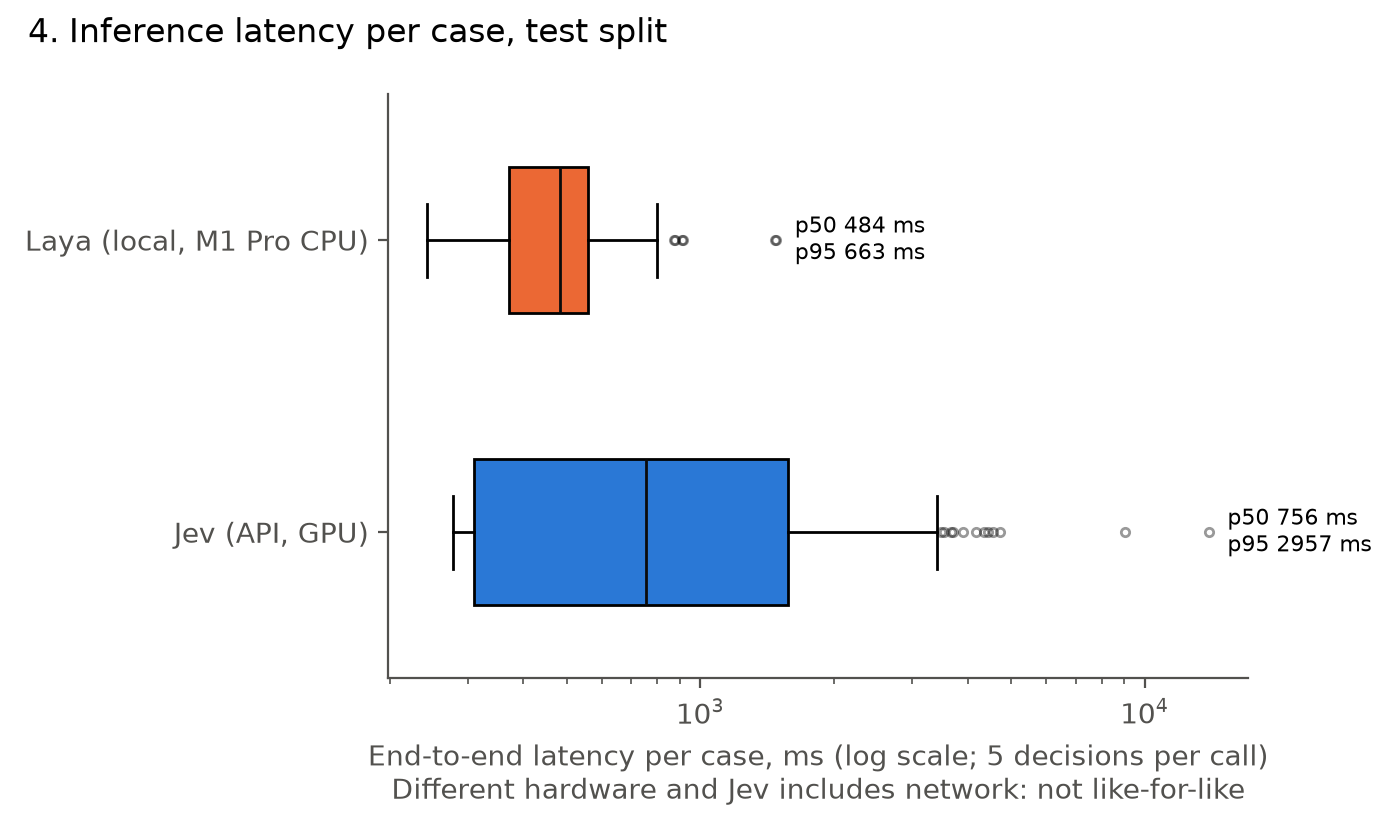
| Jev | 0.734 | 0.730 | 0.699 | 0.783 | 756 ms | 2,957 ms |
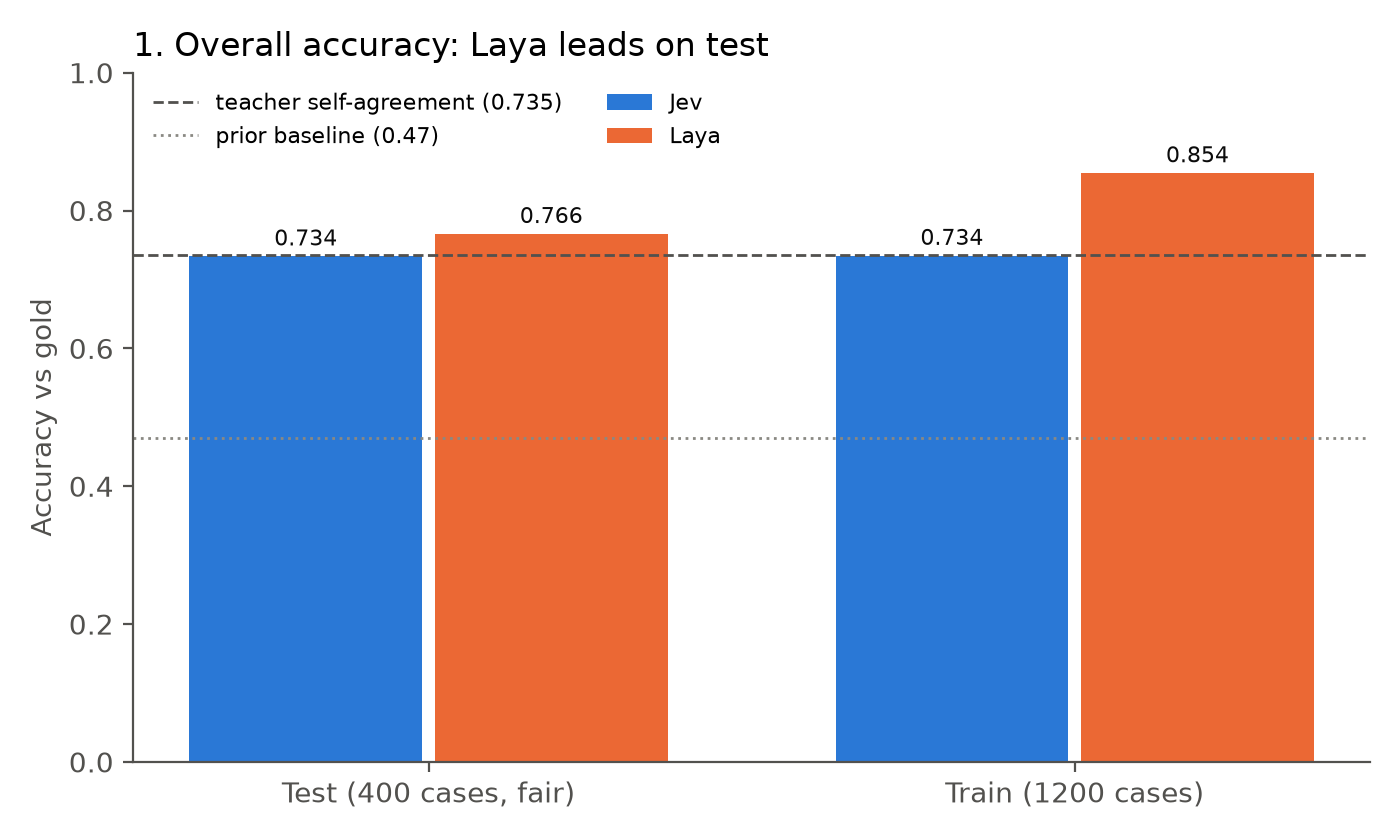
| Laya | 0.766 | 0.733 | 0.723 | 0.857 | 484 ms | 663 ms |
- Laya leads Jev by 3.2 points (95% bootstrap CI over cases: +1.1 to +5.5).
- Jev's 0.734 is close to its published leaderboard score (0.727), and Laya's matches its model card (0.766), so the scoring is consistent with independent results.
- Only the test split is a fair comparison. Laya's
typed-decisionscheckpoint was fine-tuned on this dataset's train split (per its model card), so it scores 0.854 on train vs 0.766 on test. Jev scores 0.734 on both. - These are different modes: Laya is fine-tuned on this benchmark, Jev answers without training on it. The dataset card says the two are not directly comparable.
- Latency is not like-for-like: Laya runs locally on CPU, while Jev's time includes the network round trip.

Run it
Needs a TYPESAFE_API_KEY in .env.
UV_PROJECT_ENVIRONMENT=venv uv sync
venv/bin/python benchmark.py          # calls both models on all 1,600 cases
venv/bin/python results_analysis.py   # builds the charts and PDF from the CSV
The benchmark makes 1,600 sequential Jev API calls, so expect it to take 20+ minutes.
Files
| File | What it is |
|---|---|
benchmark.py | Loads the dataset, runs both models, writes the results CSVs |
results_analysis.py | Builds the charts and PDF report from results/benchmark.csv |
results/benchmark.csv | One row per case, question and model: id, split, workflow, question, qtype, model, gold, pred, correct, latency_ms |
results/summary.csv | Aggregated accuracy and latency |
results/jev_vs_laya_report.pdf | One summary page plus the 4 charts |
results/figures/*.png | The 4 charts as images |
jev_quick_start.py, laya_quick_start.py | Minimal usage examples for each model |
License
Not covered
Accuracy only checks the most likely answer. Calibration metrics (Brier score, KL from the gold distribution, ECE) are not computed. Laya's model card reports that Jev matches the gold probability distributions better (0.580 vs 0.471), which this benchmark does not measure.
Similar repos





README
Jev vs Laya on Typed Decisions
A benchmark of two System One decision models on LocalLLaMA/typed-decisions, measuring accuracy against gold and inference speed.
| Model | How it runs |
|---|---|
| Jev | TypeSafe System One API (typesafe-sdk), commercial GPUs, zero-shot |
| Laya | convaiinnovations/laya, typed-decisions weights, local Apple M1 Pro CPU |
Dataset
- 1,600 unique cases (1,200 train / 400 test) across 4 workflows: agent trace observability, customer service, invoice processing, security incidents.
- Each case asks 5 typed questions about one shared state:
choice(one of N labels),score(ordered rubric),noul(yes/no). That is 8,000 decisions per model. - Gold labels are the mean of 3 teacher-model samples. A prediction counts as correct when its most likely answer matches the gold label.
- Hugging Face lists 3,200 rows because the
allconfig duplicates the 4 per-workflow configs. The benchmark usesallonly, so no case is counted twice.
Results (test split, 400 cases)
| Model | Accuracy | choice | score | noul | p50 latency | p95 latency |
|---|---|---|---|---|---|---|
| Jev | 0.734 | 0.730 | 0.699 | 0.783 | 756 ms | 2,957 ms |
| Laya | 0.766 | 0.733 | 0.723 | 0.857 | 484 ms | 663 ms |
- Laya leads Jev by 3.2 points (95% bootstrap CI over cases: +1.1 to +5.5).
- Jev's 0.734 is close to its published leaderboard score (0.727), and Laya's matches its model card (0.766), so the scoring is consistent with independent results.
- Only the test split is a fair comparison. Laya's
typed-decisionscheckpoint was fine-tuned on this dataset's train split (per its model card), so it scores 0.854 on train vs 0.766 on test. Jev scores 0.734 on both. - These are different modes: Laya is fine-tuned on this benchmark, Jev answers without training on it. The dataset card says the two are not directly comparable.
- Latency is not like-for-like: Laya runs locally on CPU, while Jev's time includes the network round trip.
Run it
Needs a TYPESAFE_API_KEY in .env.
UV_PROJECT_ENVIRONMENT=venv uv sync
venv/bin/python benchmark.py          # calls both models on all 1,600 cases
venv/bin/python results_analysis.py   # builds the charts and PDF from the CSV
The benchmark makes 1,600 sequential Jev API calls, so expect it to take 20+ minutes.
Files
| File | What it is |
|---|---|
benchmark.py | Loads the dataset, runs both models, writes the results CSVs |
results_analysis.py | Builds the charts and PDF report from results/benchmark.csv |
results/benchmark.csv | One row per case, question and model: id, split, workflow, question, qtype, model, gold, pred, correct, latency_ms |
results/summary.csv | Aggregated accuracy and latency |
results/jev_vs_laya_report.pdf | One summary page plus the 4 charts |
results/figures/*.png | The 4 charts as images |
jev_quick_start.py, laya_quick_start.py | Minimal usage examples for each model |
License
Not covered
Accuracy only checks the most likely answer. Calibration metrics (Brier score, KL from the gold distribution, ECE) are not computed. Laya's model card reports that Jev matches the gold probability distributions better (0.580 vs 0.471), which this benchmark does not measure.