
Performance analysis for Python.






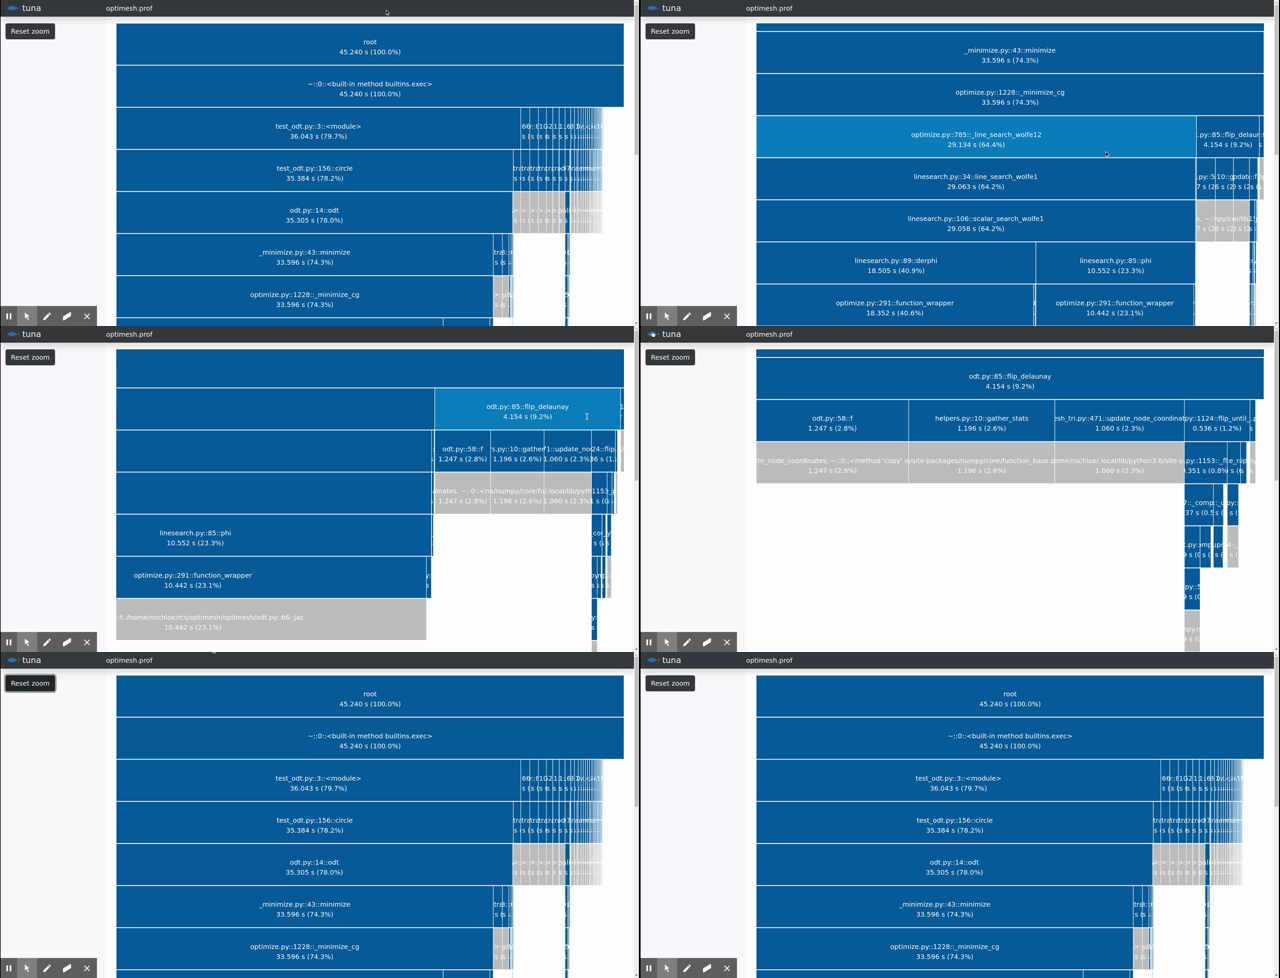
tuna is a modern, lightweight Python profile viewer inspired by SnakeViz. It handles runtime and import profiles, has minimal dependencies, uses d3 and bootstrap, and avoids certain errors present in SnakeViz (see below) and is faster, too.
Create a runtime profile with
python -mcProfile -o program.prof yourfile.py
or an import profile with
python -X importtime yourfile.py 2> import.log
and show it with
tuna program.prof
The whole timed call tree cannot be retrieved from profile data. Python developers made the decision to only store parent data in profiles because it can be computed with little overhead. To illustrate, consider the following program.
import time


def a(t0, t1):
    c(t0)
    d(t1)


def b():
    a(1, 4)


def c(t):
    time.sleep(t)


def d(t):
    time.sleep(t)


if __name__ == "__main__":
    a(4, 1)
    b()
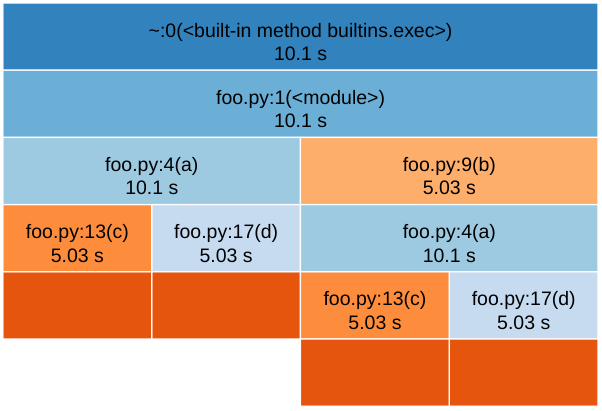
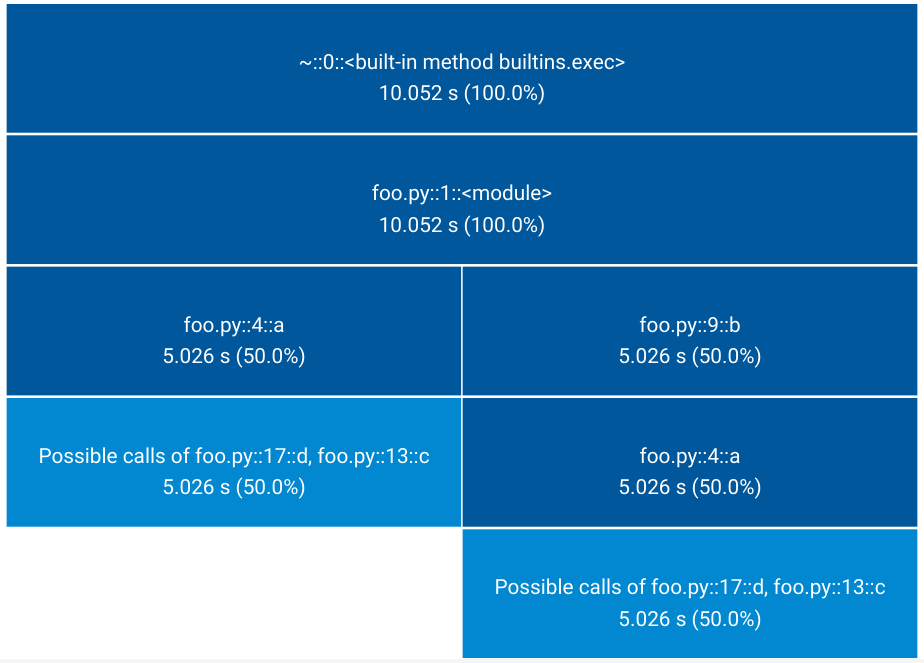
The root process (__main__) calls a() which spends 4 seconds in c() and 1 second
in d(). __main__ also calls b() which calls a(), this time spending 1 second in
c() and 4 seconds in d(). The profile, however, will only store that c() spent a
total of 5 seconds when called from a(), and likewise d(). The information that the
program spent more time in c() when called in root -> a() -> c() than when called in
root -> b() -> a() -> c() is not present in the profile.
tuna only displays the part of the timed call tree that can be deduced from the profile. SnakeViz, on the other hand, tries to construct the entire call tree, but ends up providing lots of wrong timings.
 |  |
|---|---|
| SnakeViz output. Wrong. | tuna output. Only shows what can be retrieved from the profile. |
tuna is available from the Python Package Index, so simply do
pip install tuna
to install.
tuna includes a tuna line / cell magic which can be used as a drop-in replacement for
the prun magic. Simply run %load_ext tuna to load the magic and then call it like
%tuna sleep(3) or
%%tuna
sleep(3)
prun is still used to do the actual profiling and then the results are displayed in
the notebook.
After forking and cloning the repository, make sure to run just dep to install
additional dependencies (bootstrap and d3) which aren't stored in the repo.
This software is published under the GPLv3 license.
Overall
Maintained
Code review
PyPI
Latest release
Releases this year
(top 24 of 61)
535 followers · starred Jun 2026
945 followers · starred Apr 2022
783 followers · starred Jul 2018
3,982 followers · starred Oct 2021
Performance analysis for Python.
tuna is a modern, lightweight Python profile viewer inspired by SnakeViz. It handles runtime and import profiles, has minimal dependencies, uses d3 and bootstrap, and avoids certain errors present in SnakeViz (see below) and is faster, too.
Create a runtime profile with
python -mcProfile -o program.prof yourfile.py
or an import profile with
python -X importtime yourfile.py 2> import.log
and show it with
tuna program.prof
The whole timed call tree cannot be retrieved from profile data. Python developers made the decision to only store parent data in profiles because it can be computed with little overhead. To illustrate, consider the following program.
import time


def a(t0, t1):
    c(t0)
    d(t1)


def b():
    a(1, 4)


def c(t):
    time.sleep(t)


def d(t):
    time.sleep(t)


if __name__ == "__main__":
    a(4, 1)
    b()
The root process (__main__) calls a() which spends 4 seconds in c() and 1 second
in d(). __main__ also calls b() which calls a(), this time spending 1 second in
c() and 4 seconds in d(). The profile, however, will only store that c() spent a
total of 5 seconds when called from a(), and likewise d(). The information that the
program spent more time in c() when called in root -> a() -> c() than when called in
root -> b() -> a() -> c() is not present in the profile.
tuna only displays the part of the timed call tree that can be deduced from the profile. SnakeViz, on the other hand, tries to construct the entire call tree, but ends up providing lots of wrong timings.
| |
|---|---|
| SnakeViz output. Wrong. | tuna output. Only shows what can be retrieved from the profile. |
tuna is available from the Python Package Index, so simply do
pip install tuna
to install.
tuna includes a tuna line / cell magic which can be used as a drop-in replacement for
the prun magic. Simply run %load_ext tuna to load the magic and then call it like
%tuna sleep(3) or
%%tuna
sleep(3)
prun is still used to do the actual profiling and then the results are displayed in
the notebook.
After forking and cloning the repository, make sure to run just dep to install
additional dependencies (bootstrap and d3) which aren't stored in the repo.
This software is published under the GPLv3 license.
Overall
Maintained
Code review
PyPI
Latest release
Releases this year
(top 24 of 61)
535 followers · starred Jun 2026
945 followers · starred Apr 2022
783 followers · starred Jul 2018
3,982 followers · starred Oct 2021