






perfplot extends Python's timeit by testing snippets with input parameters (e.g., the size of an array) and plotting the results.
For example, to compare different NumPy array concatenation methods, the script
import numpy as np
import perfplot

perfplot.show(
    setup=lambda n: np.random.rand(n),  # or setup=np.random.rand
    kernels=[
        lambda a: np.c_[a, a],
        lambda a: np.stack([a, a]).T,
        lambda a: np.vstack([a, a]).T,
        lambda a: np.column_stack([a, a]),
        lambda a: np.concatenate([a[:, None], a[:, None]], axis=1),
    ],
    labels=["c_", "stack", "vstack", "column_stack", "concat"],
    n_range=[2**k for k in range(25)],
    xlabel="len(a)",
    # More optional arguments with their default values:
    # logx="auto",  # set to True or False to force scaling
    # logy="auto",
    # equality_check=np.allclose,  # set to None to disable "correctness" assertion
    # show_progress=True,
    # target_time_per_measurement=1.0,
    # max_time=None,  # maximum time per measurement
    # time_unit="s",  # set to one of ("auto", "s", "ms", "us", or "ns") to force plot units
    # relative_to=1,  # plot the timings relative to one of the measurements
    # flops=lambda n: 3*n,  # FLOPS plots
)
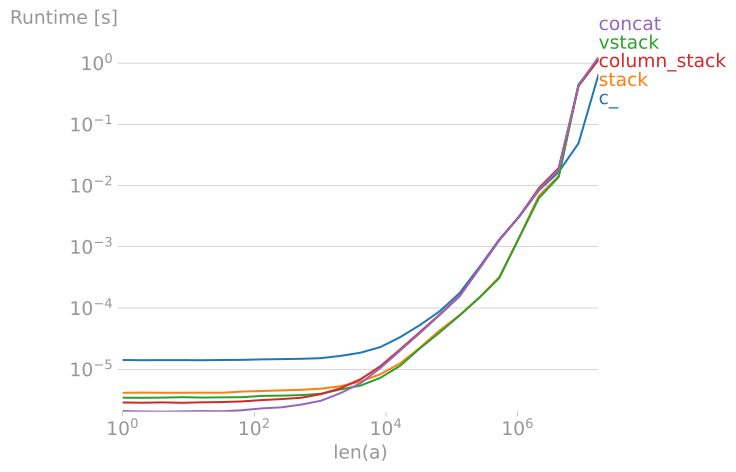
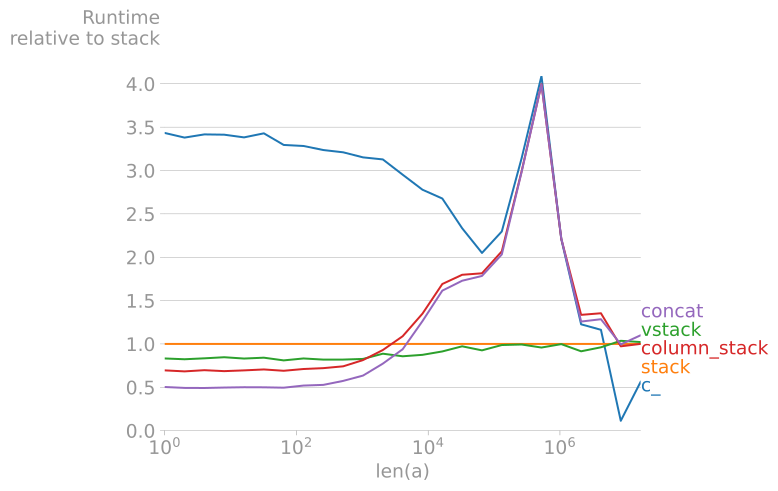
produces
 |  |
|---|
Clearly, stack and vstack are the best options for large arrays.
(By default, perfplot asserts the equality of the output of all snippets, too.)
If your plot takes a while to generate, you can also use
perfplot.live(
    # ...
)
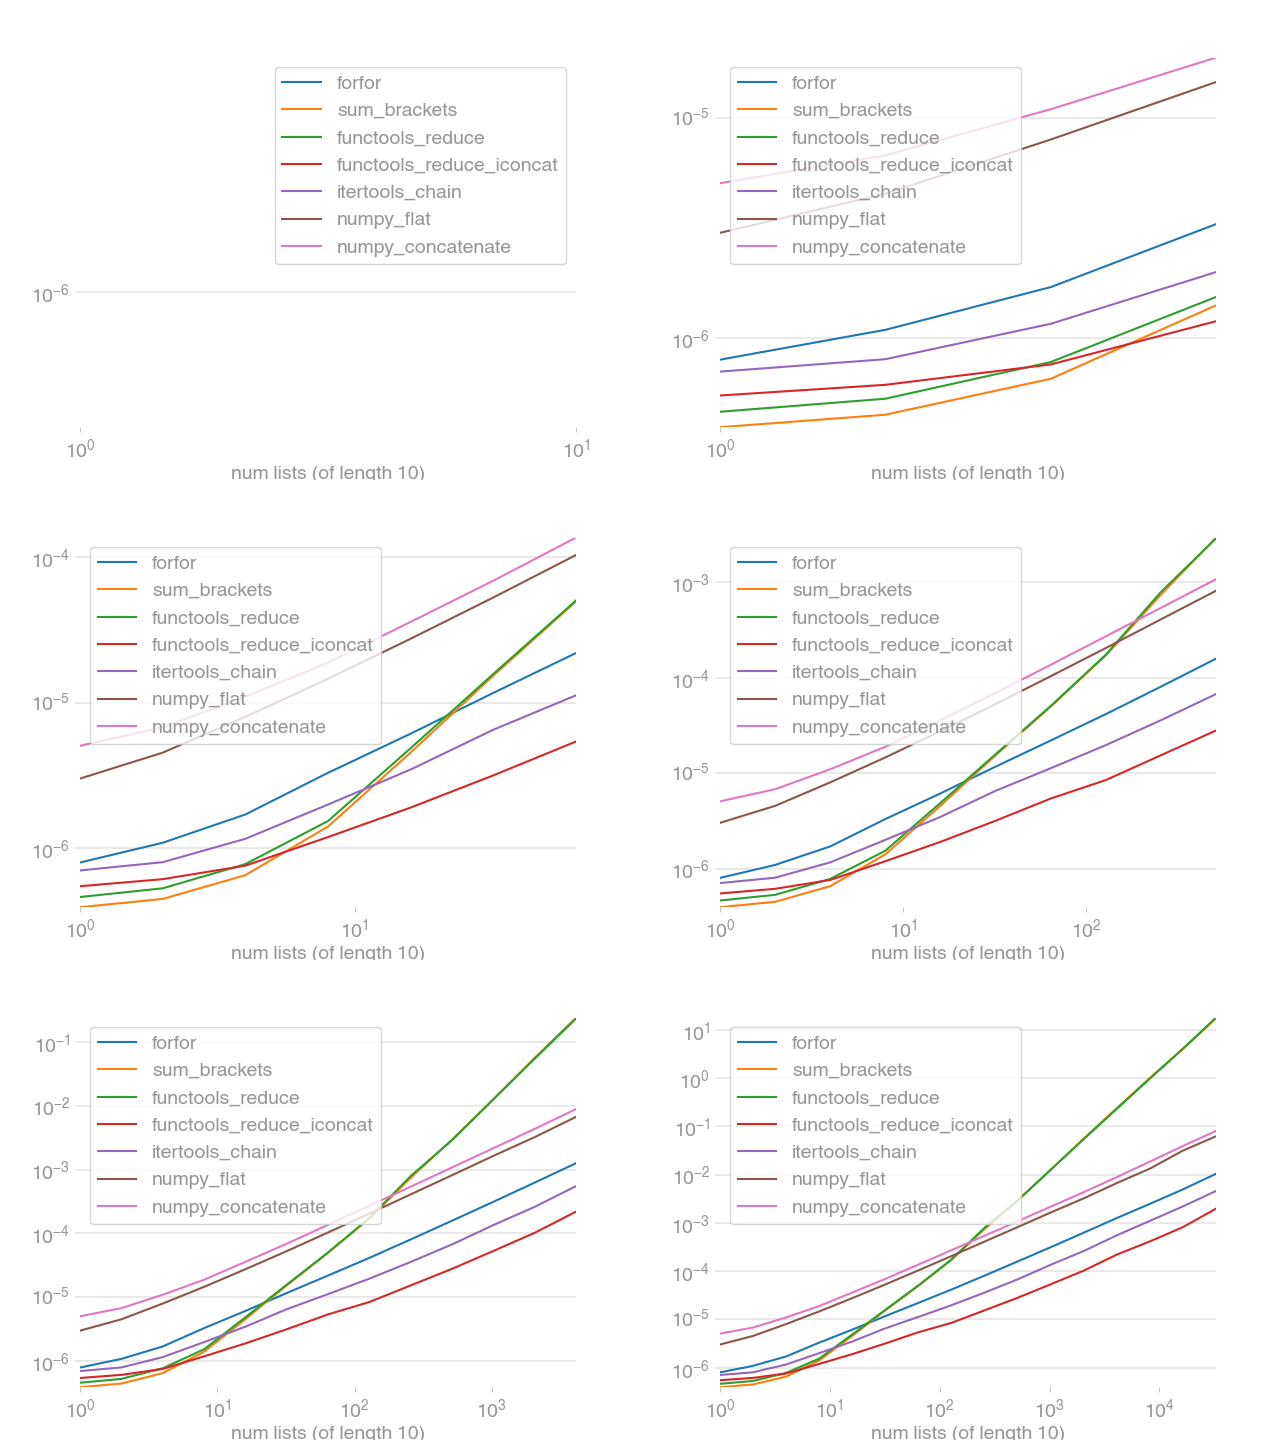
with the same arguments as above. It will plot the updates live.
Benchmarking and plotting can be separated. This allows multiple plots of the same data, for example:
out = perfplot.bench(
    # same arguments as above (except the plot-related ones, like time_unit or log*)
)
out.show()
out.save("perf.png", transparent=True, bbox_inches="tight")
Other examples:
perfplot is available from the Python Package Index, so simply do
pip install perfplot
to install.
To run the perfplot unit tests, check out this repository and type
tox
This software is published under the GPLv3 license.
Overall
Maintained
Code review
PyPI
Latest release
Releases this year
407 followers · starred Nov 2020
175 followers · starred Jan 2018
186 followers · starred Feb 2025
153 followers · starred Jun 2020
perfplot extends Python's timeit by testing snippets with input parameters (e.g., the size of an array) and plotting the results.
For example, to compare different NumPy array concatenation methods, the script
import numpy as np
import perfplot

perfplot.show(
    setup=lambda n: np.random.rand(n),  # or setup=np.random.rand
    kernels=[
        lambda a: np.c_[a, a],
        lambda a: np.stack([a, a]).T,
        lambda a: np.vstack([a, a]).T,
        lambda a: np.column_stack([a, a]),
        lambda a: np.concatenate([a[:, None], a[:, None]], axis=1),
    ],
    labels=["c_", "stack", "vstack", "column_stack", "concat"],
    n_range=[2**k for k in range(25)],
    xlabel="len(a)",
    # More optional arguments with their default values:
    # logx="auto",  # set to True or False to force scaling
    # logy="auto",
    # equality_check=np.allclose,  # set to None to disable "correctness" assertion
    # show_progress=True,
    # target_time_per_measurement=1.0,
    # max_time=None,  # maximum time per measurement
    # time_unit="s",  # set to one of ("auto", "s", "ms", "us", or "ns") to force plot units
    # relative_to=1,  # plot the timings relative to one of the measurements
    # flops=lambda n: 3*n,  # FLOPS plots
)
produces
| |
|---|
Clearly, stack and vstack are the best options for large arrays.
(By default, perfplot asserts the equality of the output of all snippets, too.)
If your plot takes a while to generate, you can also use
perfplot.live(
    # ...
)
with the same arguments as above. It will plot the updates live.
Benchmarking and plotting can be separated. This allows multiple plots of the same data, for example:
out = perfplot.bench(
    # same arguments as above (except the plot-related ones, like time_unit or log*)
)
out.show()
out.save("perf.png", transparent=True, bbox_inches="tight")
Other examples:
perfplot is available from the Python Package Index, so simply do
pip install perfplot
to install.
To run the perfplot unit tests, check out this repository and type
tox
This software is published under the GPLv3 license.
Overall
Maintained
Code review
PyPI
Latest release
Releases this year
407 followers · starred Nov 2020
175 followers · starred Jan 2018
186 followers · starred Feb 2025
153 followers · starred Jun 2020





