
See what people are saying
README
DiskWatch
Disk diagnostics in your terminal.





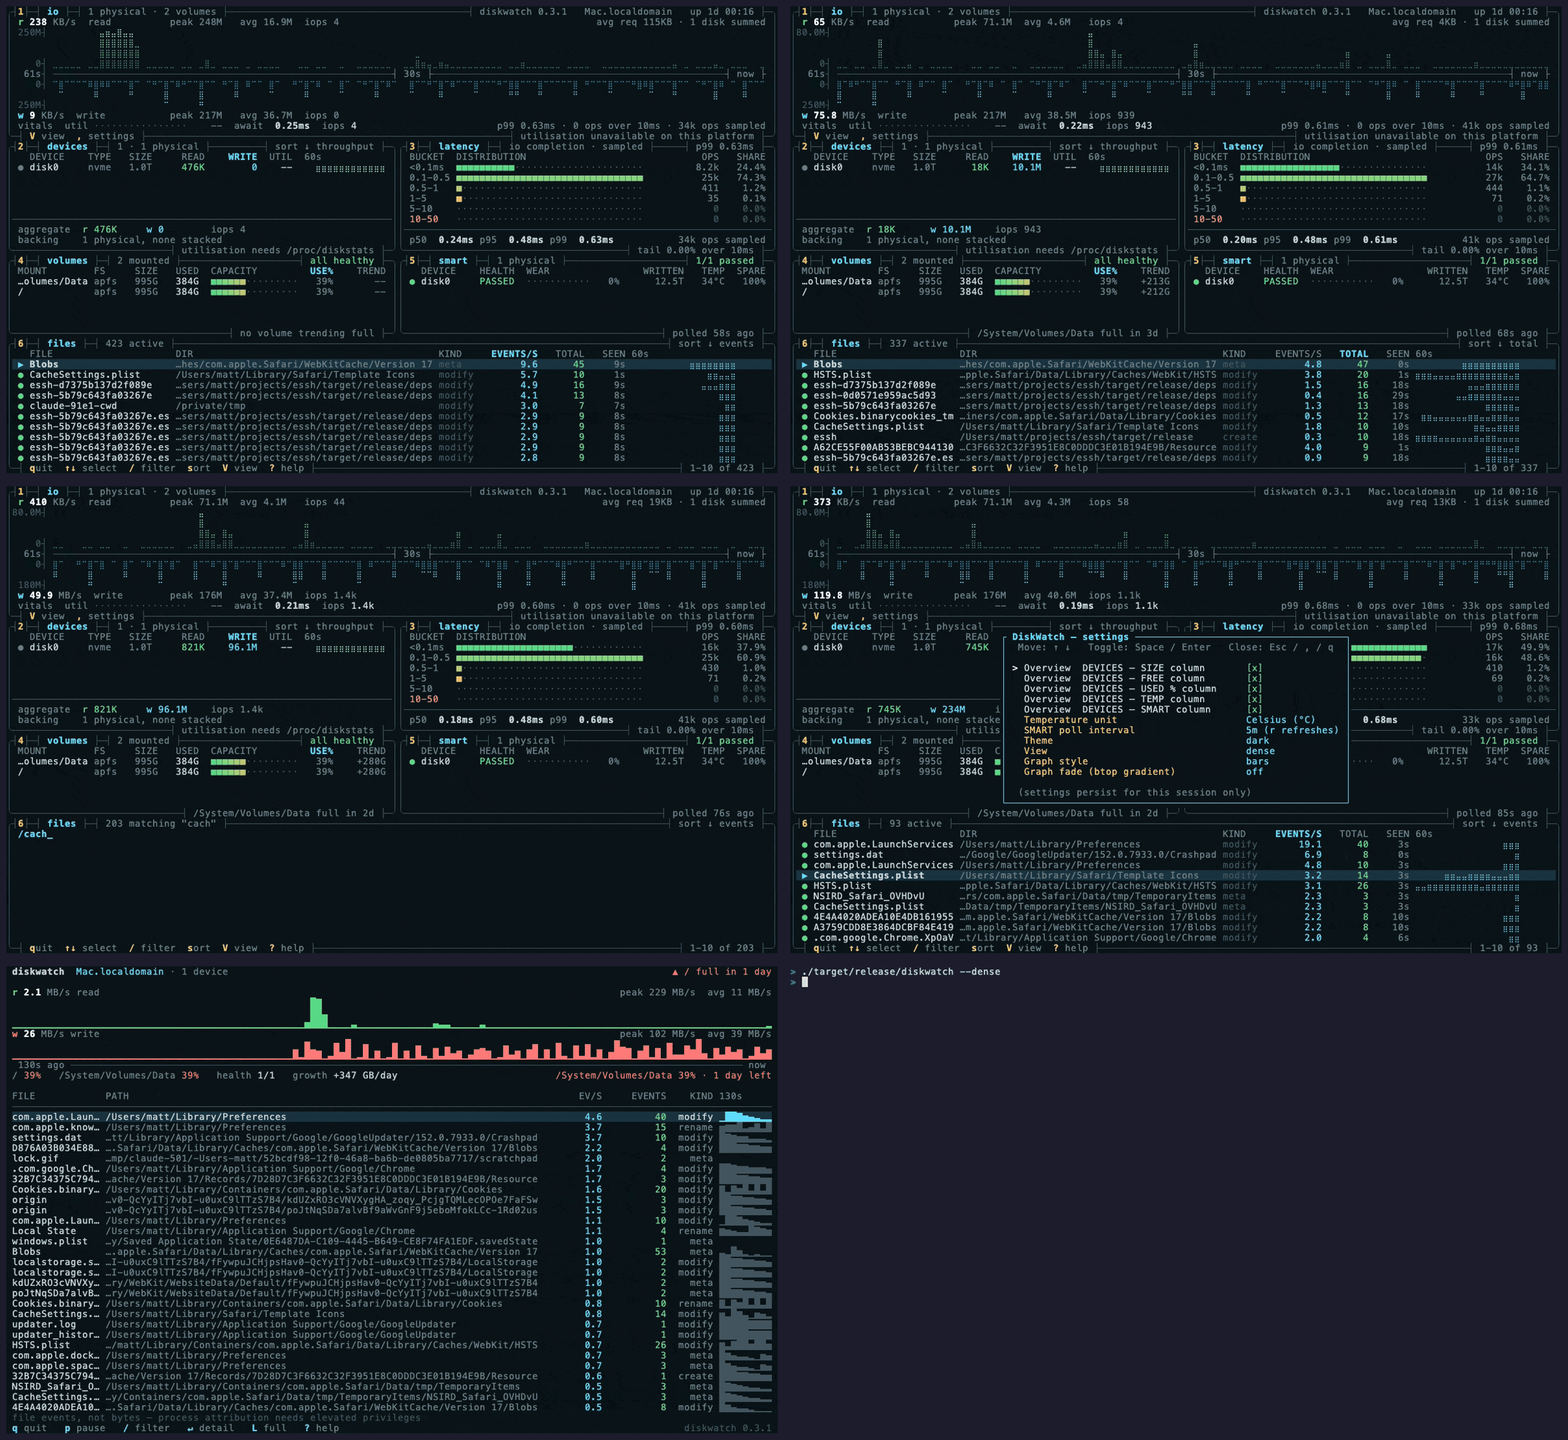
Live disk activity in diskwatch --dense.
Inspect disk activity, capacity, health and busy files. DiskWatch brings devices, volumes, filesystems and IO into one terminal, with anomaly cards to help investigate problems. It is read-only and needs no configuration to get started.
Install
brew install diskwatch                # macOS / Linux
nix-shell -p diskwatch                # NixOS / Nix
paru -S diskwatch                     # Arch (AUR)
cargo install diskwatch               # build from source with Rust
x eget use matthart1983/diskwatch     # prebuilt release binary
Prebuilt binaries are available for macOS and Linux (x86_64 and aarch64), including static Linux builds, plus Linux armv5te and Windows x86_64. Build from source.
Install smartmontools for full SMART attribute tables. Without it, SMART reporting
is limited to the basic health flag where available.
Run
diskwatch                       # eight tabs
diskwatch --lite                # one 80×24 screen
diskwatch --dense               # six panels on one screen
diskwatch --watch ~/src         # watch a specific tree instead of the defaults
diskwatch --diag                # print collected state and exit
1–8 switch tabs, V cycles views, , opens settings, ? shows help, q quits.
Every keybinding · All options
The tabs
| Key | Tab | Shows |
|---|---|---|
| 1 | Overview | Device summary, aggregate IO and capacity |
| 2 | Devices | Model, firmware, serial, usage and device details |
| 3 | Volumes | APFS containers or Linux mdraid state and resync progress |
| 4 | FS | Mounts, capacity and usage thresholds |
| 5 | IO | Per-device throughput, history and sampled latency |
| 6 | SMART | Drive health and available NVMe/ATA attributes |
| 7 | Hot Files | Paths ranked by event rate, with inferred process attribution |
| 8 | Insights | Capacity, health, wear, temperature and activity anomalies |
Full-view demo. Available measurements vary by platform and permissions.
Views
| View | Size | For |
|---|---|---|
| Full | Tabbed | Exploring individual devices and subsystems |
Lite (--lite) | 80×24 | Throughput, capacity and busy files in an SSH session or tmux split |
Dense (--dense) | Full layout at 104×32 or larger | IO, devices, latency, volumes, SMART and files together |
Dense uses a compact layout in smaller terminals. / filters files in Lite and
Dense; s cycles file sorting in Dense.
View details.
Measurement limits
Hot Files infers the busiest process holding a path open; it does not identify the writer of each event. Sampling can miss short-lived writers, and unprivileged attribution is limited to your user.
Latency percentiles and histograms use sampled interval averages, not individual
IO timings. macOS does not expose the device busy-time counter used for Linux
utilisation. Unsupported measurements display --.
Capability matrix.
Docs
| Reference | Views, controls, installation and CLI options |
| Configuration | Themes, columns, refresh settings and config precedence |
| Watch paths | Watch roots, defaults and Linux inotify limits |
| Process attribution | How Hot Files associates paths with processes |
| Capabilities | Platform support and measurement limits |
Related
NetWatch covers network diagnostics; SysWatch covers system activity. They share the terminal layout and palette.
Thanks
Community packagers maintain the Nix and Arch packages. Repology tracks package versions. File packaging issues with the packagers and DiskWatch bugs here.
License
MIT
Significant stargazers

5,295 followers · starred Sep 2026

469 followers · starred Jul 2026

18 followers · starred Jul 2026
710 followers · starred May 2026
Similar repos


Languages
Rust
99.4%
See what people are saying
README
DiskWatch
Disk diagnostics in your terminal.
Live disk activity in diskwatch --dense.
Inspect disk activity, capacity, health and busy files. DiskWatch brings devices, volumes, filesystems and IO into one terminal, with anomaly cards to help investigate problems. It is read-only and needs no configuration to get started.
Install
brew install diskwatch                # macOS / Linux
nix-shell -p diskwatch                # NixOS / Nix
paru -S diskwatch                     # Arch (AUR)
cargo install diskwatch               # build from source with Rust
x eget use matthart1983/diskwatch     # prebuilt release binary
Prebuilt binaries are available for macOS and Linux (x86_64 and aarch64), including static Linux builds, plus Linux armv5te and Windows x86_64. Build from source.
Install smartmontools for full SMART attribute tables. Without it, SMART reporting
is limited to the basic health flag where available.
Run
diskwatch                       # eight tabs
diskwatch --lite                # one 80×24 screen
diskwatch --dense               # six panels on one screen
diskwatch --watch ~/src         # watch a specific tree instead of the defaults
diskwatch --diag                # print collected state and exit
1–8 switch tabs, V cycles views, , opens settings, ? shows help, q quits.
Every keybinding · All options
The tabs
| Key | Tab | Shows |
|---|---|---|
| 1 | Overview | Device summary, aggregate IO and capacity |
| 2 | Devices | Model, firmware, serial, usage and device details |
| 3 | Volumes | APFS containers or Linux mdraid state and resync progress |
| 4 | FS | Mounts, capacity and usage thresholds |
| 5 | IO | Per-device throughput, history and sampled latency |
| 6 | SMART | Drive health and available NVMe/ATA attributes |
| 7 | Hot Files | Paths ranked by event rate, with inferred process attribution |
| 8 | Insights | Capacity, health, wear, temperature and activity anomalies |
Full-view demo. Available measurements vary by platform and permissions.
Views
| View | Size | For |
|---|---|---|
| Full | Tabbed | Exploring individual devices and subsystems |
Lite (--lite) | 80×24 | Throughput, capacity and busy files in an SSH session or tmux split |
Dense (--dense) | Full layout at 104×32 or larger | IO, devices, latency, volumes, SMART and files together |
Dense uses a compact layout in smaller terminals. / filters files in Lite and
Dense; s cycles file sorting in Dense.
View details.
Measurement limits
Hot Files infers the busiest process holding a path open; it does not identify the writer of each event. Sampling can miss short-lived writers, and unprivileged attribution is limited to your user.
Latency percentiles and histograms use sampled interval averages, not individual
IO timings. macOS does not expose the device busy-time counter used for Linux
utilisation. Unsupported measurements display --.
Capability matrix.
Docs
| Reference | Views, controls, installation and CLI options |
| Configuration | Themes, columns, refresh settings and config precedence |
| Watch paths | Watch roots, defaults and Linux inotify limits |
| Process attribution | How Hot Files associates paths with processes |
| Capabilities | Platform support and measurement limits |
Related
NetWatch covers network diagnostics; SysWatch covers system activity. They share the terminal layout and palette.
Thanks
Community packagers maintain the Nix and Arch packages. Repology tracks package versions. File packaging issues with the packagers and DiskWatch bugs here.
License
MIT
Similar repos
Significant stargazers
5,295 followers · starred Sep 2026
469 followers · starred Jul 2026
18 followers · starred Jul 2026
710 followers · starred May 2026
Languages
Rust
99.4%