evoluteur/repo-atlas

Type a GitHub username, get the map of what they've actually built: repos clustered by topic, stars over time, and the popular-but-stale ones flagged.

JavaScript

1

5 commits

updated Oct 12, 2026

See the code

README

repo-atlas

Type a GitHub username, get the map of what they've actually built: repos clustered by topic, stars over time, and the popular-but-stale ones flagged.

Live: https://evoluteur.github.io/repo-atlas/ · permalink per user: ?u=<username>
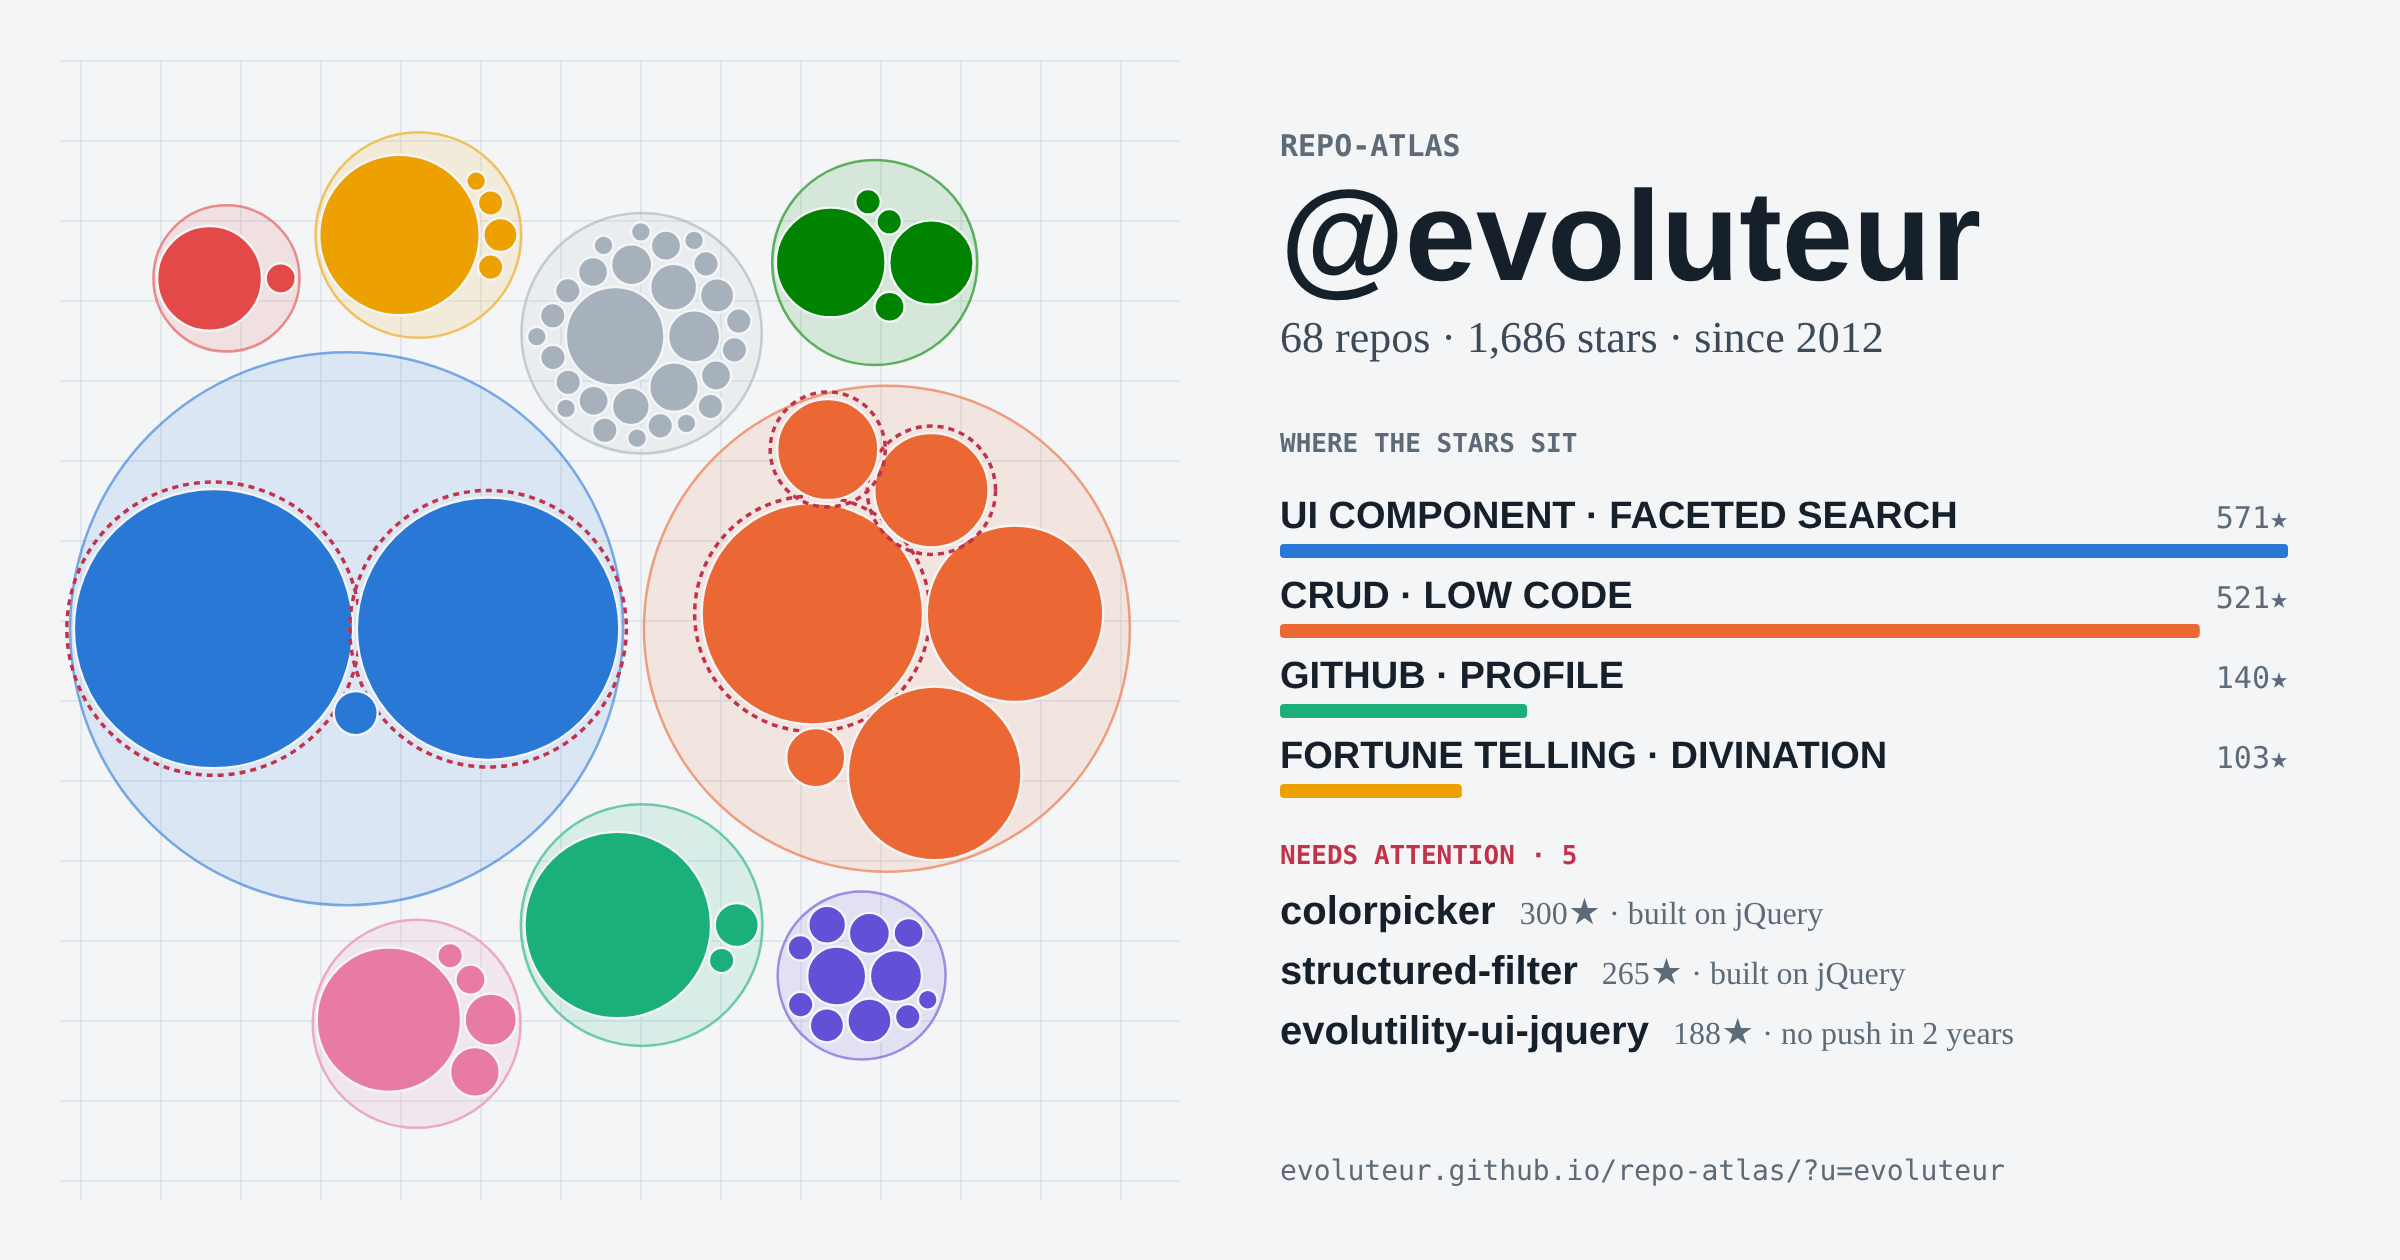
repo-atlas share card

What it shows

  • The map. Every public repo as a disc (area ∝ stars), grouped into regions of repos that share topics. Hover for details, click to open the repo.
  • Groups by stars. The legend ranks the regions by the stars they hold, so you see where the attention actually sits.
  • Needs attention. Repos people clearly wanted (stars in the account's top fifth, and at least 10) that are idle for over a year, archived, or built on a stack few people start with today (jQuery, AngularJS, Backbone, Bower…). Heavily forked ones get a hint that the forks may hold fixes.
  • Stars over time. Without a token: stars held today, stacked by the year each repo was born. With a token: real cumulative star history per group, from stargazer dates.
  • Share. A 1200×630 card for social posts and a permalink.

How grouping works

  1. Each repo's topics are normalised (plurals folded, generic tags like javascript, svg, ui dropped) and hyphenated topics also contribute their parts (sacred-geometry → sacred, geometry).
  2. Tokens are weighted by inverse document frequency across the account. Tokens used once, or by more than 45% of repos, carry no signal and are dropped. Repos with almost no topics fall back to description words.
  3. Repos are compared by cosine similarity and merged bottom-up (average linkage) until no two groups are more than 0.16 alike.
  4. The eight groups holding the most stars get a color and a two-word name (the tokens most frequent inside the group and rarest outside it). Everything else folds into loners.

All of this is in src/atlas.js: pure functions, no DOM, tested with node --test.

Tokens and rate limits

Everything runs in the browser against the public GitHub REST API.

  • The map and the attention list work anonymously (60 requests/hour per IP; a typical account takes 2).
  • GitHub only lists when each star was given to authenticated callers, so the star-history chart needs a token. A fine-grained token with no extra permissions is enough. It is kept in sessionStorage for the tab and only sent to api.github.com.
  • Big repos are sampled: every stargazer page for repos under 500 stars, otherwise the first, last and three evenly spaced pages. Each fetched star is an exact (count, date) point; months in between are interpolated.
  • Results are cached in localStorage (repos 1 hour, star history 24 hours).

If the API can't be reached (rate limit, offline), the page lets you paste the JSON from api.github.com/users/<login>/repos?per_page=100 and maps that instead.

Run it

No build step. Serve the folder and open it:

npx serve .            # or: python3 -m http.server
open http://localhost:3000/?u=evoluteur
npm test                # clustering, flags and timeline math
npm run build           # dist/repo-atlas.html: one self-contained file

Files

index.html          page shell
src/atlas.js        clustering, attention flags, timelines (pure, Node-testable)
src/github.js       REST client: repos, sampled stargazer pages
src/charts.js       D3: circle-pack map, birth-year columns, stacked star history
src/card.js         1200×630 share card on canvas
src/app.js          page controller: loading, caching, permalink, share
src/styles.css      tokens for light and dark themes
scripts/build-single.js
test/atlas.test.js

Reuses ideas from meet-the-fans (GitHub API + D3), github-projects-cards and npm-pulse.

Useful map? Sponsor me on GitHub to keep tools like this free.

License

Repo-Atlas is Open Source with MIT license.

Copyright (c) 2026 Olivier Giulieri.

clustering
d3
developer-tools
github
github-api
open-source
portfolio
repositories
stargazers
star-history
stars
tech-debt
topics
visualization

evoluteur/repo-atlas

Type a GitHub username, get the map of what they've actually built: repos clustered by topic, stars over time, and the popular-but-stale ones flagged.

JavaScript

1

5 commits

updated Oct 12, 2026

See the code

README

repo-atlas

Type a GitHub username, get the map of what they've actually built: repos clustered by topic, stars over time, and the popular-but-stale ones flagged.

Live: https://evoluteur.github.io/repo-atlas/ · permalink per user: ?u=<username>

repo-atlas share card

What it shows

  • The map. Every public repo as a disc (area ∝ stars), grouped into regions of repos that share topics. Hover for details, click to open the repo.
  • Groups by stars. The legend ranks the regions by the stars they hold, so you see where the attention actually sits.
  • Needs attention. Repos people clearly wanted (stars in the account's top fifth, and at least 10) that are idle for over a year, archived, or built on a stack few people start with today (jQuery, AngularJS, Backbone, Bower…). Heavily forked ones get a hint that the forks may hold fixes.
  • Stars over time. Without a token: stars held today, stacked by the year each repo was born. With a token: real cumulative star history per group, from stargazer dates.
  • Share. A 1200×630 card for social posts and a permalink.

How grouping works

  1. Each repo's topics are normalised (plurals folded, generic tags like javascript, svg, ui dropped) and hyphenated topics also contribute their parts (sacred-geometry → sacred, geometry).
  2. Tokens are weighted by inverse document frequency across the account. Tokens used once, or by more than 45% of repos, carry no signal and are dropped. Repos with almost no topics fall back to description words.
  3. Repos are compared by cosine similarity and merged bottom-up (average linkage) until no two groups are more than 0.16 alike.
  4. The eight groups holding the most stars get a color and a two-word name (the tokens most frequent inside the group and rarest outside it). Everything else folds into loners.

All of this is in src/atlas.js: pure functions, no DOM, tested with node --test.

Tokens and rate limits

Everything runs in the browser against the public GitHub REST API.

  • The map and the attention list work anonymously (60 requests/hour per IP; a typical account takes 2).
  • GitHub only lists when each star was given to authenticated callers, so the star-history chart needs a token. A fine-grained token with no extra permissions is enough. It is kept in sessionStorage for the tab and only sent to api.github.com.
  • Big repos are sampled: every stargazer page for repos under 500 stars, otherwise the first, last and three evenly spaced pages. Each fetched star is an exact (count, date) point; months in between are interpolated.
  • Results are cached in localStorage (repos 1 hour, star history 24 hours).

If the API can't be reached (rate limit, offline), the page lets you paste the JSON from api.github.com/users/<login>/repos?per_page=100 and maps that instead.

Run it

No build step. Serve the folder and open it:

npx serve .            # or: python3 -m http.server
open http://localhost:3000/?u=evoluteur
npm test                # clustering, flags and timeline math
npm run build           # dist/repo-atlas.html: one self-contained file

Files

index.html          page shell
src/atlas.js        clustering, attention flags, timelines (pure, Node-testable)
src/github.js       REST client: repos, sampled stargazer pages
src/charts.js       D3: circle-pack map, birth-year columns, stacked star history
src/card.js         1200×630 share card on canvas
src/app.js          page controller: loading, caching, permalink, share
src/styles.css      tokens for light and dark themes
scripts/build-single.js
test/atlas.test.js

Reuses ideas from meet-the-fans (GitHub API + D3), github-projects-cards and npm-pulse.

Useful map? Sponsor me on GitHub to keep tools like this free.

License

Repo-Atlas is Open Source with MIT license.

Copyright (c) 2026 Olivier Giulieri.

clustering
d3
developer-tools
github
github-api
open-source
portfolio
repositories
stargazers
star-history
stars
tech-debt
topics
visualization