
Browse the top 10,000 packages on PyPI with the help of vector embeddings
See the codeREADME
PyAtlas
What does this do?
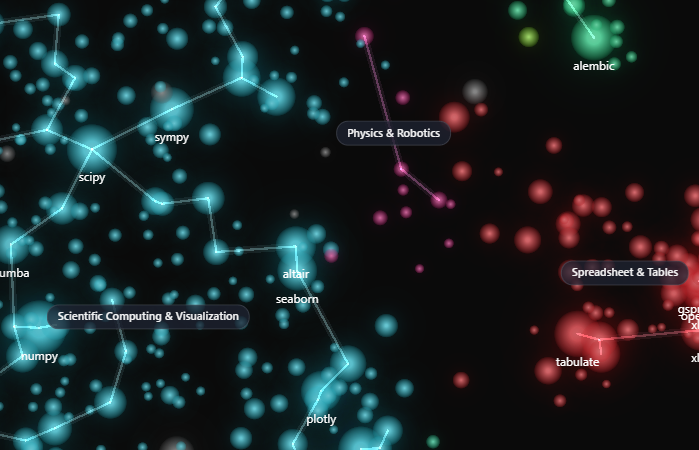
PyAtlas is an interactive map of the top 10,000 Python packages on PyPI. Packages with similar functionality are positioned close together, making it easy to discover alternatives or related tools. It’s mainly just a fun tech demo and hobby project, but it can also be a handy way to discover useful packages. For example, if you want to find packages similar to matplotlib, you can locate it on the map and explore the packages clustered around it.
How does this work?
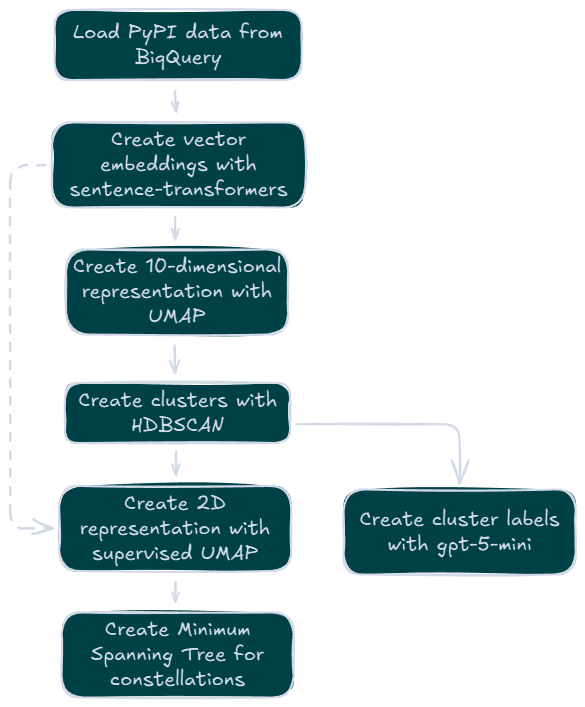
The project collects descriptions for the most popular packages on PyPI. These descriptions are converted into vector embeddings using Sentence Transformers. The high-dimensional embeddings are then reduced to 10 dimensions using UMAP, and packages are grouped into clusters using HDBSCAN. A second UMAP reduction creates the final 2D coordinates for visualization, using the cluster labels to keep similar packages together. Finally, cluster labels are generated using OpenAI's gpt-5-mini to describe each group.
Stack
The project uses the following technologies:
- React with Three.js for the interactive visualization
- Sentence Transformers for vector embeddings
- UMAP for dimensionality reduction
- HDBSCAN for clustering
- OpenAI for generating cluster labels
Development
See development.md
Data
The dataset for this project is created using the PyPI dataset on Google BigQuery. The SQL query used can be found in pypi_bigquery.sql.
Contributors

72 commits
Similar repos




Languages
TypeScript
57.1%
Python
36.6%
GLSL
4.0%
Browse the top 10,000 packages on PyPI with the help of vector embeddings
See the codeREADME
PyAtlas
What does this do?
PyAtlas is an interactive map of the top 10,000 Python packages on PyPI. Packages with similar functionality are positioned close together, making it easy to discover alternatives or related tools. It’s mainly just a fun tech demo and hobby project, but it can also be a handy way to discover useful packages. For example, if you want to find packages similar to matplotlib, you can locate it on the map and explore the packages clustered around it.
How does this work?
The project collects descriptions for the most popular packages on PyPI. These descriptions are converted into vector embeddings using Sentence Transformers. The high-dimensional embeddings are then reduced to 10 dimensions using UMAP, and packages are grouped into clusters using HDBSCAN. A second UMAP reduction creates the final 2D coordinates for visualization, using the cluster labels to keep similar packages together. Finally, cluster labels are generated using OpenAI's gpt-5-mini to describe each group.
Stack
The project uses the following technologies:
- React with Three.js for the interactive visualization
- Sentence Transformers for vector embeddings
- UMAP for dimensionality reduction
- HDBSCAN for clustering
- OpenAI for generating cluster labels
Development
See development.md
Data
The dataset for this project is created using the PyPI dataset on Google BigQuery. The SQL query used can be found in pypi_bigquery.sql.
Similar repos
Contributors
72 commits
Languages
TypeScript
57.1%
Python
36.6%
GLSL
4.0%