Modular React charts made with d3.js
See the codeImportant update:
The actively maintained fork of this project is now at the Github of react-d3 co-creator yang-wei, who has recently taken the lead in maintaining the project and moving toward 1.0.
Yang Wei's fork is located here.
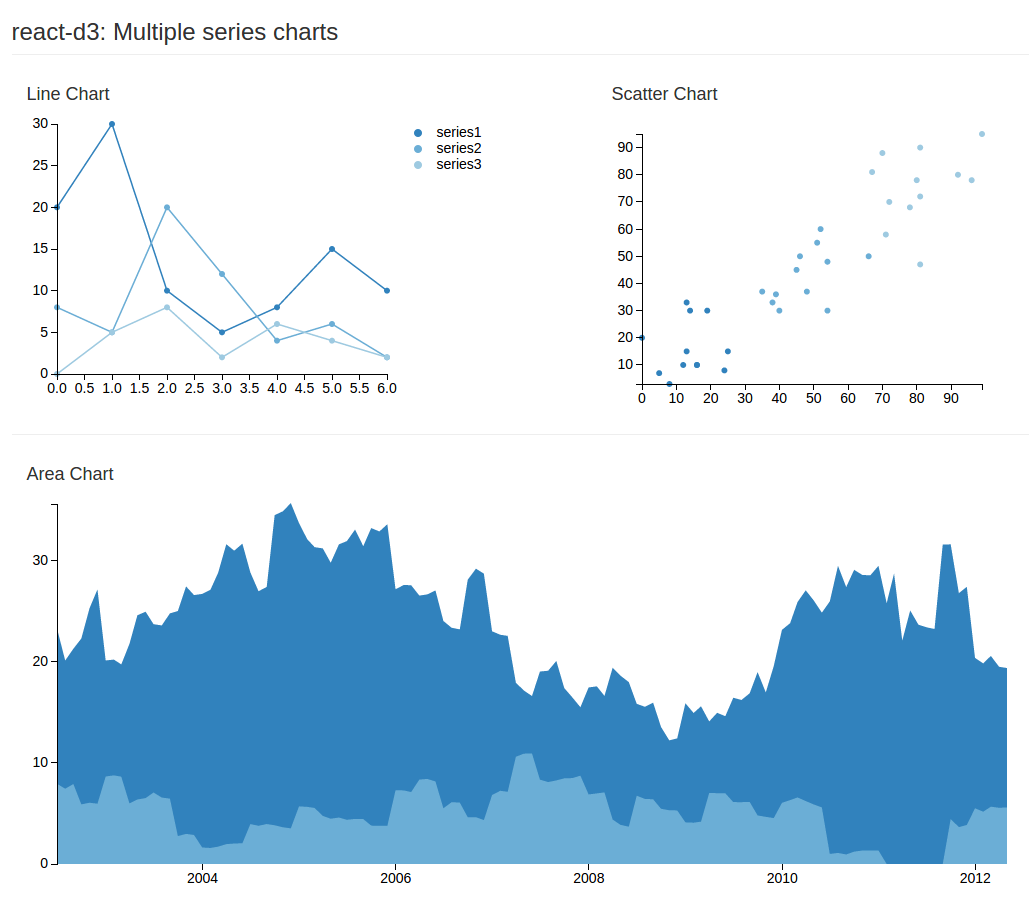
Modular ReactJS charts made using d3 chart utilities. Work on project documentation has started here. A few examples of the available charts can be seen below, the others can be viewed here, side-by-side with the React code that generates the charts.


First, install via npm:
npm install react-d3
Then, import into your ReactJS project:
var rd3 = require('react-d3');
// es6
import rd3 from 'react-d3';
The charts are then available under the rd3 namespace, which you can then use as shown on the demonstration page:
If you don't wish to pull in all the charts, you can also require single chart:
var BarChart = require('react-d3/barchart').BarChart;
// es6
import { BarChart } from 'react-d3';
var BarChart = rd3.BarChart;
var LineChart = rd3.LineChart;
var PieChart = rd3.PieChart;
var AreaChart = rd3.AreaChart;
var Treemap = rd3.Treemap;
var ScatterChart = rd3.ScatterChart;
var CandleStickChart = rd3.CandleStickChart;
For usage, please see here. API documentation is also coming online over the coming days.
There's a development build available for experimentation on JSFiddle: http://jsfiddle.net/esbullington/jp9dkh1g/.
Please note that this build should probably not be used in production, since it bundles all of react-d3's dependencies in a single bundle (this is also the cause of the "Cannot read property 'firstChild' of undefined" error message on the JS console, which occurs when there are two React libraries in the same namespace).
All the react-d3 charts are available in this JSFiddle fork under the global rd3 namespace.
Although there have been several different approaches proposed for combining the power of d3 with the flexibility and modularity of ReactJS, the approach I'm using here was inspired by this blog post by Ben Smith of Binary Consulting.
With this approach, React itself is responsible for generating the SVG markup. d3.js is used for its tremendous collection of utility functions, such as those that calculate the path value for various chart types.
For current roadmap, please see Yang Wei's fork at: https://github.com/yang-wei/rd3
MIT
Copyright (c) 2014-2015 Eric. S Bullington, Lim Yang Wei, and project contributors
Overall
Maintained
Code review
npm
Latest release
Releases this year
4,544 followers · starred Jul 2015
1,014 followers · starred Apr 2015
1,230 followers · starred May 2015
4,048 followers · starred Apr 2015
Modular React charts made with d3.js
See the codeImportant update:
The actively maintained fork of this project is now at the Github of react-d3 co-creator yang-wei, who has recently taken the lead in maintaining the project and moving toward 1.0.
Yang Wei's fork is located here.
Modular ReactJS charts made using d3 chart utilities. Work on project documentation has started here. A few examples of the available charts can be seen below, the others can be viewed here, side-by-side with the React code that generates the charts.
First, install via npm:
npm install react-d3
Then, import into your ReactJS project:
var rd3 = require('react-d3');
// es6
import rd3 from 'react-d3';
The charts are then available under the rd3 namespace, which you can then use as shown on the demonstration page:
If you don't wish to pull in all the charts, you can also require single chart:
var BarChart = require('react-d3/barchart').BarChart;
// es6
import { BarChart } from 'react-d3';
var BarChart = rd3.BarChart;
var LineChart = rd3.LineChart;
var PieChart = rd3.PieChart;
var AreaChart = rd3.AreaChart;
var Treemap = rd3.Treemap;
var ScatterChart = rd3.ScatterChart;
var CandleStickChart = rd3.CandleStickChart;
For usage, please see here. API documentation is also coming online over the coming days.
There's a development build available for experimentation on JSFiddle: http://jsfiddle.net/esbullington/jp9dkh1g/.
Please note that this build should probably not be used in production, since it bundles all of react-d3's dependencies in a single bundle (this is also the cause of the "Cannot read property 'firstChild' of undefined" error message on the JS console, which occurs when there are two React libraries in the same namespace).
All the react-d3 charts are available in this JSFiddle fork under the global rd3 namespace.
Although there have been several different approaches proposed for combining the power of d3 with the flexibility and modularity of ReactJS, the approach I'm using here was inspired by this blog post by Ben Smith of Binary Consulting.
With this approach, React itself is responsible for generating the SVG markup. d3.js is used for its tremendous collection of utility functions, such as those that calculate the path value for various chart types.
For current roadmap, please see Yang Wei's fork at: https://github.com/yang-wei/rd3
MIT
Copyright (c) 2014-2015 Eric. S Bullington, Lim Yang Wei, and project contributors
Overall
Maintained
Code review
npm
Latest release
Releases this year
4,544 followers · starred Jul 2015
1,014 followers · starred Apr 2015
1,230 followers · starred May 2015
4,048 followers · starred Apr 2015