
Lichtgewicht CPU/GPU/geheugen/netwerk/schijf/batterij-monitor voor de Windows-taakbalk (Task Manager-waarden)
C#
0
99 commits
updated Sep 26, 2026
See what people are saying
README
TaskbarStats
Languages: English · Nederlands · Deutsch
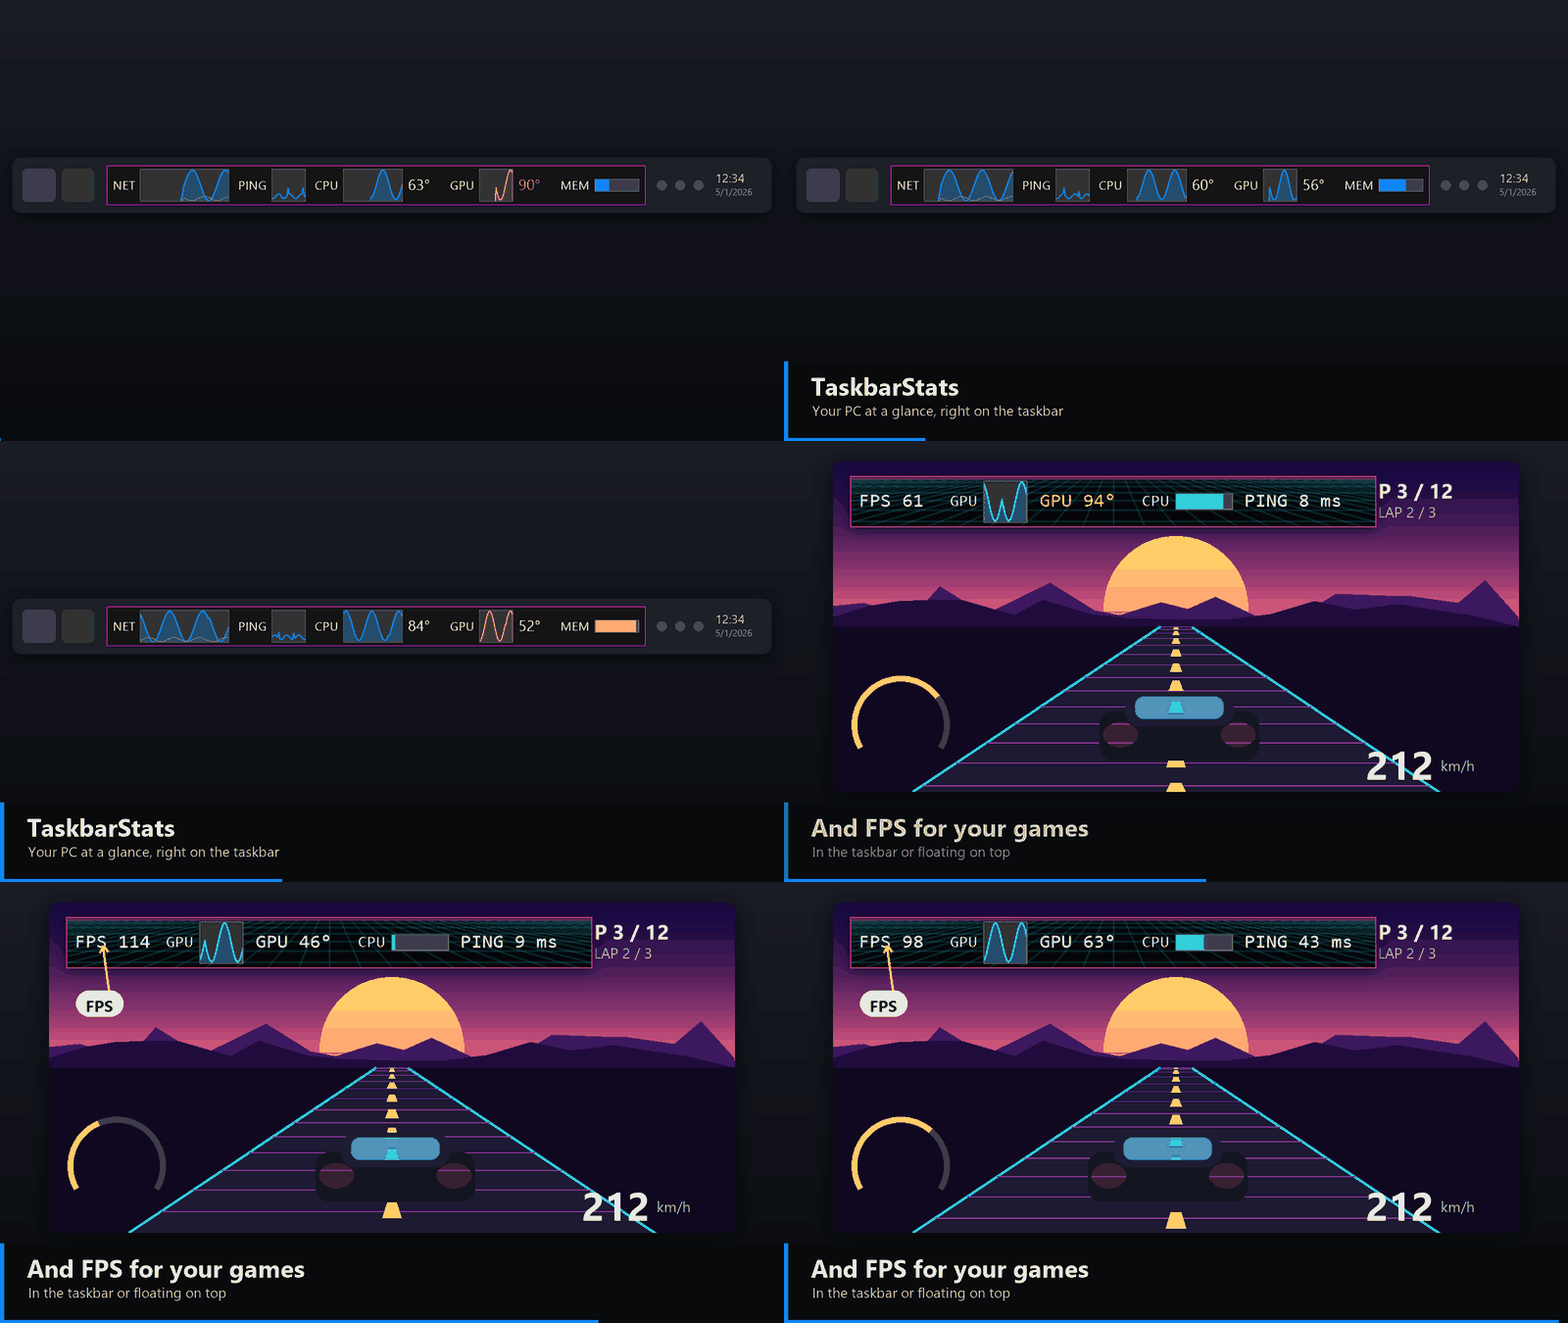
A lightweight CPU / GPU / memory / network / disk / battery / temperature monitor that floats next to the notification area of the Windows taskbar — like TrafficMonitor, but with values that match Task Manager. It also comes with a large desktop dashboard and a fullscreen "cockpit".
Demo videos
Four English demos of 45 to 60 seconds each. Download, install and run takes a few seconds in every one of them, so most of the time goes to the program itself:
| Video | For | What it shows |
|---|---|---|
| Quick start (47 s) | Everyone | Download, install, run, right-click menu, themes with backgrounds, JSON editor with preview, processes and FPS, dashboard and fullscreen |
| For number lovers (57 s) | Statistics nerds | Every graph with its own length, four display styles, processes (all, apps, background), tooltip details, dashboard, fullscreen cockpit, specifications, JSON everything |
| For gamers (51 s) | Gamers | FPS in the taskbar or floating on top of your game, 1% low, tiny overlay mode, click-through (Ctrl+Alt+W), GPU and CPU temperatures, ping, themes |
| The complete tour (59 s) | Everyone | The whole program, feature by feature |
More documentation is listed in the docs index.
For gamers 🎮
Turn your taskbar into a free FPS counter, or drag the widget over your game and let it float on top.
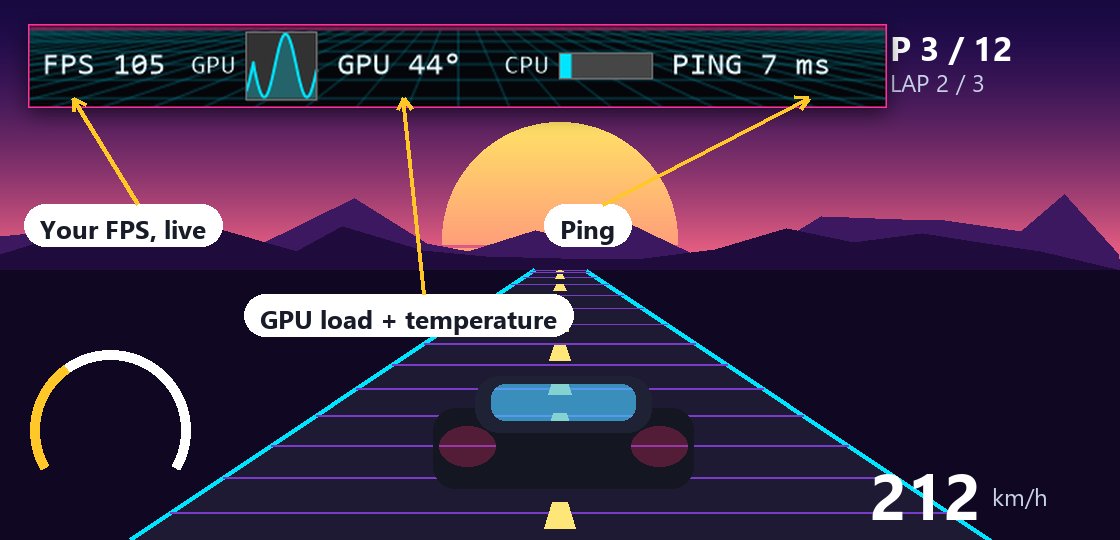
- FPS of the game you are playing — measured the same way PresentMon does (Windows event tracing), for the program in the foreground. Works with DirectX games (DXGI/D3D9) and browsers. Experimental: turn it on in Settings → Widget → Values.
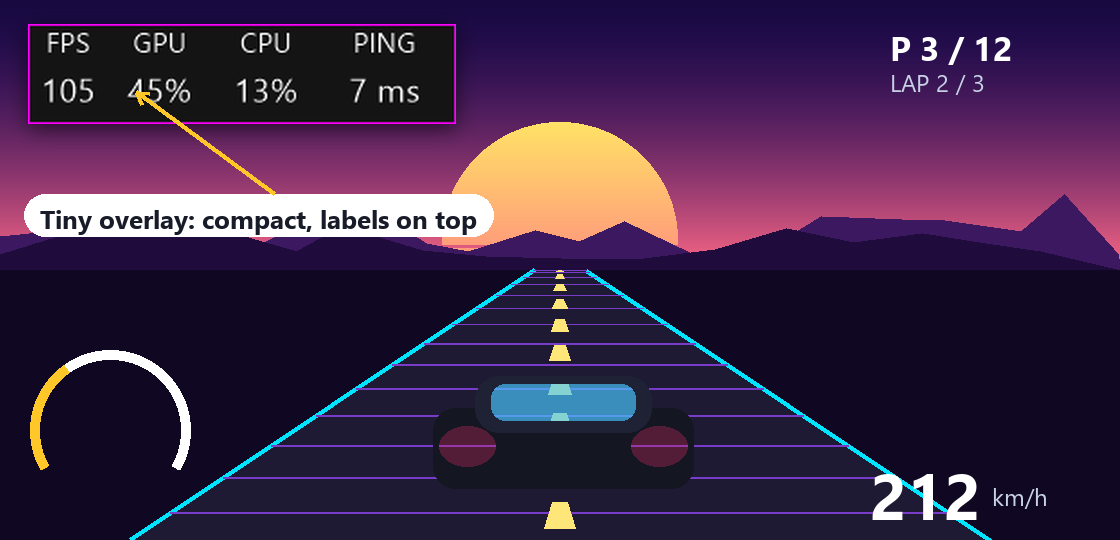
- Tiny overlay mode — compact, labels on top, just FPS, GPU and CPU:
- Click-through (Ctrl+Alt+W): the widget stays visible but your mouse clicks go straight to the game.
- Everything a gamer wants to know: GPU load, GPU and CPU temperature, ping, and a graph for whichever one is misbehaving.
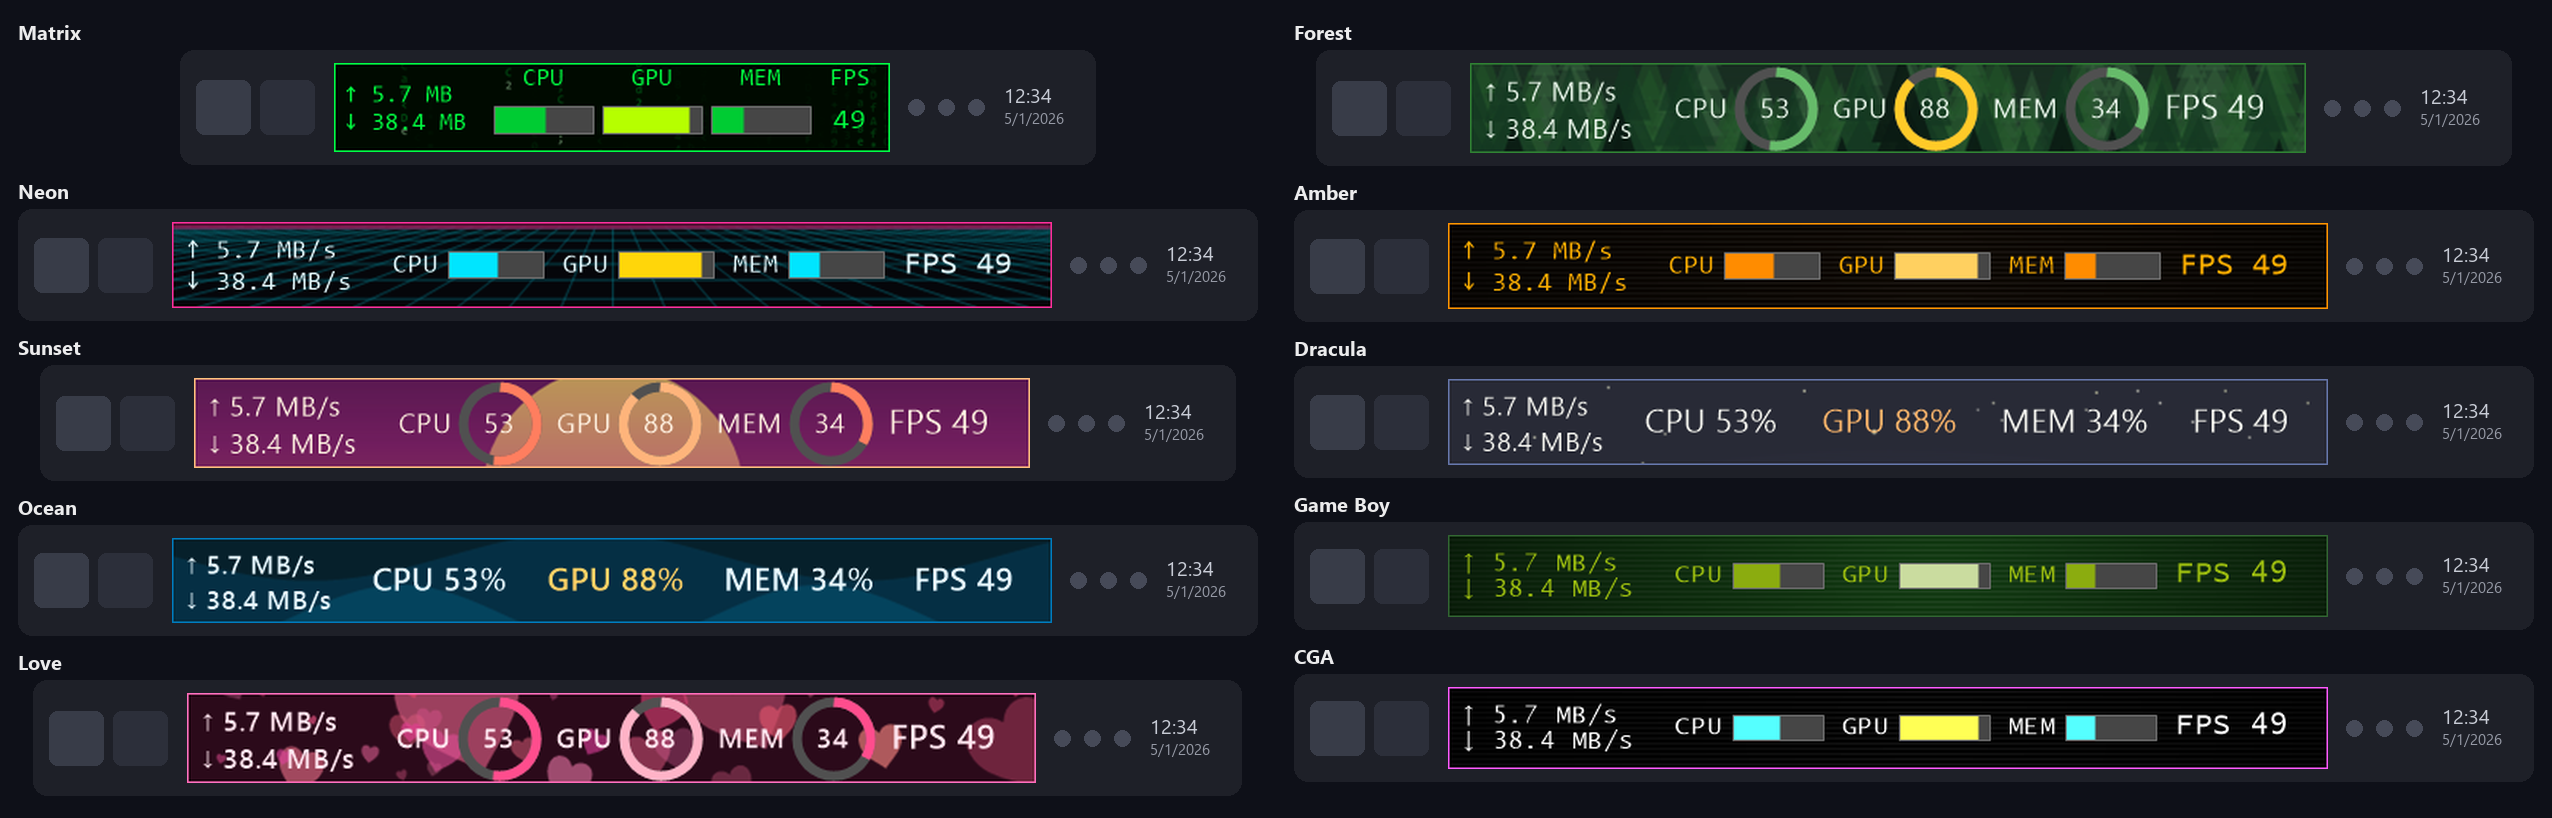
- Pick a look that fits your rig: Neon for the retro racing vibe, Matrix for hackers, Game Boy for nostalgia, Amber and CGA if you miss the 80s.
Watch it in action: For gamers (51 s).
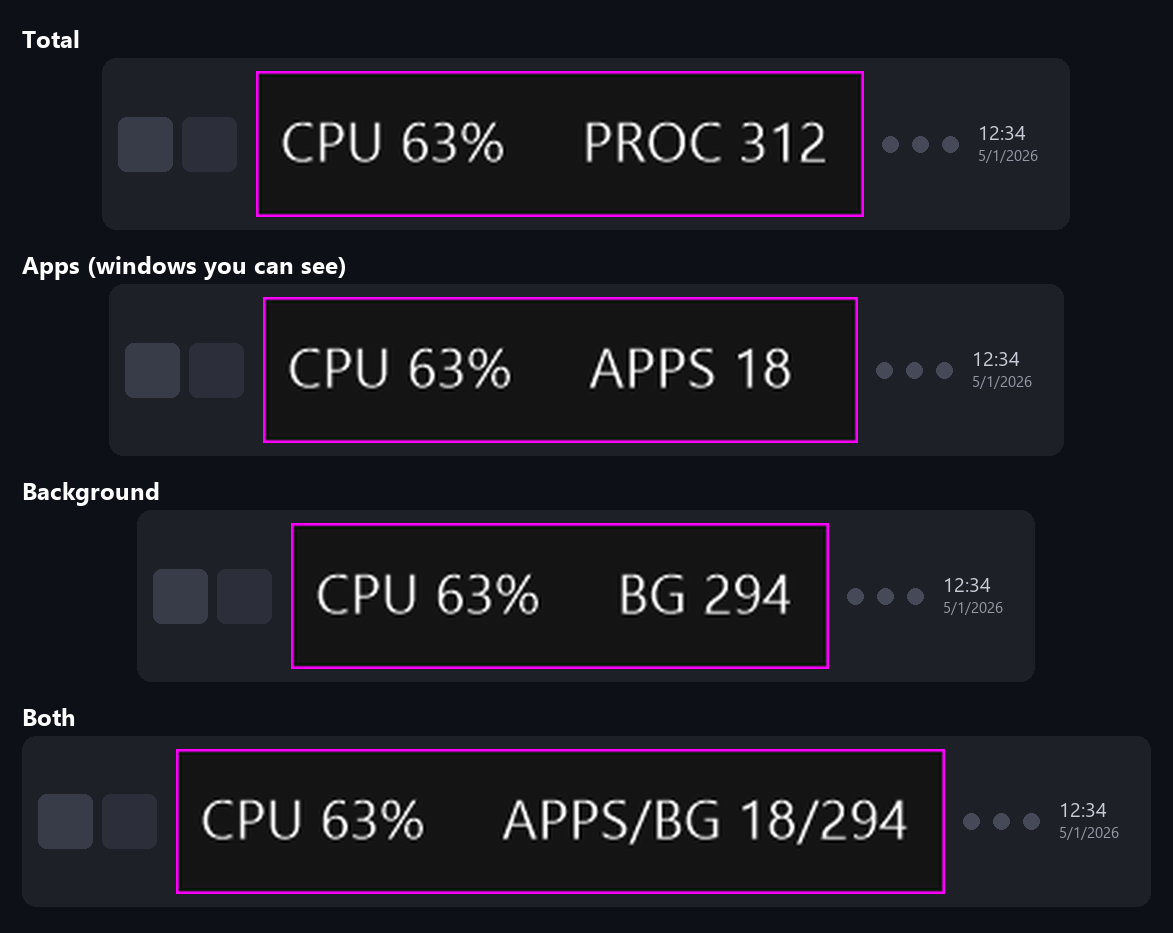
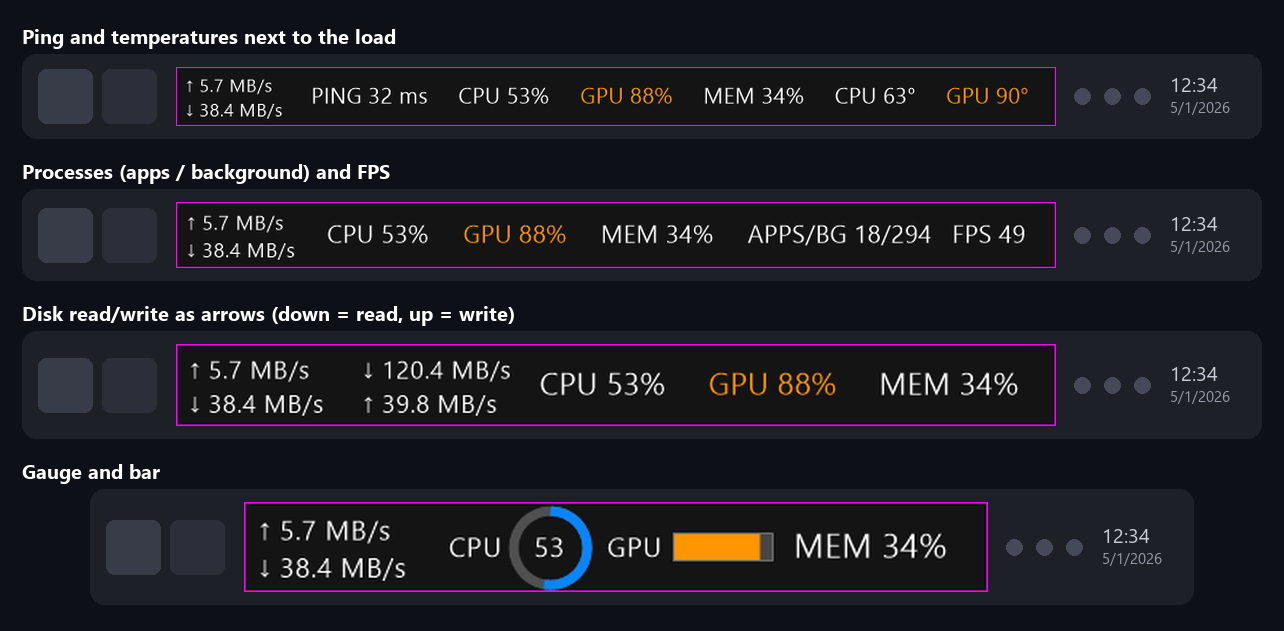
Not a gamer? The same widget also counts your processes (total, apps you can see, background, or both):
Screenshots
Screenshots show the English interface (values are made up); a few older ones still show the Dutch interface. The app also runs in Dutch and German.
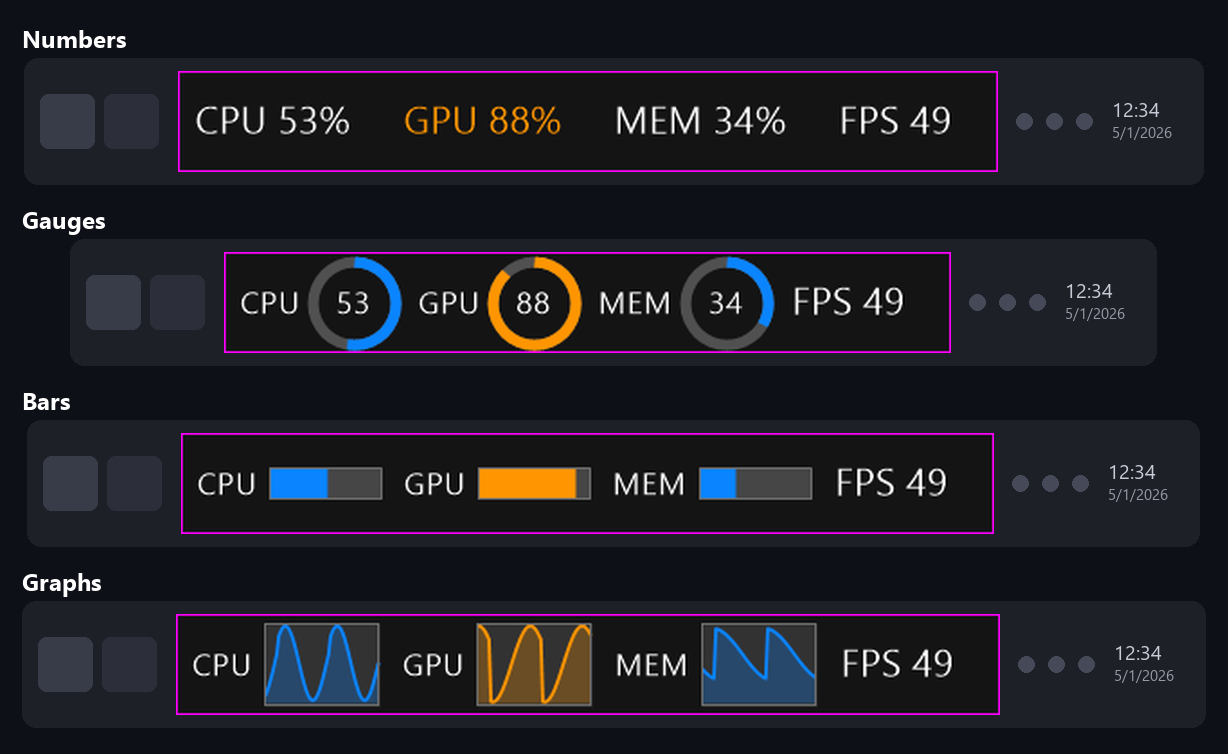
Taskbar widget — numbers, gauges, bars or graphs, with FPS and process count next to CPU, GPU and memory:



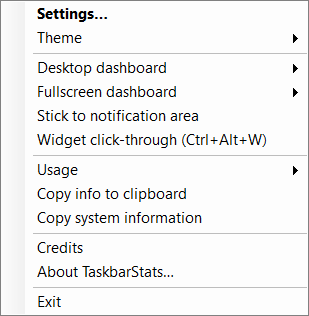
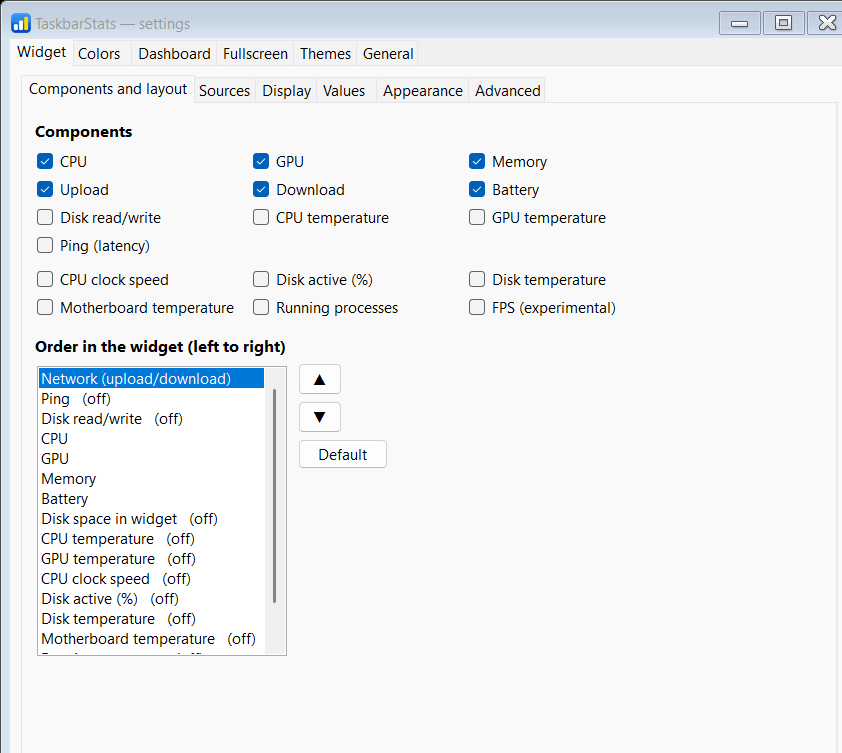
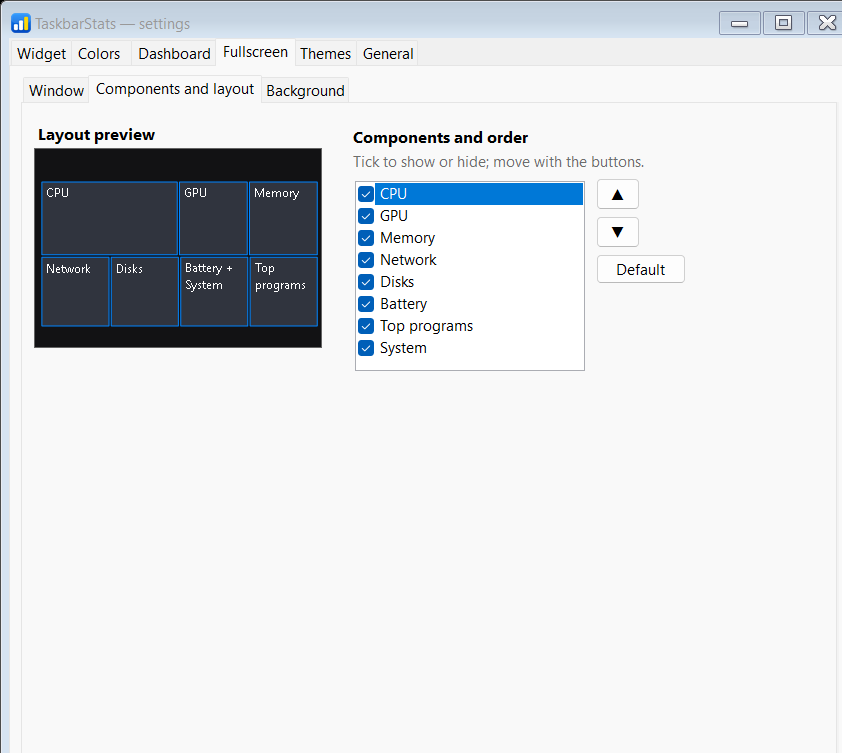
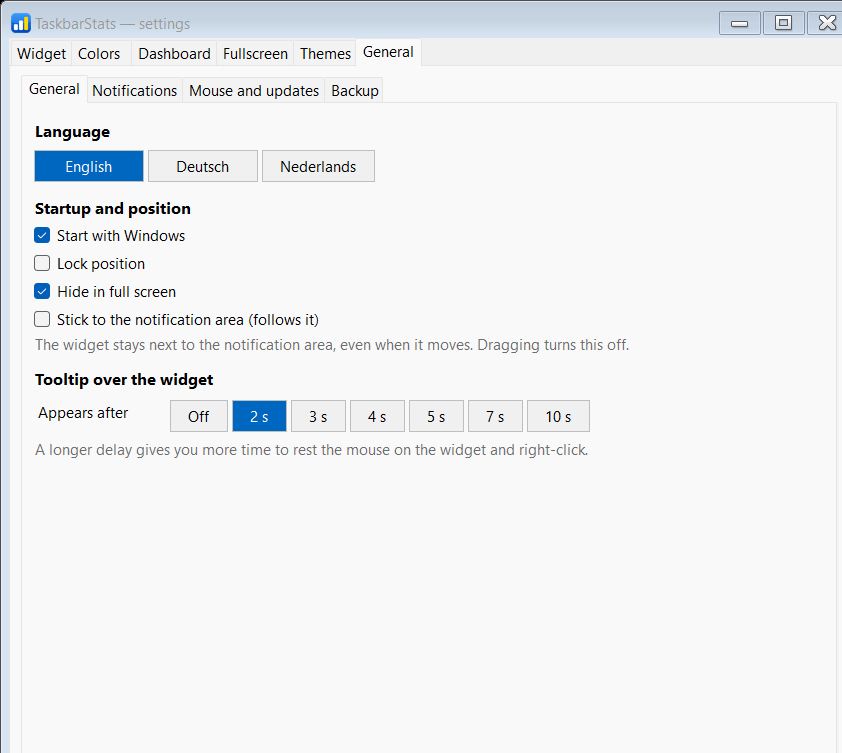
Right-click menu (short, and it stays open while you pick several things) and the settings window with tabs (appearance, colors, dashboard, fullscreen, themes), where every change is visible immediately:
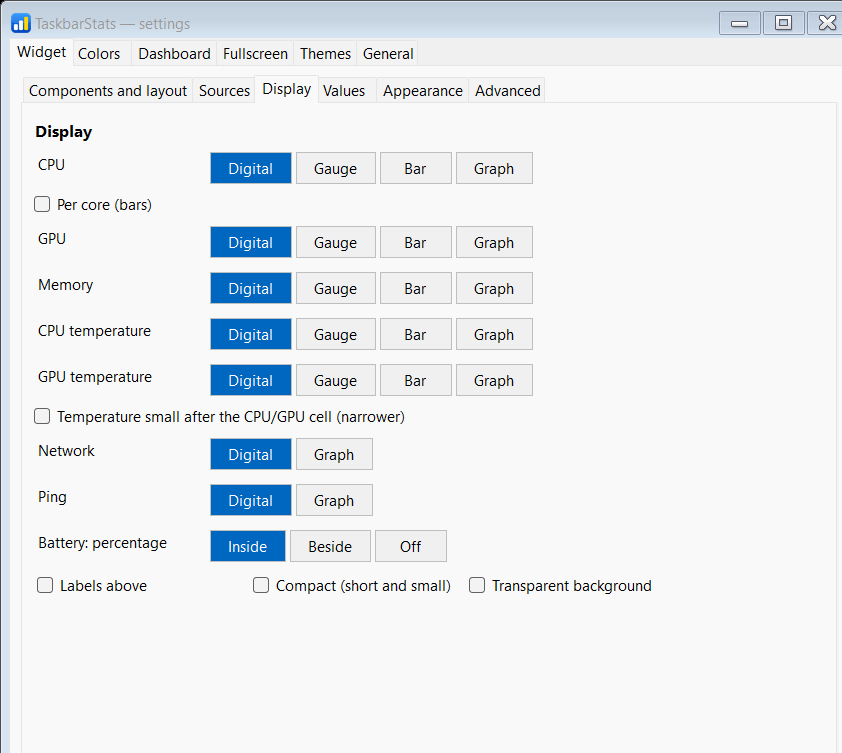
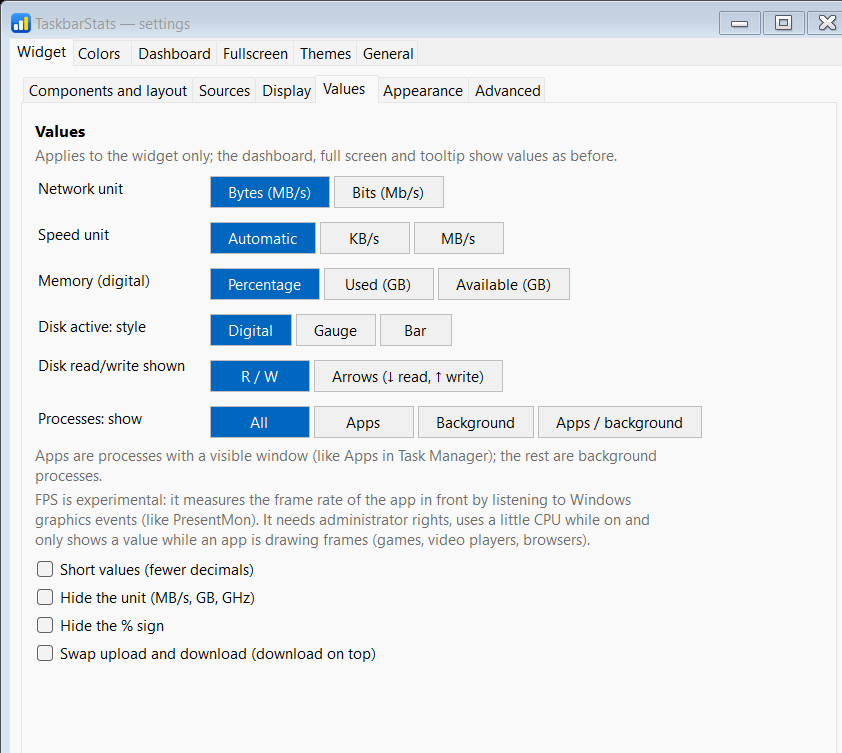
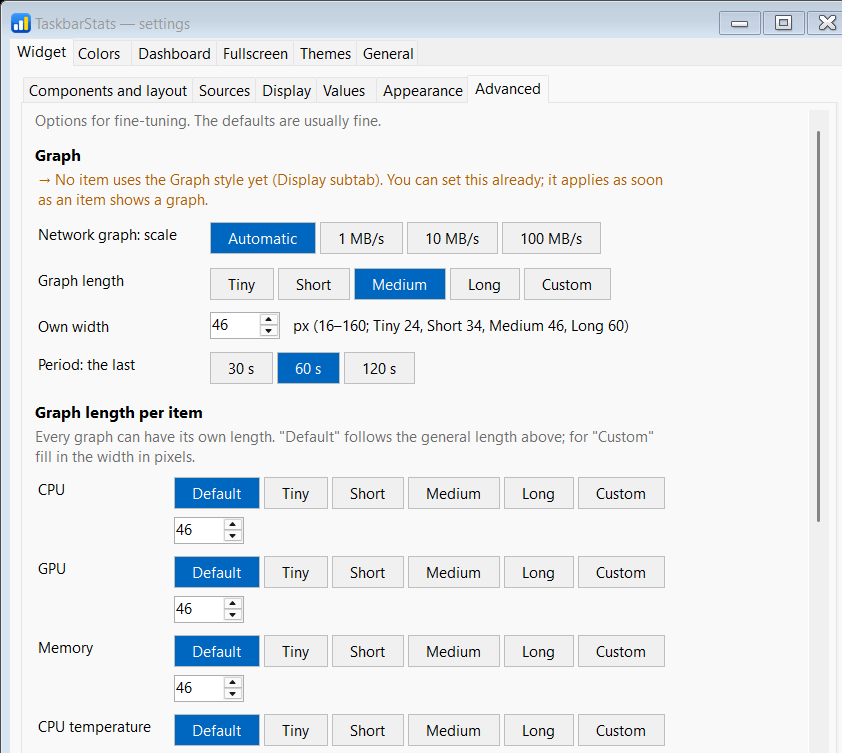
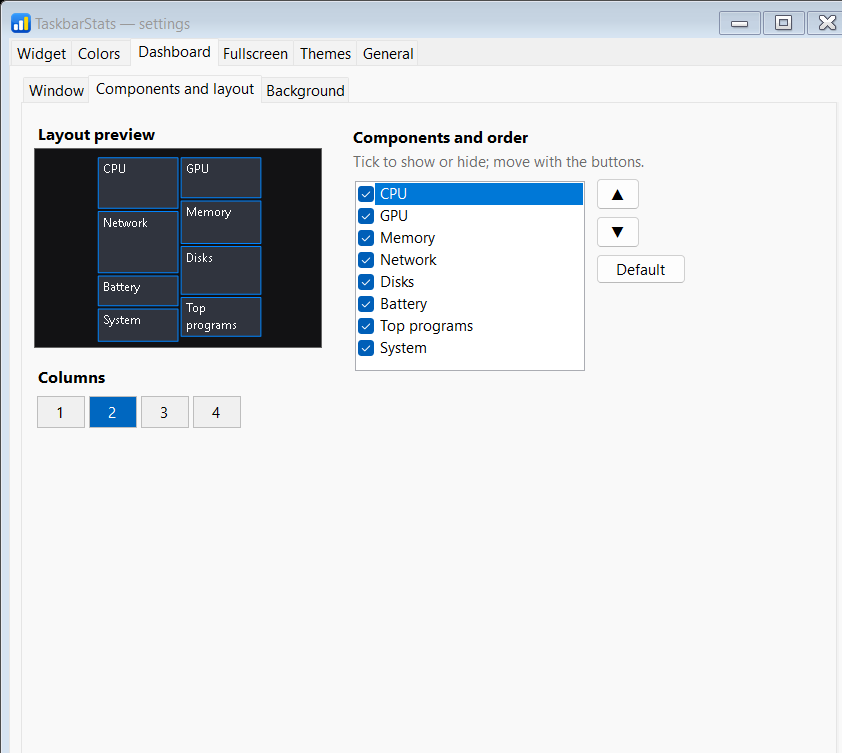
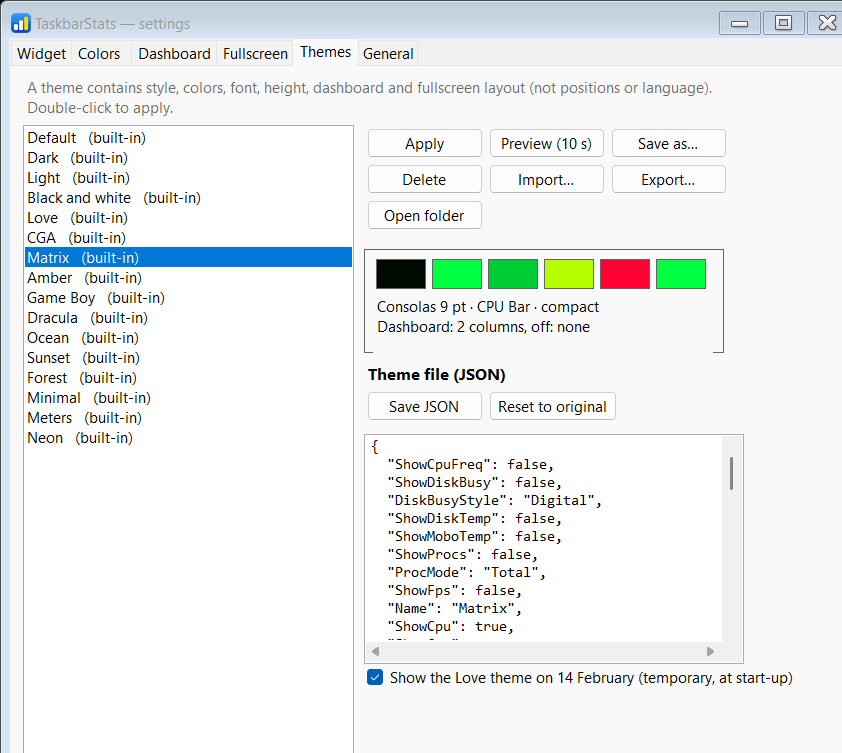
Some themes have their own background, drawn in code (so no files): Matrix (falling characters), Neon (grid), Sunset (sun), Forest (pine forest with fireflies), Ocean (waves), Love (hearts, large and small), Dracula (stars), Amber, CGA and Game Boy (scanlines). The theme applies it to the widget, dashboard and fullscreen at the same time; a theme without a background removes such a pattern again (your own image stays). A theme's JSON contains Background (matrix, grid, stars, sunset, waves, scanlines, hearts or forest) and BackgroundOpacity (5-100).
On 14 February the program temporarily starts with the Love theme (in memory only: settings.json keeps your own look, and as soon as you open Settings or pick a theme yourself, it is yours again). You can turn this off under Settings → Themes (Show the Love theme on 14 February).
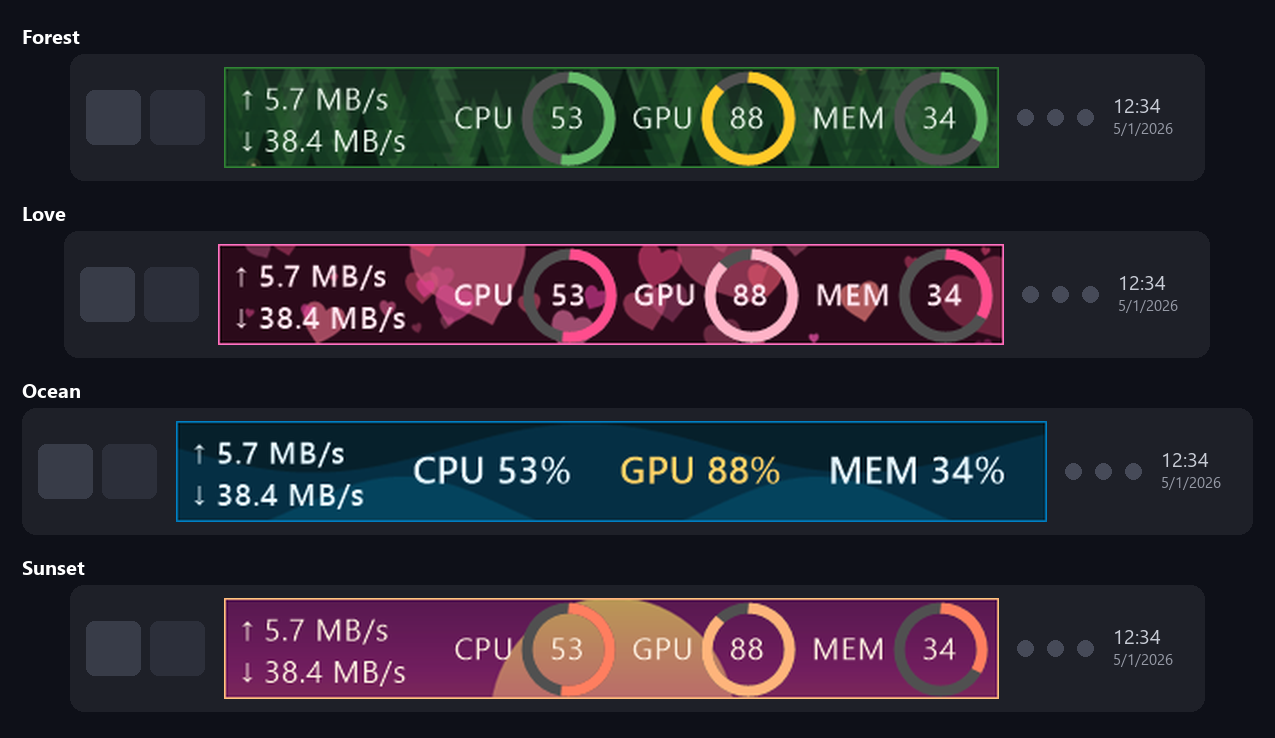
The bundled themes, shown here on the desktop dashboard:
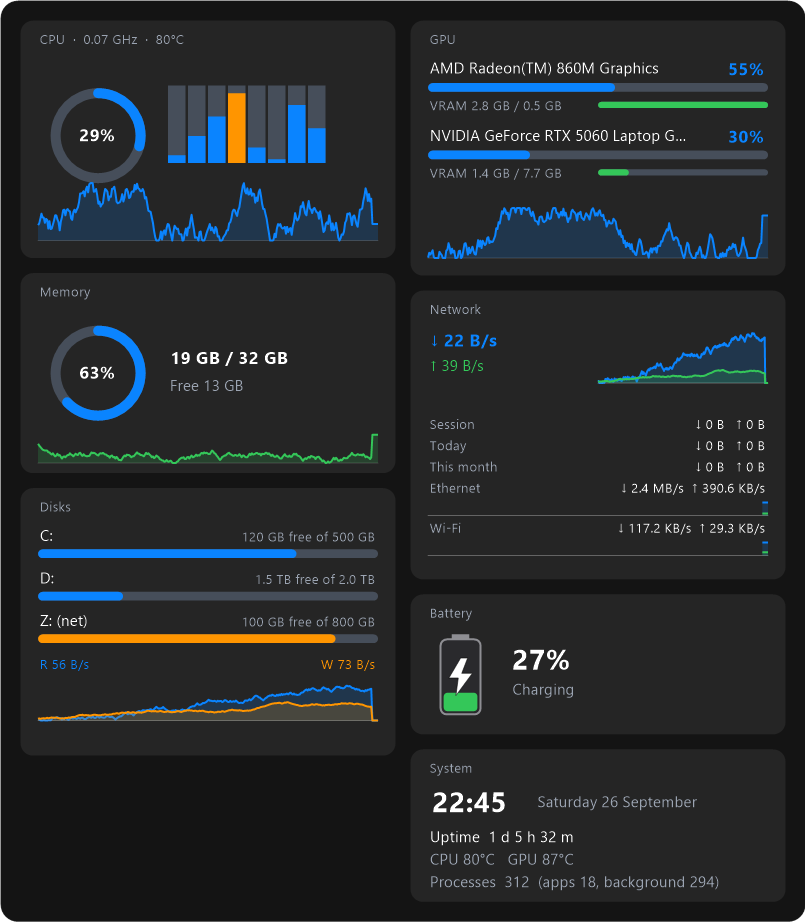
Desktop dashboard (semi-transparent, scalable, foreground or background, click-through):
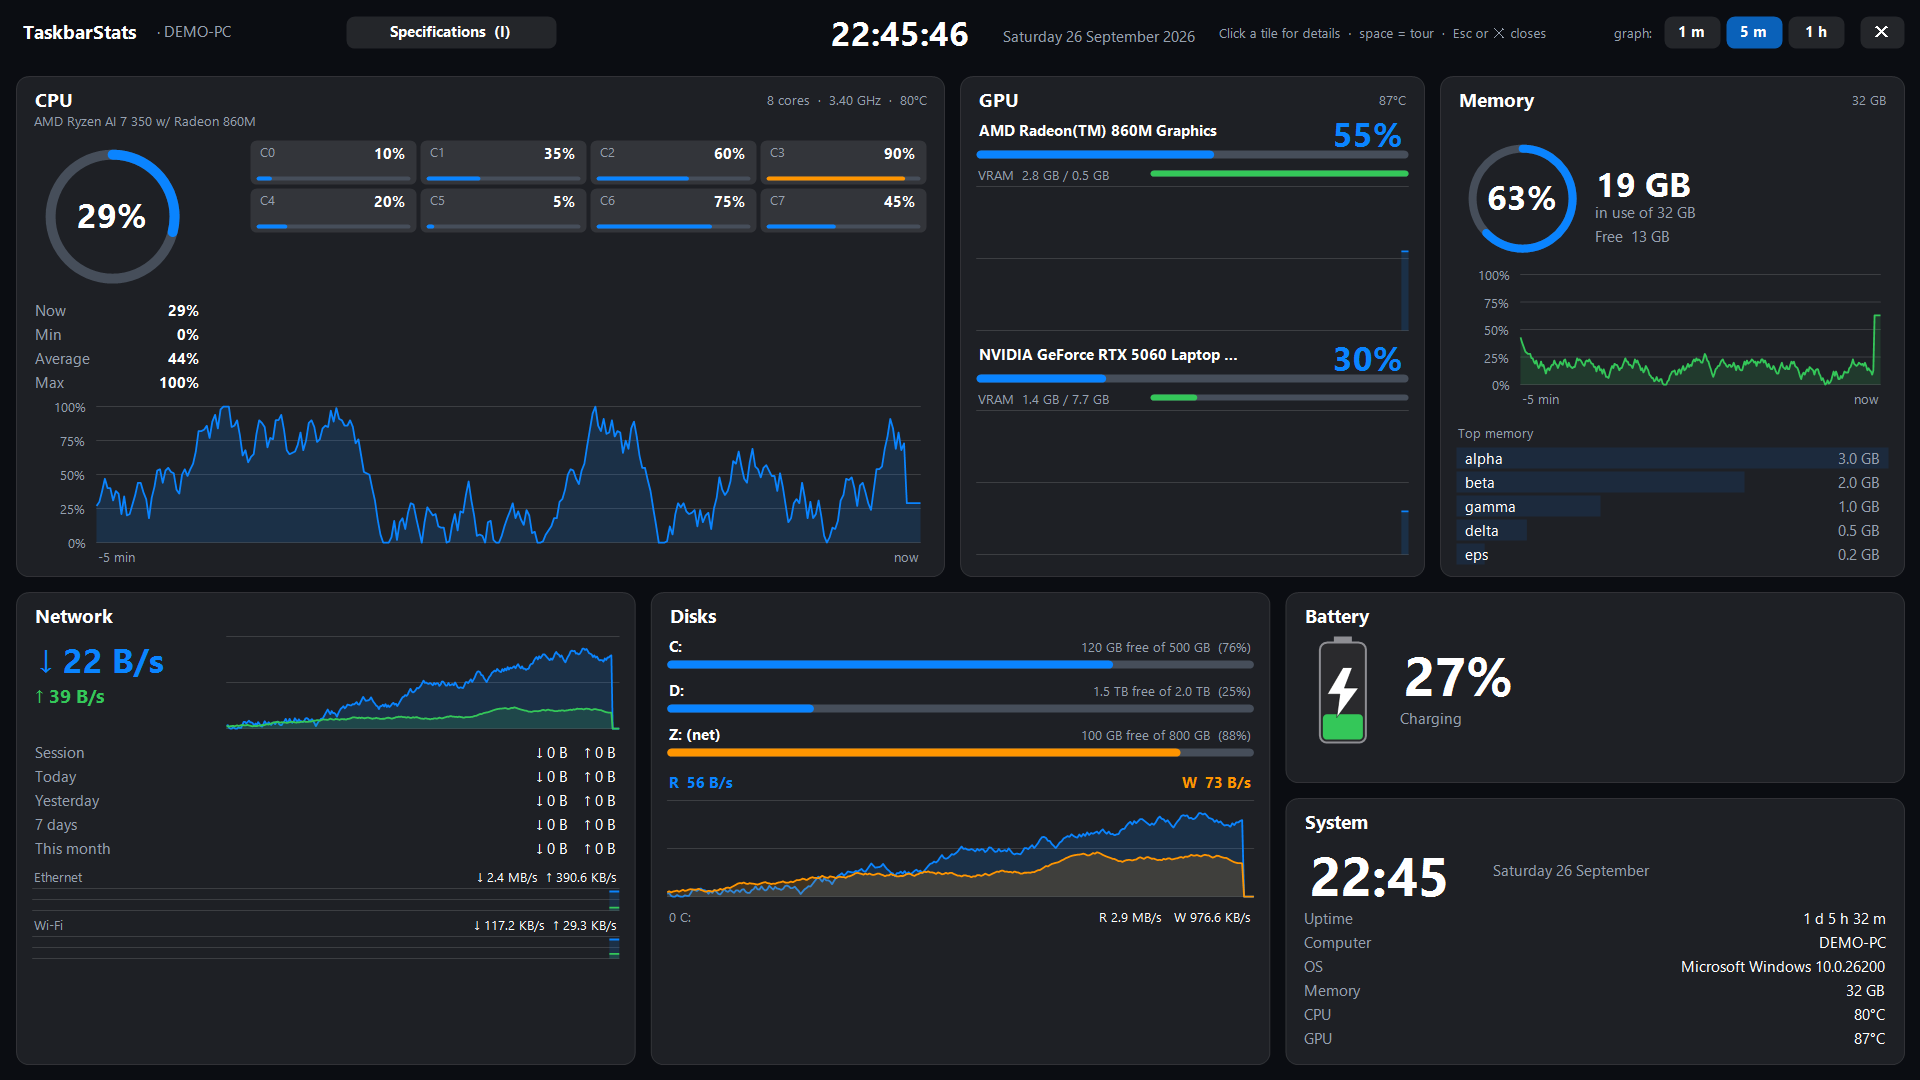
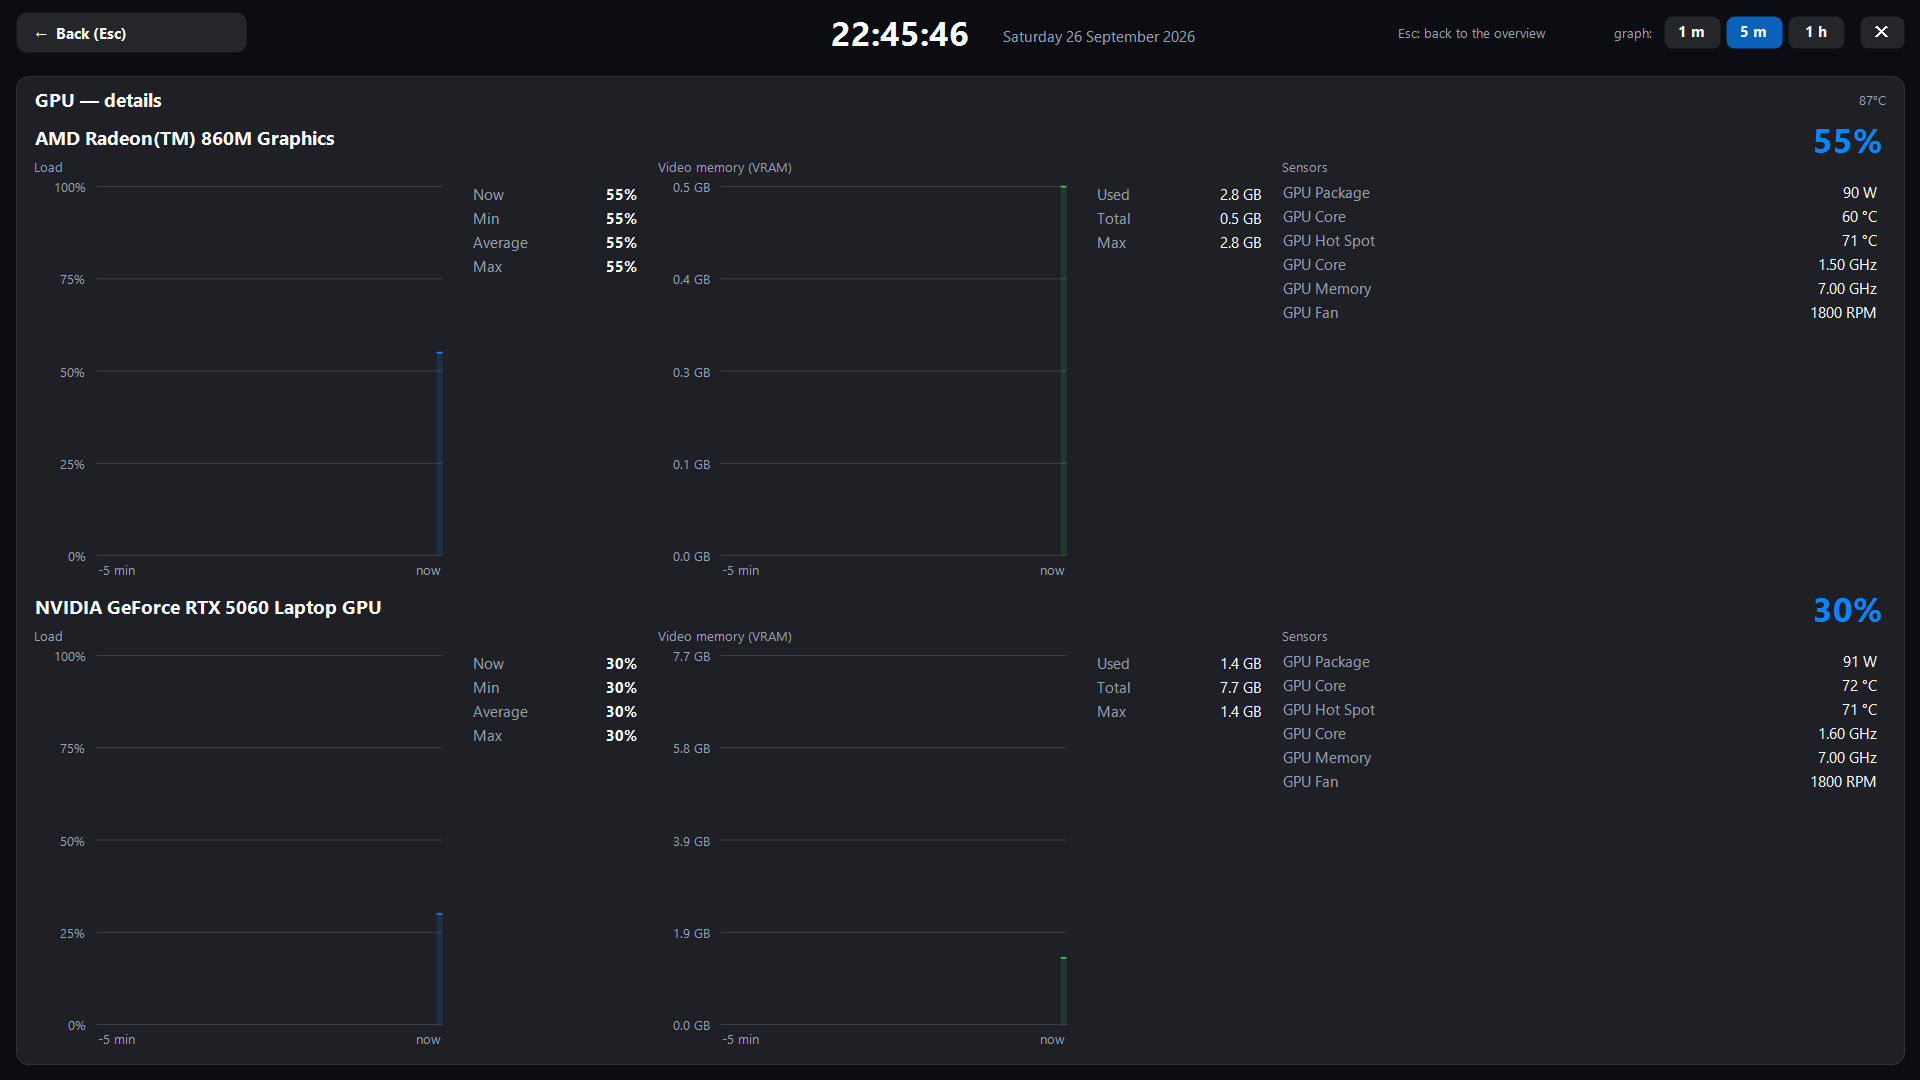
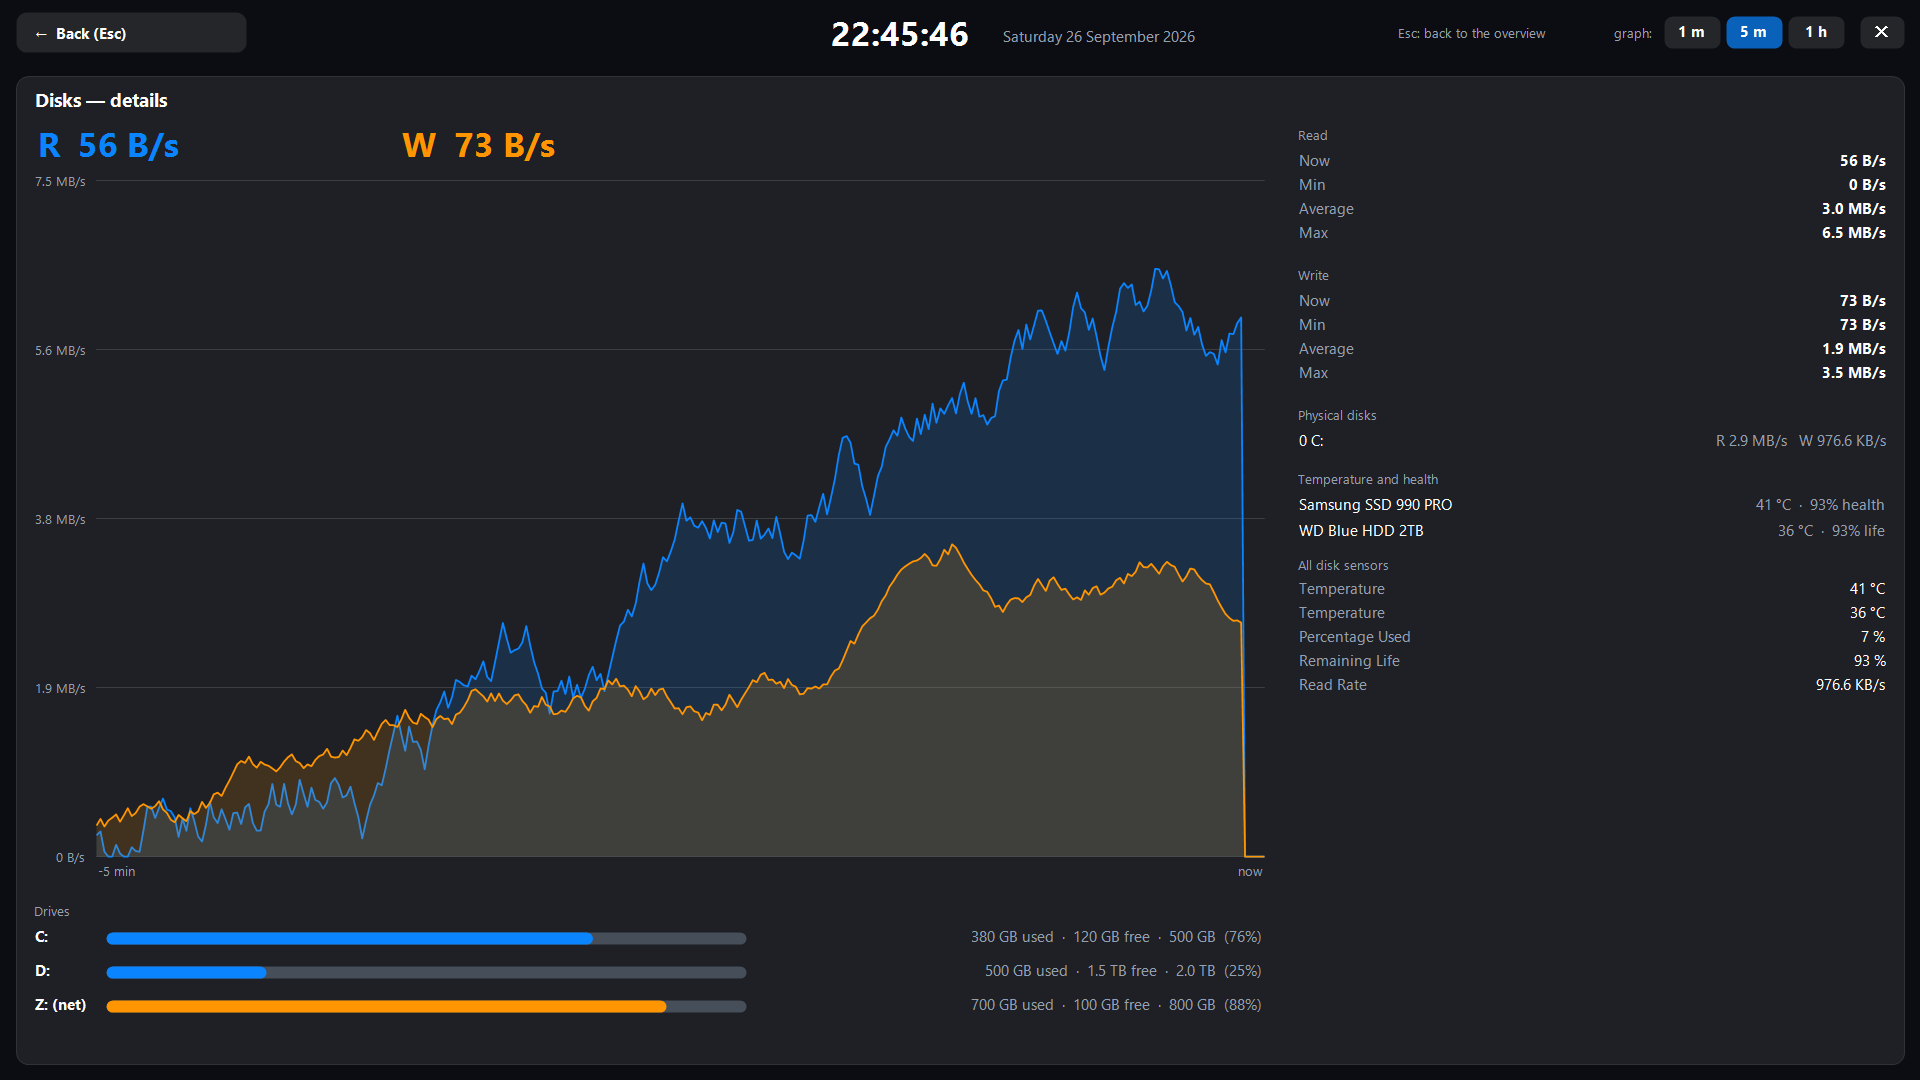
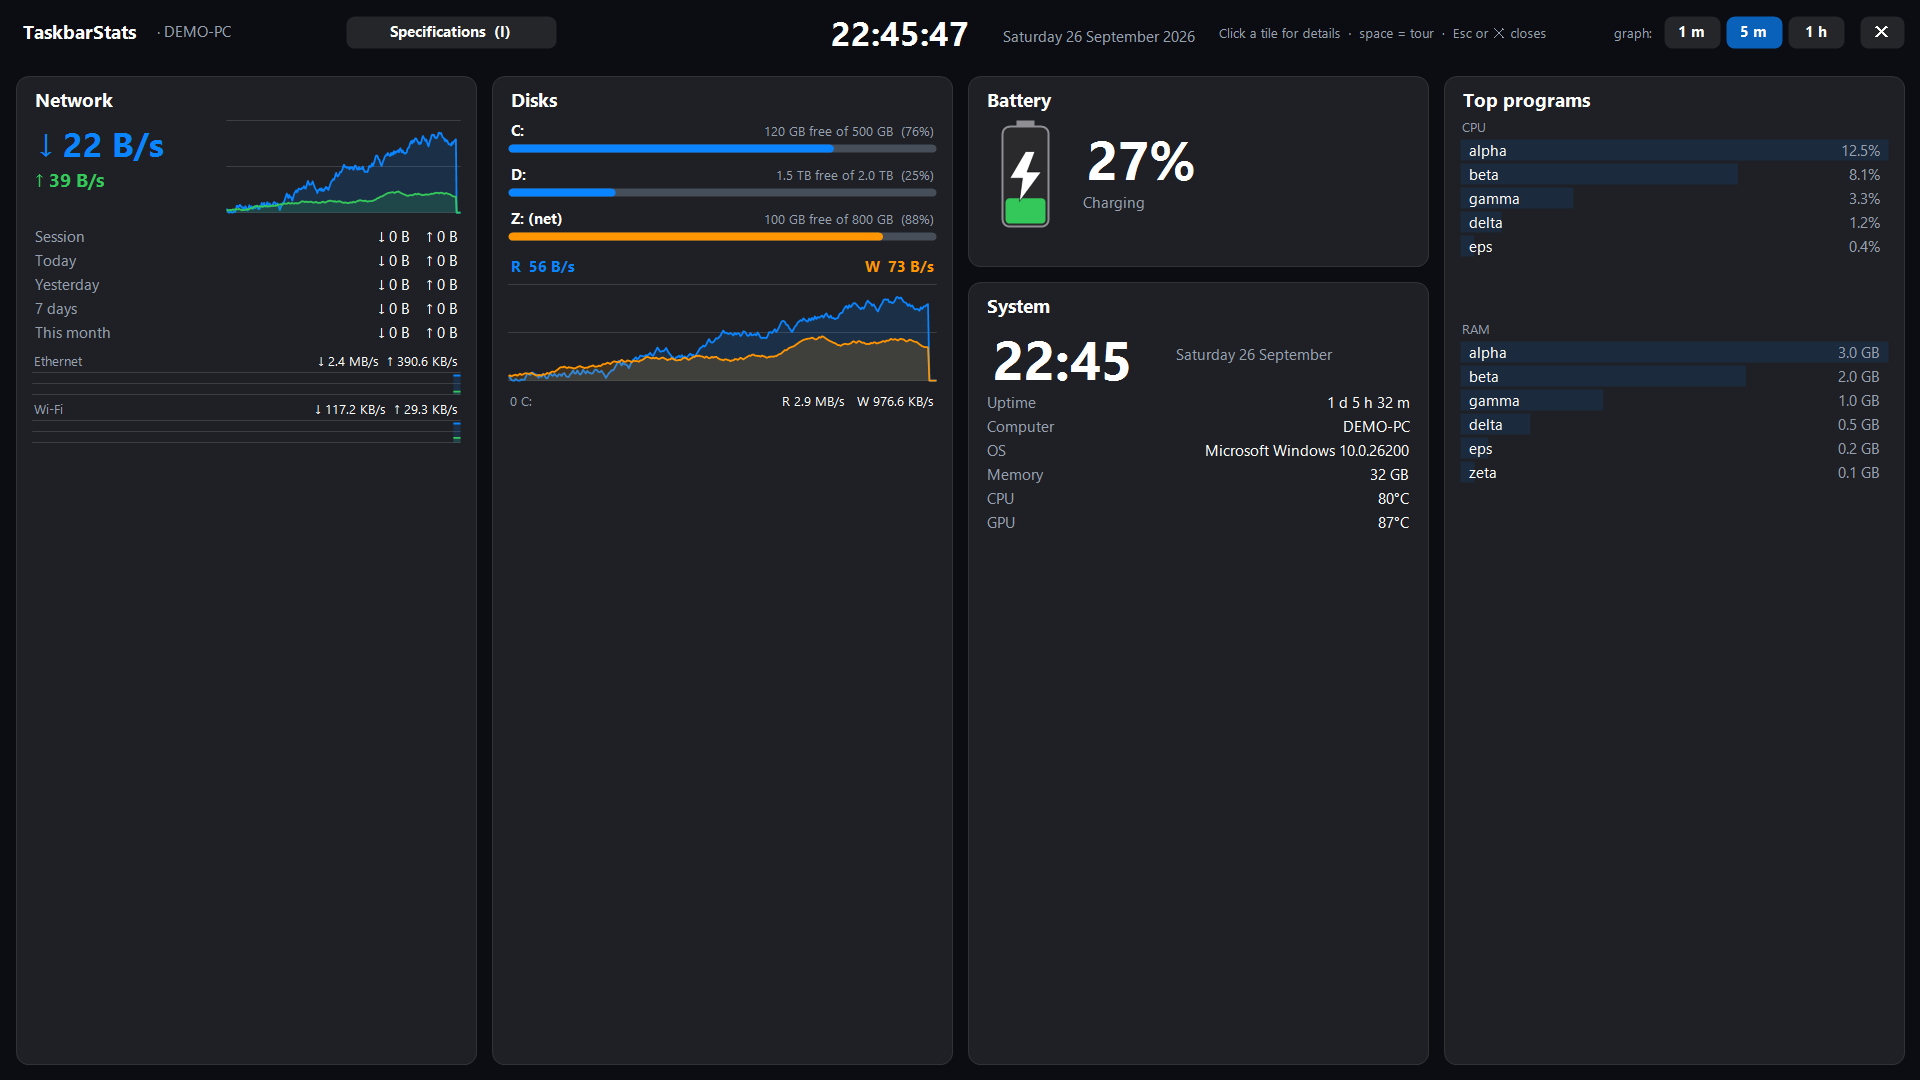
Fullscreen dashboard (Ctrl+Alt+F) — overview, and click a tile for details:
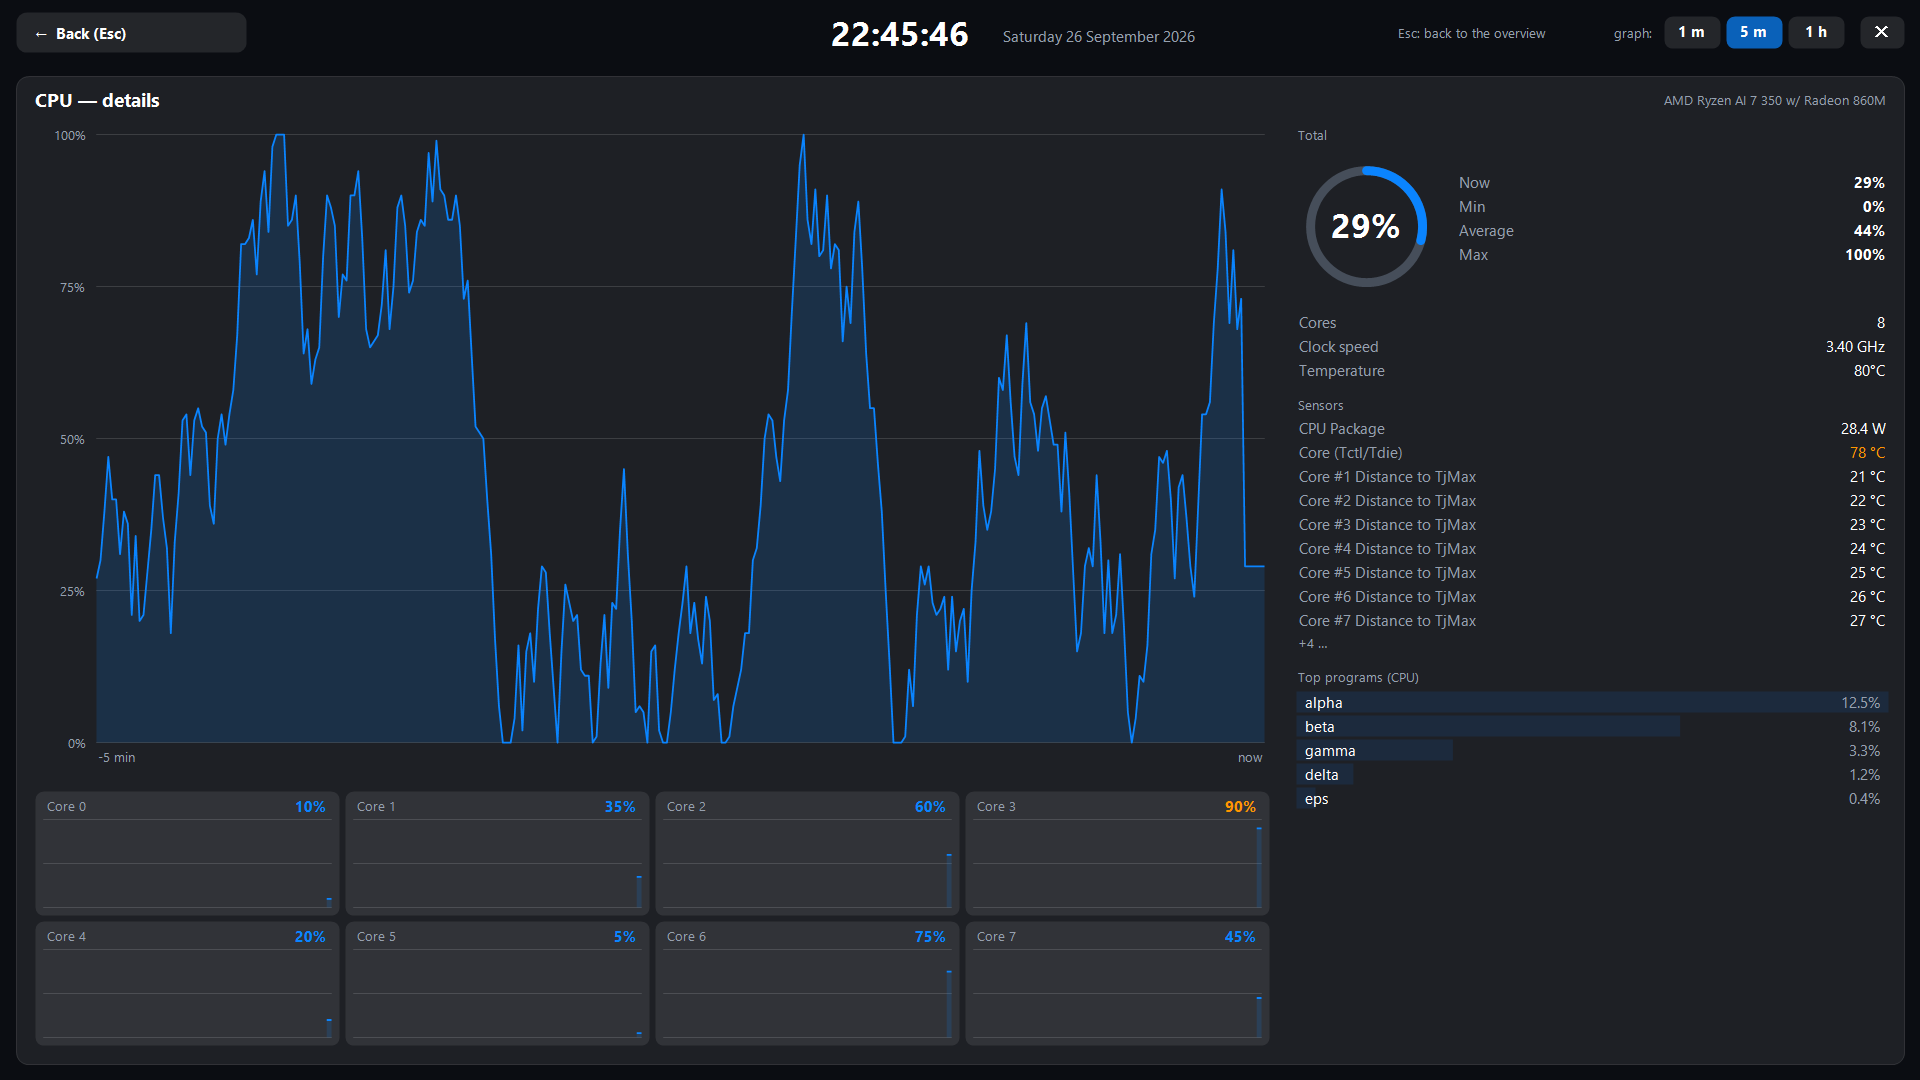
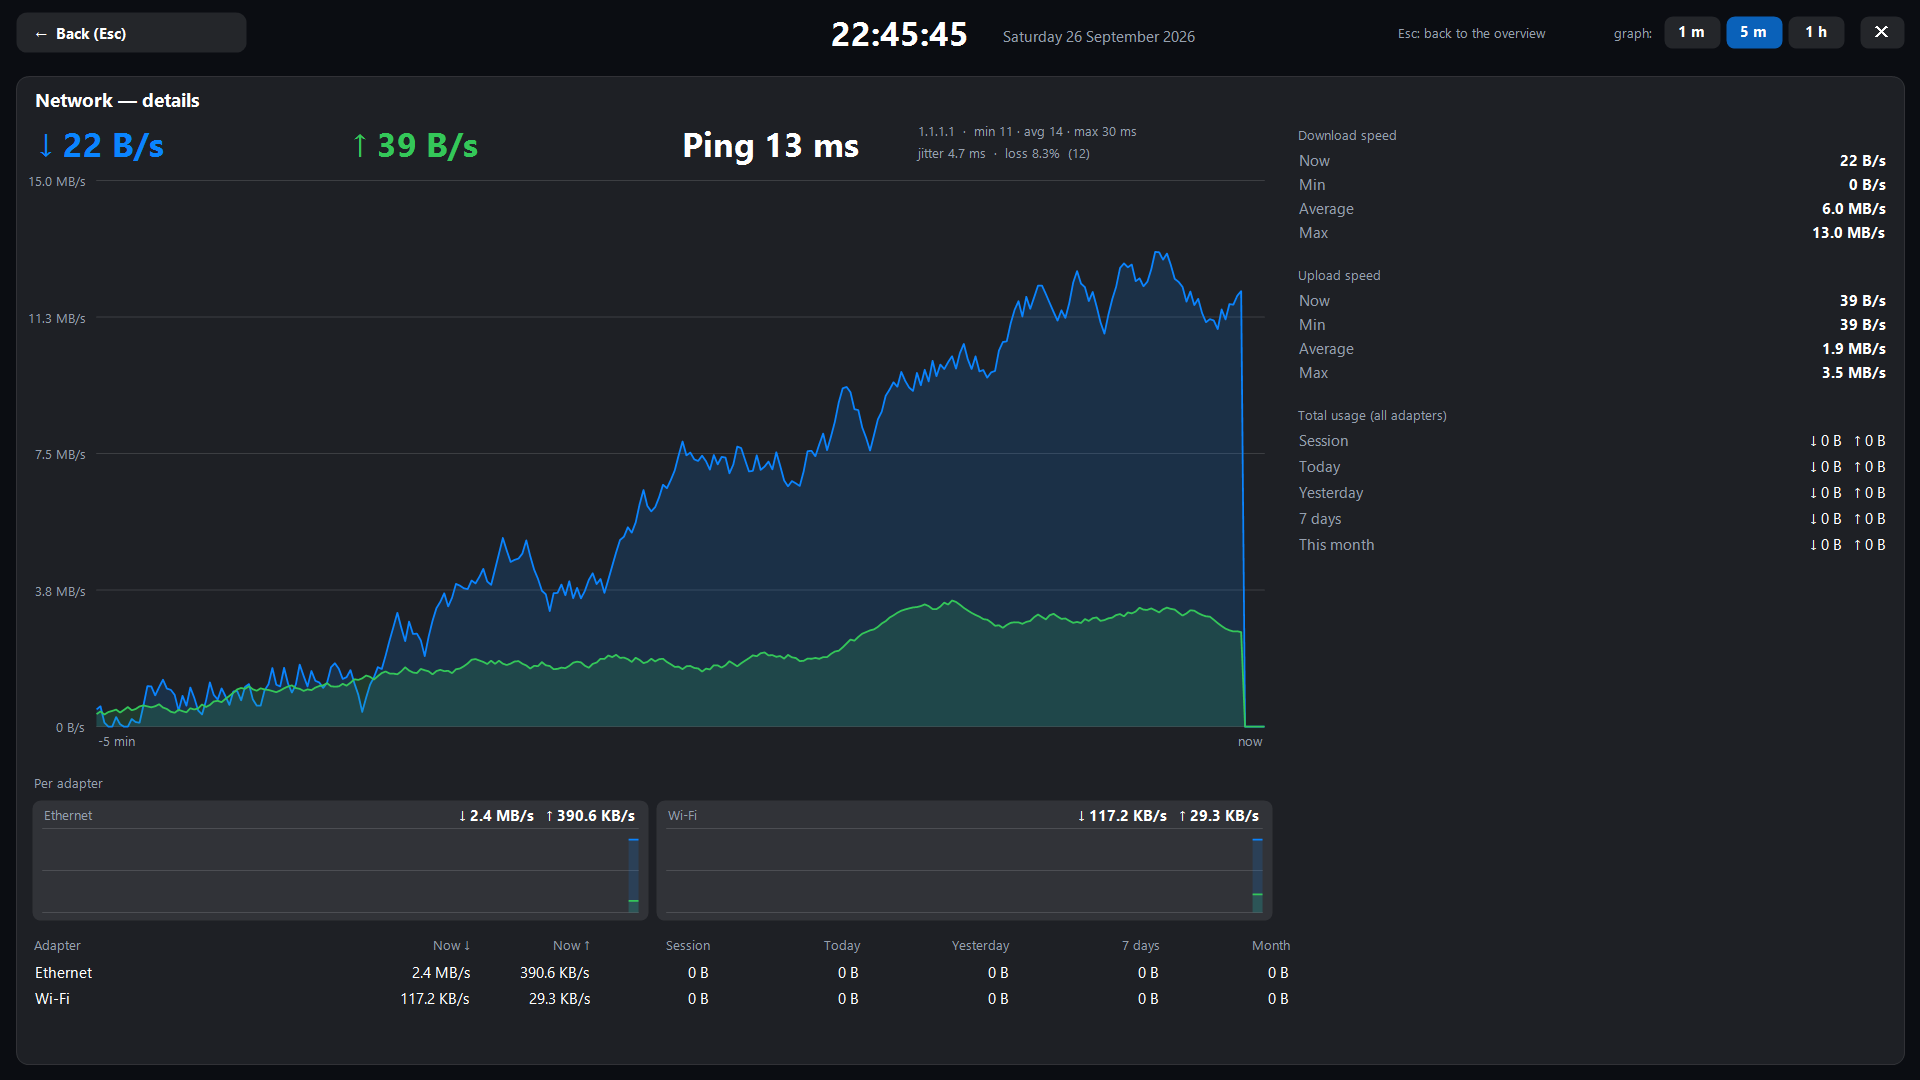
(Computer name and program names in the screenshots are anonymized.)
Why the values are actually correct
| Item | Source | Why it is correct |
|---|---|---|
| CPU | Processor Information\% Processor Time (total and per core) | Same value as Task Manager. Optionally (Settings → Widget → CPU measure) % Processor Utility, which scales with the boost clock and is almost 2× as high on a boosting CPU. |
| Memory | GlobalMemoryStatusEx.dwMemoryLoad | Exactly the percentage Task Manager shows. |
| GPU | Sum of all GPU Engine\Utilization Percentage per GPU (LUID) | Adds up 3D + copy + video engines, exactly like Task Manager. The counters are rebuilt every 5 s because engine instances come and go with processes. |
| Network | Network Interface\Bytes Received/Sent per sec | Per adapter or all adapters combined. |
| Temperature | LibreHardwareMonitorLib, with the ACPI thermal zone as CPU fallback | CPU/GPU temperature; requires administrator. If LibreHardwareMonitor has no CPU sensor (e.g. on new Ryzen chips), the Windows system thermal zone is used. |
| Ping | System.Net.NetworkInformation.Ping | Latency, jitter and packet loss to a configurable target. |
| Specifications | WMI (System.Management), registry, Win32 | Hardware inventory for the specifications page. |
GPU defaults to automatic: it follows the busiest GPU (handy with an iGPU + dGPU). You can also pick a fixed GPU in the settings (Widget tab → Sources).
Building
Requires: Windows and the .NET 8 SDK (https://dotnet.microsoft.com/download).
The easiest way: double-click build.bat. The script
- asks for administrator rights itself if needed (required to close the running app),
- closes
TaskbarStats.exeif it is running, - builds a Release build,
- starts the app again afterwards.
You can also do it manually:
dotnet build -c Release
The .exe is then in bin\Release\net8.0-windows\TaskbarStats.exe.
For a single standalone file without a .NET installation:
dotnet publish -c Release -r win-x64 --self-contained true ^
  -p:PublishSingleFile=true -p:IncludeNativeLibrariesForSelfExtract=true ^
  -p:EnableCompressionInSingleFile=true
Testing without touching your settings
Two environment variables let a test copy run next to the real app:
| Variable | Effect |
|---|---|
TASKBARSTATS_DATA | Own folder for settings.json and usage.json (instead of %AppData%\TaskbarStats). |
TASKBARSTATS_INSTANCE | Suffix for the single-instance mutex, so a second instance can start. |
TASKBARSTATS_PSEUDO | 1 shows the test language Pseudo (test) in the language list (check for untranslated or too-long texts). |
The app requests administrator rights (app.manifest); for automated tests, set requireAdministrator to asInvoker
in a temporary copy. See also CLAUDE.md.
Installer (Inno Setup)
Install Inno Setup once: winget install JRSoftware.InnoSetup
(or https://jrsoftware.org/isdl.php). Then double-click build-installer.bat: it
publishes the app and compiles installer\TaskbarStats.iss into
installer\Output\TaskbarStats-Setup-<version>.exe.
The installer:
- first shows the Readme (explanation + credits,
installer\Leesmij.txt) and installs it as well; - creates a Start menu group with TaskbarStats, Readme (explanation and credits) and Uninstall TaskbarStats; optionally a desktop shortcut too;
- on request enables autostart through a scheduled task with highest privileges (no UAC prompt at sign-in; the app requests admin rights and does not start from the Run key);
- closes a running version when installing/uninstalling;
- registers an uninstaller (also under Settings → Apps) that removes the task and asks whether
your settings and usage log (
%AppData%\TaskbarStats) may be removed too.
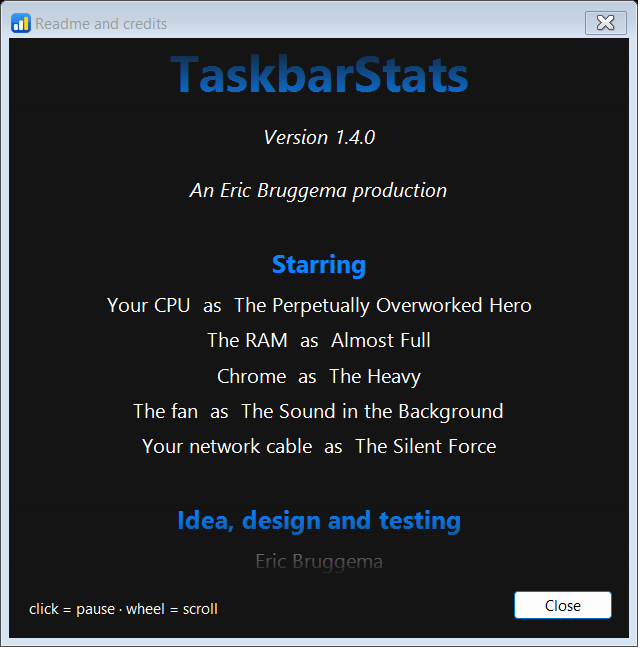
The app itself also has "Credits" in the right-click menu: a calmly scrolling end-credits screen with the credits, a few numbers from your own usage (for example how much you have downloaded) and a joke.
To change the name, credits or text: installer\Leesmij.txt, CreditsForm.cs and #define Publisher in the .iss file.
Usage
Start TaskbarStats.exe. The widget appears as a floating, always-on-top window
directly to the left of the notification area. It is an owned window of the taskbar, so it stays
on top of it. Drag with the left mouse button to move it (the position is saved
on release); in the settings (General tab) and in the menu there is "Stick to notification area": the widget then stays against the notification area and follows it when it shifts (dragging turns this off again).
Right-click on the widget opens a short menu:
- Settings… (bold, at the top) opens the settings window with tabs. Every change is applied and saved immediately;
controls that have no effect because of another choice are disabled:
- Widget: items (CPU, GPU, memory, upload/download, battery, disk, temperatures) with their sources (which GPU or automatic, which network adapter or all, disk space off/total/all separately/one disk, include network drives), display per item (digital, gauge or bar; CPU per core), battery percentage, labels on top, compact, transparent, height, font/size and refresh rate. The tab is divided into subtabs: Components, Sources, Display, Values, Appearance and Advanced (graph length, also per item, period, network graph scale, CPU measure and refresh rate). Dashboard, Fullscreen and General also have subtabs. Settings for items that are currently off (for example GPU) can simply be filled in already; they apply as soon as you turn the item on. The order of the items in the widget (network, disk I/O, CPU, GPU, memory, battery, disk space, temperatures) is set with the arrow buttons; disabled items are marked "(off)". The order is also part of themes.
- Colors: text, background, gauge/bar, warning, critical, border and thresholds (e.g. 85% / 95%).
- Dashboard: show, foreground/background, click-through, lock, transparency, scale, columns, and order and on/off per main item.
- Fullscreen: which screen, and order and on/off per main item, with a preview of the layout.
- Themes: 16 bundled themes (Default, Dark, Light, Black and white, Love, CGA, Matrix, Amber, Game Boy, Dracula, Ocean, Sunset, Forest, Minimal, Meters, Neon); save, load, delete, import and export your own theme (see below).
- General: language (Dutch, English or your own language file), start with Windows (scheduled task, no UAC prompt), lock position and stick to the notification area, hide in fullscreen, tooltip delay (minimum 2 s, default 2 s, or off), notifications (nearly full disk, prolonged high load), monthly limit for network usage and the usage log.
- Theme: quick pick to apply a theme with one click.
- Usage: received/sent per network adapter (session, today, yesterday, 7 days, month) and the per-day log with CSV export.
- Stick to notification area (the widget stays against the notification area and follows it).
- Desktop dashboard and Fullscreen dashboard, each a submenu (dashboard: show, click-through, lock, settings; fullscreen: open/close, tour, settings), then Usage, Copy info, Copy system information, Credits, About (with a button for the welcome screen) and Exit.
- Tooltip: hold the mouse over the widget for at least 2 s (adjustable) for all details (RAM in GB, per GPU, network per adapter, disks and disk space, temperatures).
- Battery (laptops): upright battery with level, color and lightning bolt/plug; percentage inside, beside or off.
Also: double-click opens Task Manager, the middle mouse button copies the tooltip information to the clipboard, and a welcome screen appears on first start.
The menu stays open when you click an option, so you can change several things in a row. It closes when you click outside the menu, press Esc, or the mouse has been away from the menu (or a submenu) for about a second.
Only one instance runs at a time.
Desktop dashboard and fullscreen
Desktop dashboard (Settings → Dashboard, or menu Desktop dashboard; off by default): a large, semi-transparent window with tiles (CPU with per-core bars, GPU per card with VRAM, memory, network with a mini graph per adapter, disks, battery, heaviest programs, system) and graphs of the last 5 minutes. Everything can be turned on/off separately; also adjustable: foreground or background, scale 50–300%, transparency, 1–4 columns, lock and click-through (clicks pass through it; Ctrl+Alt+D or double-clicking the icon by the clock turns it on/off, because right-clicking no longer works then). It stays visible when you use "Show desktop".
Fullscreen dashboard (Ctrl+Alt+F, or menu Fullscreen dashboard): one dense overview of everything on a whole screen (you choose which). Click a tile for the in-depth view (graph up to 1 hour, min/average/max, per core, per GPU with VRAM, per adapter, per disk, top programs, system info); Esc goes back and closes from the overview. Keys 1/2/3 choose the graph: 1 min / 5 min / 1 hour.
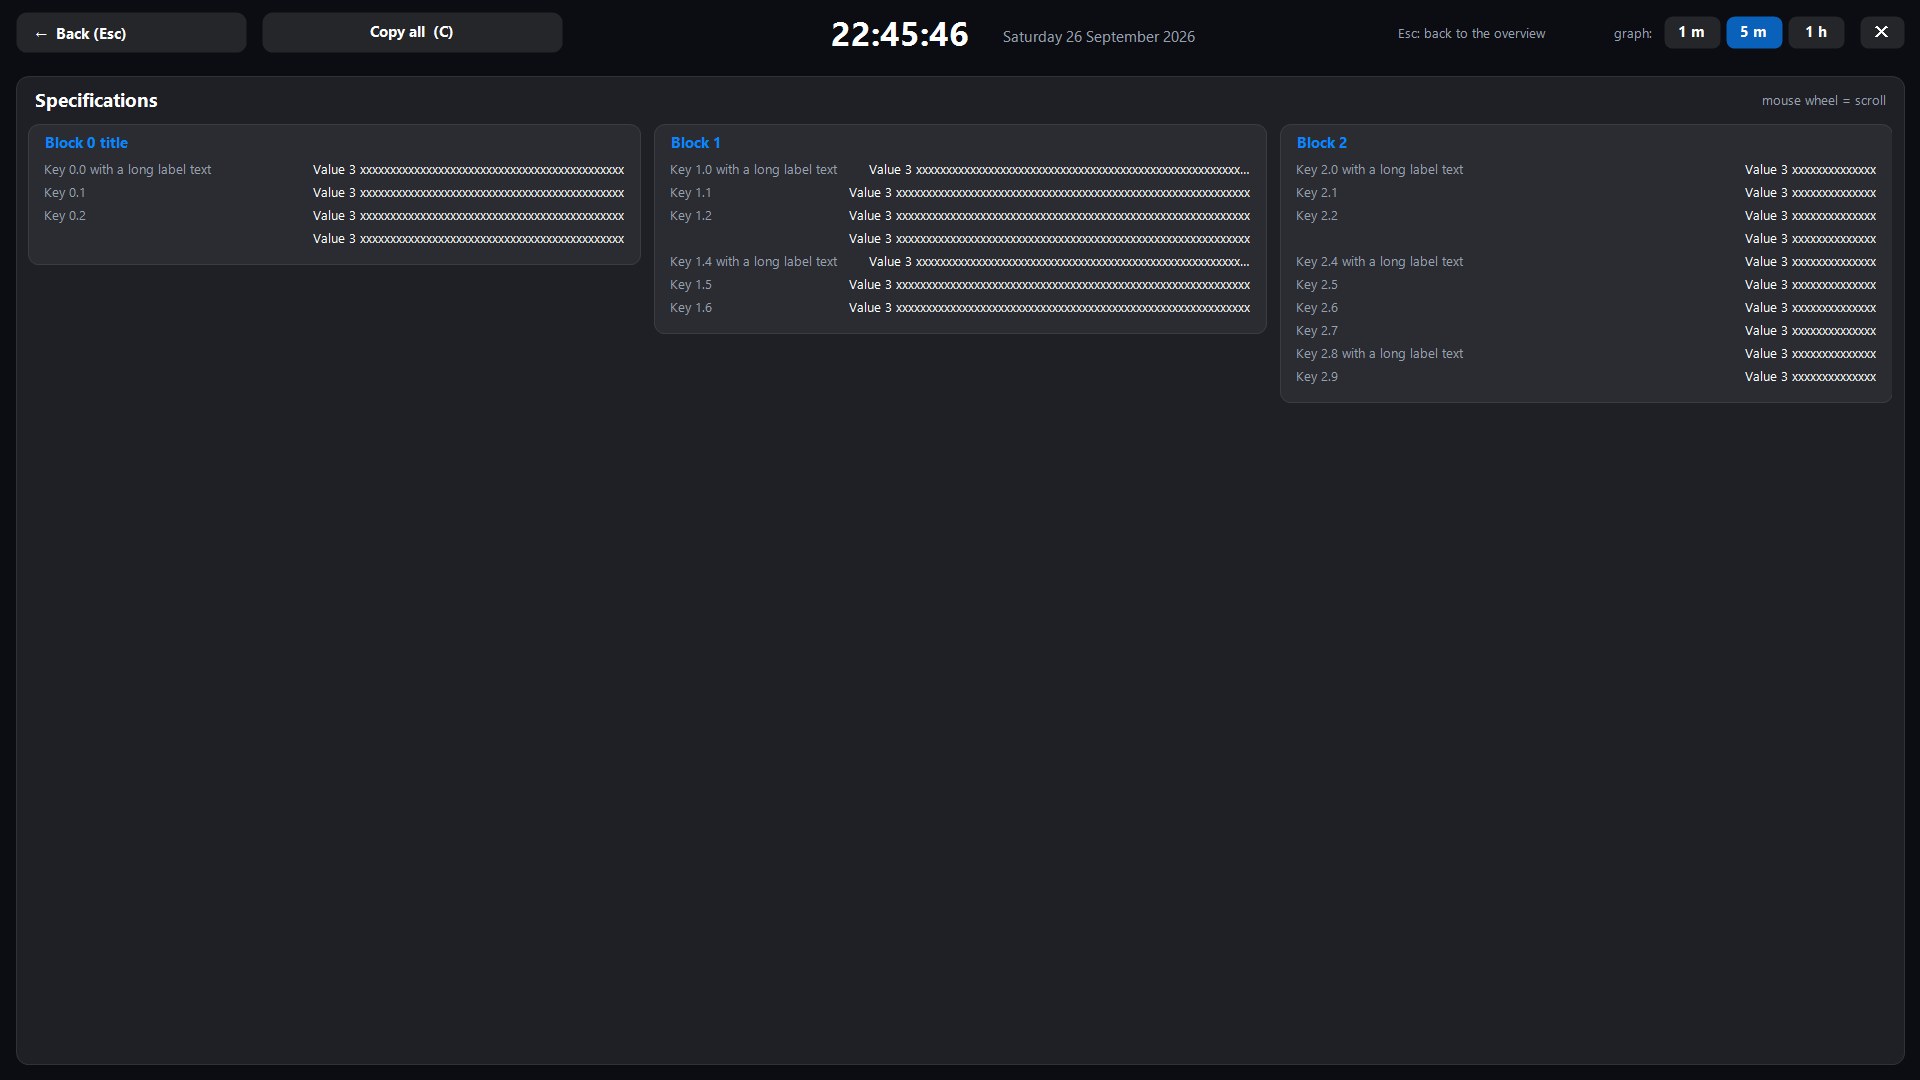
Specifications (button at the top or key I): one page with all hardware and system info — computer, motherboard and BIOS, Windows, processor (cores/threads, clocks, cache, instruction sets), graphics cards (driver, VRAM, outputs), memory modules (type, speed, manufacturer), disks (type, health, firmware) and volumes, displays (size, refresh rate), network adapters, battery (wear, charge cycles), security (Secure Boot, TPM), sound, input devices, Bluetooth and USB devices. Scroll with the mouse wheel.
Automatic tour: click 3× on an empty spot in the fullscreen screen (or press the space bar) and the screen steps through all pages (overview, each detail, specifications). You set the time per page (default 10 s) via the menu (Fullscreen tour) or in Settings → Fullscreen. A click or key stops the tour.
Ping: turn on Ping (latency) under Settings → Widget; the widget then shows for example PING 12 ms (orange from 100 ms, red from 250 ms or when there is no reply). The target (default 1.1.1.1) is adjustable. The tooltip and the network details of the fullscreen screen show min/average/max, jitter and packet loss over the last ~2 minutes.

Temperature display: you can show CPU and GPU temperature (Settings → Widget → Display) as a number, gauge or bar, or — narrower — place it small behind the CPU/GPU cell (Temperature small after the CPU/GPU cell), for example CPU 33% 55°. This is also part of themes.
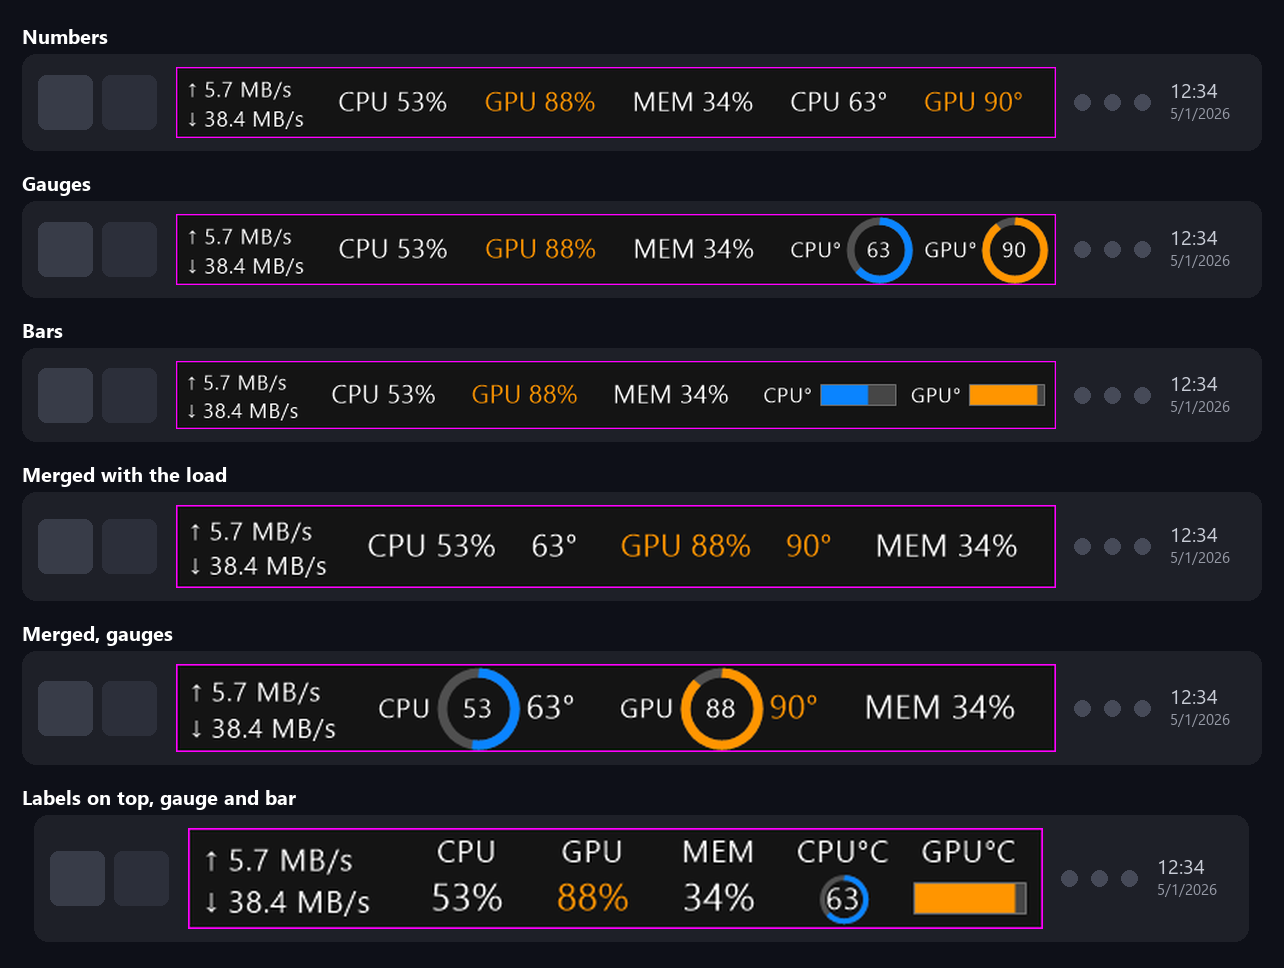
Value formatting (Settings → Widget → Values, widget only): network speed in bytes (MB/s) or bits (Mb/s), automatic or fixed unit (KB/s or MB/s), short values, omit the unit or % sign, swap upload and download, and memory as a percentage, used (GB) or available (GB).
Disk read/write as arrows: under Settings → Widget → Values you choose Disk read/write shown as R / W or arrows (↓ read, ↑ write); it applies to the widget, the tooltip, the dashboard and the fullscreen screen.
Running processes and FPS (Settings → Widget → Components): the number of processes as PROC 250, or only the apps (processes with a visible window, like Apps in Task Manager), only the background processes or both (APPS/BG 5/245); you choose that under Values. The tooltip also shows the number of threads, and the system tile of the dashboard and the System page of the fullscreen screen show the counts. FPS (experimental) measures the frame rate of the foreground program, like PresentMon: an ETW session listens to the DirectX Present events (DXGI/D3D9, with DxgKrnl for Vulkan among others) and counts them per process (only process id and timestamp, no content). It is off by default, needs administrator rights, costs a little CPU while it is on, and only shows a value while a program is drawing frames (games, video players, browsers); the tooltip also names the 1% low and the program.
Extra items for the widget: CPU clock frequency, disk busy (%), disk temperature and motherboard temperature. The last two read sensors through LibreHardwareMonitor (administrator required) and disappear automatically when there is no value.
Graph as a display style (length very short, short, medium, long or custom in pixels; period 30/60/120 s): CPU, GPU, memory, temperatures, network (download and upload as two lines, scale automatic or fixed) and ping can be shown as a mini history graph in the widget (last 30, 60 or 120 seconds). Missing pings (no reply) interrupt the line with a red dot.
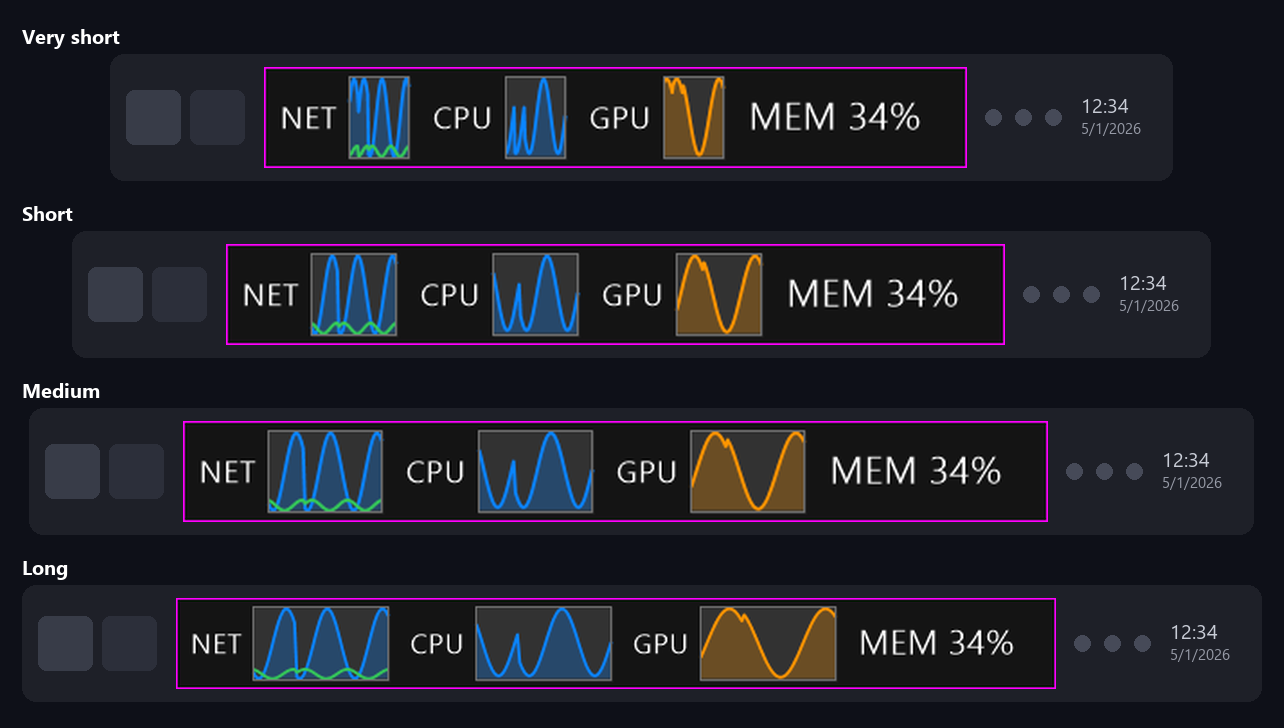
Length per graph: every graph in the widget can have its own length, for example the network wide, the CPU very short and the memory at 100 px. Under Settings → Widget → Advanced → Graph length per item you choose per item Default (follows the general length), Tiny, Short, Medium, Long or Custom with your own width from 16 to 160 px. The choice belongs to the theme and is saved immediately.

Background image: per window (widget, dashboard and fullscreen; Settings, tabs Widget, Dashboard and Fullscreen) choose a png/jpg/bmp with mode Fill, Stretch, Fit, Tile or Center and an opacity of 0–100%. The image goes under the text and tiles; if the file is missing, the normal background applies. Paths are not part of themes.

Follow the Windows theme (widget, Settings → Colors): Dark/light picks a dark or light background with automatically readable text; Dark/light + accent also uses the Windows accent color for gauges and bars. Switching the Windows theme is followed immediately.
Mouse actions and click-through (Settings → General): choose what a double-click and the middle mouse button do (Task Manager, dashboard, fullscreen, settings, usage log, copy info, menu or nothing). Ctrl+Alt+W (or the icon by the clock) lets clicks fall through the widget.
More notifications: thresholds for CPU, GPU and disk temperature, memory usage and network usage per day (0 = off).
Update check (optional, off by default): at most once every 24 hours it checks via GitHub whether a newer version exists; that is only reported (menu item and notification), nothing is ever downloaded or installed.
Sensors (LibreHardwareMonitor, only active while the fullscreen screen is open): CPU power, temperatures and clocks, GPU temperature/power/clock/fan per card, disk temperature and health (SMART), motherboard and fans, memory and battery. Administrator rights are needed for CPU, motherboard and disks (the app already requests them); without those rights the screen shows the sensors that are available (GPU, memory, battery) and a short explanation.
Dashboard and Fullscreen have the same structure with three subtabs: Window, Components and layout (with a thumbnail of the layout; the dashboard also has the number of columns there) and Background. The Widget tab also calls its first subtab Components and layout.
Order and items: in the settings window (tab Dashboard or Fullscreen) you turn the main items (CPU, GPU, memory, network, disks, battery, heaviest programs, system) on or off and move them with the arrow buttons. The desktop dashboard fills its columns in that order; the fullscreen screen fills rows of four columns (CPU is two wide; battery and system share a cell) and adjusts the width.
Languages: the app is available in Dutch, English and German; on first start it follows the Windows language if available (also regional languages such as pt-br, which supplement pt). Texts are not in the code but in lang/<code>.json (embedded in the exe): the English source text on the left, the translation on the right. An empty field means "not translated yet" and shows English. The tools\LangTool utility actually parses the code (Roslyn) and checks on every build that everything is consistent: an error in a language file makes the build fail, missing translations are warnings.
Adding a language (for example French):
dotnet run --project tools\LangTool -c Release -- new fr "Français" --culture fr-FR
- This creates
lang/fr.jsonwith all texts empty. Fill in the values on the right; the keys on the left and the placeholders ({0},{1}) stay as they are;@@…after a key is context only. - Plurals (
"{0} day|{0} days"): give as many forms, separated by|, as the_pluralrule of your language requires (one-otheris the default;zero-or-one-otherfor French and Brazilian Portuguese,one-few-many-otherfor Polish and Russian,otherfor Japanese and Chinese). - Check:
dotnet run --project tools\LangTool -c Release -- check(errors: broken placeholders, duplicate keys, wrong number of plural forms, leading or trailing spaces that do not match).statusshows what percentage of each language is done. - Try it without building: put the file in
%AppData%\TaskbarStats\lang\and restart the app; the language then appears under Settings → General. A file there also overrides a built-in language. - Want to see what is still untranslated or comes out too long? Start the app with the environment variable
TASKBARSTATS_PSEUDO=1and choose the language Pseudo (test): every text then appears with accents and 30% longer between brackets, so untranslated or truncated text stands out immediately. - Share your translation via a pull request (
lang/fr.json).
For anyone changing the code: use only Loc.T("fixed text"), Loc.T("text {0}", value) and Loc.P("{0} day|{0} days", n); then run LangTool sync (prepares new texts in all languages) and translate the empty values. To change an English text: LangTool rename "old" "new" (updates the code and all language files). LangTool also reports texts that are hard-coded in the code.
Themes: a theme is a small JSON file with style, colors, font, height, and dashboard and fullscreen layout (no positions or language). Your own themes are in %AppData%\TaskbarStats\themes\ and can be shared: export a theme and pass on the file, the other person imports it. Under Settings → Themes you see the JSON in an editor for the selected theme: edit it by hand and choose Save JSON (if the JSON has an error you get a message with line and position). You can also modify a bundled theme this way: it is then stored on disk as your own file with the same name and takes precedence over the bundled one (built-in, edited); Reset to original removes that file again. With Preview (10 s) you see the selected theme (or the JSON in the editor, even if you have not saved it yet) for 10 seconds on the widget, dashboard and fullscreen; during the preview the values go up and down (from low to warning and critical) and the display changes every 2 s: first the theme itself, then numbers, gauge, bar and graph, so you see in one go how the theme looks in all styles (no notifications appear then). Afterwards everything returns automatically as it was (clicking again stops earlier).
Everything you copy or export (info to the clipboard, system information, diagnostics, export files of themes, settings and the usage CSV) is marked by the program with the link to this page, so the recipient knows where it came from; in the JSON files this is a _generator field that is ignored on import.
Copy system information: on the specifications page of the fullscreen screen (key I) there is a button Copy all (or key C), and in the right-click menu Copy system information: all specifications (computer, operating system, processor, memory, graphics card, disks, network, …) as plain text on the clipboard, handy for a support request or forum post.
Network drives (mapped drives) are included via Settings → Widget → Sources → Include network drives (also in dashboard and fullscreen); they are queried in the
background, so an unreachable share does not slow the app down. Because the app runs as administrator and Windows then does not see the drive letters of
your normal session, the app reads the mappings from the registry (HKCU\Network) and requests the space via the UNC path.
Settings
Stored in %AppData%\TaskbarStats\settings.json (survives rebuilds and
reinstalls). Changes in the settings are saved immediately. You can also edit these by hand:
FontFamily, FontSize, WidgetHeight, TrayGap, colors and thresholds.
Backup and portable: under Settings → General → Backup you export all settings to a single JSON file, import them again (for example on another PC) or reset everything to the defaults (themes and the usage log remain). For portable use (for example on a USB stick) create an empty file portable.txt next to TaskbarStats.exe: settings, themes, language files and logs are then in the data folder next to it and nothing is written to %AppData%.
When something goes wrong: errors are recorded in diag.log in the data folder (only on your own PC, nothing is sent). An error in a timer or drawing routine lets the app keep running; a fatal error on a background thread restarts the app once. In About TaskbarStats the Copy diagnostics button copies version, Windows, screens and the last log lines (without user or computer name) to paste into a bug report. Crash notice: if the app crashed last time, it says so at the next start with a balloon notification (click it for the About screen with Copy diagnostics). A crash is recognized by the flag of the error safety net, or, for a hard crash, by an "Application Error" in the Windows event log (with the error code in diag.log). Closing via Task Manager or a power failure is only noted in the log, not reported as a crash. If you start the app a second time, the running app opens its settings.
Transparent background
The window is a layered window with per-pixel alpha. With "transparent" the
background is drawn with alpha 1: invisible, but still clickable. (A
TransparencyKey let clicks on the transparent parts fall through to the window underneath,
so the right-click menu sometimes did not appear.)
Administrator rights
The app requests administrator rights (via app.manifest). This is needed for the
temperature sensors (LibreHardwareMonitorLib). If you do not need those, you may set requestedExecutionLevel
in app.manifest to asInvoker; temperature then does not work.
Starting automatically with Windows
Use "Start with Windows" in the settings (General tab), or the option in the installer. This creates a scheduled "at log on" task with highest privileges, so there is no UAC prompt.
Code overview
| File | Role |
|---|---|
src/Program.cs | Entry point, single-instance mutex, --autostart-on/off for the installer. |
src/WidgetForm.cs | The taskbar widget: drawing to an ARGB bitmap (UpdateLayeredWindow), mouse, menu, tooltip, notifications, hotkeys, sampler thread. |
src/Metrics.cs | Performance counters (PDH wildcard for GPU), memory, battery, temperature, DXGI GPU names. |
src/DashboardForm.cs | Desktop dashboard + MetricHistory/Ring (graph history) and DashContext. |
src/FullscreenForm.cs | Fullscreen "cockpit": dense overview, detail views per tile, specifications page and automatic tour. |
src/HardwareInfo.cs | Hardware inventory (WMI etc.), collected once asynchronously for the specifications page. |
src/PingMonitor.cs | Ping measurement on its own thread (last, min/avg/max, jitter, loss). |
src/UsageTracker.cs | Network usage per adapter and per day (usage.json), thread-safe. |
src/ProcessSampler.cs | Heaviest processes (sampled asynchronously). |
src/AppSettings.cs | Settings (JSON). |
src/TaskbarHost.cs | Finds the position of the notification area/taskbar. |
src/StartupManager.cs | Autostart via a scheduled task (highest privileges). |
src/SettingsForm.cs, src/Themes.cs, src/Tiles.cs | Settings window with tabs (applied live), themes (bundled + own JSON files), item ids/order. |
src/LogForm.cs | Window with the usage log. |
src/WelcomeForm.cs, src/AboutForm.cs | Welcome screen and About window. |
src/Loc.cs, lang/*.json | Translations: Loc.T("English text"), Loc.P (plurals) with one JSON file per language (see Languages). |
tools/LangTool | Checks, synchronizes and renames the language texts (Roslyn); runs on every build. |
src/Diag.cs, src/AppPaths.cs | Log file, crash safety net, diagnostics report; where the data lives (%AppData%, TASKBARSTATS_DATA or portable). |
tests/TaskbarStats.Tests | Automated tests (xUnit); dotnet test tests\TaskbarStats.Tests -c Release. |
Performance and threads
The UI thread only does drawing and menus; the heavy work happens elsewhere:
- A sampler thread reads the measurements (
Metrics.Update) and tracks usage (UsageTracker.Sample); the UI draws with the latest values. Shared data is thread-safe (locked or replaced atomically). - GPU, network and CPU cores go through a single PDH query with a wildcard per counter (e.g.
\GPU Engine(*)\Utilization Percentage), not through separatePerformanceCounterobjects (GPU cost 150–780 ms per tick; the network went from ~39 to ~7 ms). - Frugal: with a hidden widget and no dashboard/fullscreen, it only measures every 5 s, usage is updated every 5 s, the working set is regularly returned to Windows and the runtime runs without an extra GC thread. Measured at rest: ~2% of one core and ~60 MB working set (was ~2–5% and ~93 MB).
- The widget is not put back on top every 200 ms (
SetWindowPoson a taskbar window can block 100+ ms); that only happens when another visible topmost window is really on top of it. - Sampling programs (
ProcessSampler.SampleAsync) and network drives (DriveInfo) run in the background.
License and credits
MIT license (see LICENSE): you may freely use, modify and share TaskbarStats, including in your own projects. The only condition is that the copyright line and the license text are kept — so please leave the credits in place. Thanks!
The program uses LibreHardwareMonitorLib (MPL-2.0), HidSharp (Apache-2.0) and .NET (MIT); these fall under their own licenses.
Contact
Questions, ideas or just want to say hi? Find me on LinkedIn or Facebook, or open an issue here.
Contributors

99 commits
Similar repos


Languages
C#
99.0%
Lichtgewicht CPU/GPU/geheugen/netwerk/schijf/batterij-monitor voor de Windows-taakbalk (Task Manager-waarden)
C#
0
99 commits
updated Sep 26, 2026
See what people are saying
README
TaskbarStats
Languages: English · Nederlands · Deutsch
A lightweight CPU / GPU / memory / network / disk / battery / temperature monitor that floats next to the notification area of the Windows taskbar — like TrafficMonitor, but with values that match Task Manager. It also comes with a large desktop dashboard and a fullscreen "cockpit".
Demo videos
Four English demos of 45 to 60 seconds each. Download, install and run takes a few seconds in every one of them, so most of the time goes to the program itself:
| Video | For | What it shows |
|---|---|---|
| Quick start (47 s) | Everyone | Download, install, run, right-click menu, themes with backgrounds, JSON editor with preview, processes and FPS, dashboard and fullscreen |
| For number lovers (57 s) | Statistics nerds | Every graph with its own length, four display styles, processes (all, apps, background), tooltip details, dashboard, fullscreen cockpit, specifications, JSON everything |
| For gamers (51 s) | Gamers | FPS in the taskbar or floating on top of your game, 1% low, tiny overlay mode, click-through (Ctrl+Alt+W), GPU and CPU temperatures, ping, themes |
| The complete tour (59 s) | Everyone | The whole program, feature by feature |
More documentation is listed in the docs index.
For gamers 🎮
Turn your taskbar into a free FPS counter, or drag the widget over your game and let it float on top.
- FPS of the game you are playing — measured the same way PresentMon does (Windows event tracing), for the program in the foreground. Works with DirectX games (DXGI/D3D9) and browsers. Experimental: turn it on in Settings → Widget → Values.
- Tiny overlay mode — compact, labels on top, just FPS, GPU and CPU:
- Click-through (Ctrl+Alt+W): the widget stays visible but your mouse clicks go straight to the game.
- Everything a gamer wants to know: GPU load, GPU and CPU temperature, ping, and a graph for whichever one is misbehaving.
- Pick a look that fits your rig: Neon for the retro racing vibe, Matrix for hackers, Game Boy for nostalgia, Amber and CGA if you miss the 80s.
Watch it in action: For gamers (51 s).
Not a gamer? The same widget also counts your processes (total, apps you can see, background, or both):
Screenshots
Screenshots show the English interface (values are made up); a few older ones still show the Dutch interface. The app also runs in Dutch and German.
Taskbar widget — numbers, gauges, bars or graphs, with FPS and process count next to CPU, GPU and memory:
Right-click menu (short, and it stays open while you pick several things) and the settings window with tabs (appearance, colors, dashboard, fullscreen, themes), where every change is visible immediately:
Some themes have their own background, drawn in code (so no files): Matrix (falling characters), Neon (grid), Sunset (sun), Forest (pine forest with fireflies), Ocean (waves), Love (hearts, large and small), Dracula (stars), Amber, CGA and Game Boy (scanlines). The theme applies it to the widget, dashboard and fullscreen at the same time; a theme without a background removes such a pattern again (your own image stays). A theme's JSON contains Background (matrix, grid, stars, sunset, waves, scanlines, hearts or forest) and BackgroundOpacity (5-100).
On 14 February the program temporarily starts with the Love theme (in memory only: settings.json keeps your own look, and as soon as you open Settings or pick a theme yourself, it is yours again). You can turn this off under Settings → Themes (Show the Love theme on 14 February).
The bundled themes, shown here on the desktop dashboard:
Desktop dashboard (semi-transparent, scalable, foreground or background, click-through):
Fullscreen dashboard (Ctrl+Alt+F) — overview, and click a tile for details:
(Computer name and program names in the screenshots are anonymized.)
Why the values are actually correct
| Item | Source | Why it is correct |
|---|---|---|
| CPU | Processor Information\% Processor Time (total and per core) | Same value as Task Manager. Optionally (Settings → Widget → CPU measure) % Processor Utility, which scales with the boost clock and is almost 2× as high on a boosting CPU. |
| Memory | GlobalMemoryStatusEx.dwMemoryLoad | Exactly the percentage Task Manager shows. |
| GPU | Sum of all GPU Engine\Utilization Percentage per GPU (LUID) | Adds up 3D + copy + video engines, exactly like Task Manager. The counters are rebuilt every 5 s because engine instances come and go with processes. |
| Network | Network Interface\Bytes Received/Sent per sec | Per adapter or all adapters combined. |
| Temperature | LibreHardwareMonitorLib, with the ACPI thermal zone as CPU fallback | CPU/GPU temperature; requires administrator. If LibreHardwareMonitor has no CPU sensor (e.g. on new Ryzen chips), the Windows system thermal zone is used. |
| Ping | System.Net.NetworkInformation.Ping | Latency, jitter and packet loss to a configurable target. |
| Specifications | WMI (System.Management), registry, Win32 | Hardware inventory for the specifications page. |
GPU defaults to automatic: it follows the busiest GPU (handy with an iGPU + dGPU). You can also pick a fixed GPU in the settings (Widget tab → Sources).
Building
Requires: Windows and the .NET 8 SDK (https://dotnet.microsoft.com/download).
The easiest way: double-click build.bat. The script
- asks for administrator rights itself if needed (required to close the running app),
- closes
TaskbarStats.exeif it is running, - builds a Release build,
- starts the app again afterwards.
You can also do it manually:
dotnet build -c Release
The .exe is then in bin\Release\net8.0-windows\TaskbarStats.exe.
For a single standalone file without a .NET installation:
dotnet publish -c Release -r win-x64 --self-contained true ^
  -p:PublishSingleFile=true -p:IncludeNativeLibrariesForSelfExtract=true ^
  -p:EnableCompressionInSingleFile=true
Testing without touching your settings
Two environment variables let a test copy run next to the real app:
| Variable | Effect |
|---|---|
TASKBARSTATS_DATA | Own folder for settings.json and usage.json (instead of %AppData%\TaskbarStats). |
TASKBARSTATS_INSTANCE | Suffix for the single-instance mutex, so a second instance can start. |
TASKBARSTATS_PSEUDO | 1 shows the test language Pseudo (test) in the language list (check for untranslated or too-long texts). |
The app requests administrator rights (app.manifest); for automated tests, set requireAdministrator to asInvoker
in a temporary copy. See also CLAUDE.md.
Installer (Inno Setup)
Install Inno Setup once: winget install JRSoftware.InnoSetup
(or https://jrsoftware.org/isdl.php). Then double-click build-installer.bat: it
publishes the app and compiles installer\TaskbarStats.iss into
installer\Output\TaskbarStats-Setup-<version>.exe.
The installer:
- first shows the Readme (explanation + credits,
installer\Leesmij.txt) and installs it as well; - creates a Start menu group with TaskbarStats, Readme (explanation and credits) and Uninstall TaskbarStats; optionally a desktop shortcut too;
- on request enables autostart through a scheduled task with highest privileges (no UAC prompt at sign-in; the app requests admin rights and does not start from the Run key);
- closes a running version when installing/uninstalling;
- registers an uninstaller (also under Settings → Apps) that removes the task and asks whether
your settings and usage log (
%AppData%\TaskbarStats) may be removed too.
The app itself also has "Credits" in the right-click menu: a calmly scrolling end-credits screen with the credits, a few numbers from your own usage (for example how much you have downloaded) and a joke.
To change the name, credits or text: installer\Leesmij.txt, CreditsForm.cs and #define Publisher in the .iss file.
Usage
Start TaskbarStats.exe. The widget appears as a floating, always-on-top window
directly to the left of the notification area. It is an owned window of the taskbar, so it stays
on top of it. Drag with the left mouse button to move it (the position is saved
on release); in the settings (General tab) and in the menu there is "Stick to notification area": the widget then stays against the notification area and follows it when it shifts (dragging turns this off again).
Right-click on the widget opens a short menu:
- Settings… (bold, at the top) opens the settings window with tabs. Every change is applied and saved immediately;
controls that have no effect because of another choice are disabled:
- Widget: items (CPU, GPU, memory, upload/download, battery, disk, temperatures) with their sources (which GPU or automatic, which network adapter or all, disk space off/total/all separately/one disk, include network drives), display per item (digital, gauge or bar; CPU per core), battery percentage, labels on top, compact, transparent, height, font/size and refresh rate. The tab is divided into subtabs: Components, Sources, Display, Values, Appearance and Advanced (graph length, also per item, period, network graph scale, CPU measure and refresh rate). Dashboard, Fullscreen and General also have subtabs. Settings for items that are currently off (for example GPU) can simply be filled in already; they apply as soon as you turn the item on. The order of the items in the widget (network, disk I/O, CPU, GPU, memory, battery, disk space, temperatures) is set with the arrow buttons; disabled items are marked "(off)". The order is also part of themes.
- Colors: text, background, gauge/bar, warning, critical, border and thresholds (e.g. 85% / 95%).
- Dashboard: show, foreground/background, click-through, lock, transparency, scale, columns, and order and on/off per main item.
- Fullscreen: which screen, and order and on/off per main item, with a preview of the layout.
- Themes: 16 bundled themes (Default, Dark, Light, Black and white, Love, CGA, Matrix, Amber, Game Boy, Dracula, Ocean, Sunset, Forest, Minimal, Meters, Neon); save, load, delete, import and export your own theme (see below).
- General: language (Dutch, English or your own language file), start with Windows (scheduled task, no UAC prompt), lock position and stick to the notification area, hide in fullscreen, tooltip delay (minimum 2 s, default 2 s, or off), notifications (nearly full disk, prolonged high load), monthly limit for network usage and the usage log.
- Theme: quick pick to apply a theme with one click.
- Usage: received/sent per network adapter (session, today, yesterday, 7 days, month) and the per-day log with CSV export.
- Stick to notification area (the widget stays against the notification area and follows it).
- Desktop dashboard and Fullscreen dashboard, each a submenu (dashboard: show, click-through, lock, settings; fullscreen: open/close, tour, settings), then Usage, Copy info, Copy system information, Credits, About (with a button for the welcome screen) and Exit.
- Tooltip: hold the mouse over the widget for at least 2 s (adjustable) for all details (RAM in GB, per GPU, network per adapter, disks and disk space, temperatures).
- Battery (laptops): upright battery with level, color and lightning bolt/plug; percentage inside, beside or off.
Also: double-click opens Task Manager, the middle mouse button copies the tooltip information to the clipboard, and a welcome screen appears on first start.
The menu stays open when you click an option, so you can change several things in a row. It closes when you click outside the menu, press Esc, or the mouse has been away from the menu (or a submenu) for about a second.
Only one instance runs at a time.
Desktop dashboard and fullscreen
Desktop dashboard (Settings → Dashboard, or menu Desktop dashboard; off by default): a large, semi-transparent window with tiles (CPU with per-core bars, GPU per card with VRAM, memory, network with a mini graph per adapter, disks, battery, heaviest programs, system) and graphs of the last 5 minutes. Everything can be turned on/off separately; also adjustable: foreground or background, scale 50–300%, transparency, 1–4 columns, lock and click-through (clicks pass through it; Ctrl+Alt+D or double-clicking the icon by the clock turns it on/off, because right-clicking no longer works then). It stays visible when you use "Show desktop".
Fullscreen dashboard (Ctrl+Alt+F, or menu Fullscreen dashboard): one dense overview of everything on a whole screen (you choose which). Click a tile for the in-depth view (graph up to 1 hour, min/average/max, per core, per GPU with VRAM, per adapter, per disk, top programs, system info); Esc goes back and closes from the overview. Keys 1/2/3 choose the graph: 1 min / 5 min / 1 hour.
Specifications (button at the top or key I): one page with all hardware and system info — computer, motherboard and BIOS, Windows, processor (cores/threads, clocks, cache, instruction sets), graphics cards (driver, VRAM, outputs), memory modules (type, speed, manufacturer), disks (type, health, firmware) and volumes, displays (size, refresh rate), network adapters, battery (wear, charge cycles), security (Secure Boot, TPM), sound, input devices, Bluetooth and USB devices. Scroll with the mouse wheel.
Automatic tour: click 3× on an empty spot in the fullscreen screen (or press the space bar) and the screen steps through all pages (overview, each detail, specifications). You set the time per page (default 10 s) via the menu (Fullscreen tour) or in Settings → Fullscreen. A click or key stops the tour.
Ping: turn on Ping (latency) under Settings → Widget; the widget then shows for example PING 12 ms (orange from 100 ms, red from 250 ms or when there is no reply). The target (default 1.1.1.1) is adjustable. The tooltip and the network details of the fullscreen screen show min/average/max, jitter and packet loss over the last ~2 minutes.
Temperature display: you can show CPU and GPU temperature (Settings → Widget → Display) as a number, gauge or bar, or — narrower — place it small behind the CPU/GPU cell (Temperature small after the CPU/GPU cell), for example CPU 33% 55°. This is also part of themes.
Value formatting (Settings → Widget → Values, widget only): network speed in bytes (MB/s) or bits (Mb/s), automatic or fixed unit (KB/s or MB/s), short values, omit the unit or % sign, swap upload and download, and memory as a percentage, used (GB) or available (GB).
Disk read/write as arrows: under Settings → Widget → Values you choose Disk read/write shown as R / W or arrows (↓ read, ↑ write); it applies to the widget, the tooltip, the dashboard and the fullscreen screen.
Running processes and FPS (Settings → Widget → Components): the number of processes as PROC 250, or only the apps (processes with a visible window, like Apps in Task Manager), only the background processes or both (APPS/BG 5/245); you choose that under Values. The tooltip also shows the number of threads, and the system tile of the dashboard and the System page of the fullscreen screen show the counts. FPS (experimental) measures the frame rate of the foreground program, like PresentMon: an ETW session listens to the DirectX Present events (DXGI/D3D9, with DxgKrnl for Vulkan among others) and counts them per process (only process id and timestamp, no content). It is off by default, needs administrator rights, costs a little CPU while it is on, and only shows a value while a program is drawing frames (games, video players, browsers); the tooltip also names the 1% low and the program.
Extra items for the widget: CPU clock frequency, disk busy (%), disk temperature and motherboard temperature. The last two read sensors through LibreHardwareMonitor (administrator required) and disappear automatically when there is no value.
Graph as a display style (length very short, short, medium, long or custom in pixels; period 30/60/120 s): CPU, GPU, memory, temperatures, network (download and upload as two lines, scale automatic or fixed) and ping can be shown as a mini history graph in the widget (last 30, 60 or 120 seconds). Missing pings (no reply) interrupt the line with a red dot.
Length per graph: every graph in the widget can have its own length, for example the network wide, the CPU very short and the memory at 100 px. Under Settings → Widget → Advanced → Graph length per item you choose per item Default (follows the general length), Tiny, Short, Medium, Long or Custom with your own width from 16 to 160 px. The choice belongs to the theme and is saved immediately.
Background image: per window (widget, dashboard and fullscreen; Settings, tabs Widget, Dashboard and Fullscreen) choose a png/jpg/bmp with mode Fill, Stretch, Fit, Tile or Center and an opacity of 0–100%. The image goes under the text and tiles; if the file is missing, the normal background applies. Paths are not part of themes.
Follow the Windows theme (widget, Settings → Colors): Dark/light picks a dark or light background with automatically readable text; Dark/light + accent also uses the Windows accent color for gauges and bars. Switching the Windows theme is followed immediately.
Mouse actions and click-through (Settings → General): choose what a double-click and the middle mouse button do (Task Manager, dashboard, fullscreen, settings, usage log, copy info, menu or nothing). Ctrl+Alt+W (or the icon by the clock) lets clicks fall through the widget.
More notifications: thresholds for CPU, GPU and disk temperature, memory usage and network usage per day (0 = off).
Update check (optional, off by default): at most once every 24 hours it checks via GitHub whether a newer version exists; that is only reported (menu item and notification), nothing is ever downloaded or installed.
Sensors (LibreHardwareMonitor, only active while the fullscreen screen is open): CPU power, temperatures and clocks, GPU temperature/power/clock/fan per card, disk temperature and health (SMART), motherboard and fans, memory and battery. Administrator rights are needed for CPU, motherboard and disks (the app already requests them); without those rights the screen shows the sensors that are available (GPU, memory, battery) and a short explanation.
Dashboard and Fullscreen have the same structure with three subtabs: Window, Components and layout (with a thumbnail of the layout; the dashboard also has the number of columns there) and Background. The Widget tab also calls its first subtab Components and layout.
Order and items: in the settings window (tab Dashboard or Fullscreen) you turn the main items (CPU, GPU, memory, network, disks, battery, heaviest programs, system) on or off and move them with the arrow buttons. The desktop dashboard fills its columns in that order; the fullscreen screen fills rows of four columns (CPU is two wide; battery and system share a cell) and adjusts the width.
Languages: the app is available in Dutch, English and German; on first start it follows the Windows language if available (also regional languages such as pt-br, which supplement pt). Texts are not in the code but in lang/<code>.json (embedded in the exe): the English source text on the left, the translation on the right. An empty field means "not translated yet" and shows English. The tools\LangTool utility actually parses the code (Roslyn) and checks on every build that everything is consistent: an error in a language file makes the build fail, missing translations are warnings.
Adding a language (for example French):
dotnet run --project tools\LangTool -c Release -- new fr "Français" --culture fr-FR
- This creates
lang/fr.jsonwith all texts empty. Fill in the values on the right; the keys on the left and the placeholders ({0},{1}) stay as they are;@@…after a key is context only. - Plurals (
"{0} day|{0} days"): give as many forms, separated by|, as the_pluralrule of your language requires (one-otheris the default;zero-or-one-otherfor French and Brazilian Portuguese,one-few-many-otherfor Polish and Russian,otherfor Japanese and Chinese). - Check:
dotnet run --project tools\LangTool -c Release -- check(errors: broken placeholders, duplicate keys, wrong number of plural forms, leading or trailing spaces that do not match).statusshows what percentage of each language is done. - Try it without building: put the file in
%AppData%\TaskbarStats\lang\and restart the app; the language then appears under Settings → General. A file there also overrides a built-in language. - Want to see what is still untranslated or comes out too long? Start the app with the environment variable
TASKBARSTATS_PSEUDO=1and choose the language Pseudo (test): every text then appears with accents and 30% longer between brackets, so untranslated or truncated text stands out immediately. - Share your translation via a pull request (
lang/fr.json).
For anyone changing the code: use only Loc.T("fixed text"), Loc.T("text {0}", value) and Loc.P("{0} day|{0} days", n); then run LangTool sync (prepares new texts in all languages) and translate the empty values. To change an English text: LangTool rename "old" "new" (updates the code and all language files). LangTool also reports texts that are hard-coded in the code.
Themes: a theme is a small JSON file with style, colors, font, height, and dashboard and fullscreen layout (no positions or language). Your own themes are in %AppData%\TaskbarStats\themes\ and can be shared: export a theme and pass on the file, the other person imports it. Under Settings → Themes you see the JSON in an editor for the selected theme: edit it by hand and choose Save JSON (if the JSON has an error you get a message with line and position). You can also modify a bundled theme this way: it is then stored on disk as your own file with the same name and takes precedence over the bundled one (built-in, edited); Reset to original removes that file again. With Preview (10 s) you see the selected theme (or the JSON in the editor, even if you have not saved it yet) for 10 seconds on the widget, dashboard and fullscreen; during the preview the values go up and down (from low to warning and critical) and the display changes every 2 s: first the theme itself, then numbers, gauge, bar and graph, so you see in one go how the theme looks in all styles (no notifications appear then). Afterwards everything returns automatically as it was (clicking again stops earlier).
Everything you copy or export (info to the clipboard, system information, diagnostics, export files of themes, settings and the usage CSV) is marked by the program with the link to this page, so the recipient knows where it came from; in the JSON files this is a _generator field that is ignored on import.
Copy system information: on the specifications page of the fullscreen screen (key I) there is a button Copy all (or key C), and in the right-click menu Copy system information: all specifications (computer, operating system, processor, memory, graphics card, disks, network, …) as plain text on the clipboard, handy for a support request or forum post.
Network drives (mapped drives) are included via Settings → Widget → Sources → Include network drives (also in dashboard and fullscreen); they are queried in the
background, so an unreachable share does not slow the app down. Because the app runs as administrator and Windows then does not see the drive letters of
your normal session, the app reads the mappings from the registry (HKCU\Network) and requests the space via the UNC path.
Settings
Stored in %AppData%\TaskbarStats\settings.json (survives rebuilds and
reinstalls). Changes in the settings are saved immediately. You can also edit these by hand:
FontFamily, FontSize, WidgetHeight, TrayGap, colors and thresholds.
Backup and portable: under Settings → General → Backup you export all settings to a single JSON file, import them again (for example on another PC) or reset everything to the defaults (themes and the usage log remain). For portable use (for example on a USB stick) create an empty file portable.txt next to TaskbarStats.exe: settings, themes, language files and logs are then in the data folder next to it and nothing is written to %AppData%.
When something goes wrong: errors are recorded in diag.log in the data folder (only on your own PC, nothing is sent). An error in a timer or drawing routine lets the app keep running; a fatal error on a background thread restarts the app once. In About TaskbarStats the Copy diagnostics button copies version, Windows, screens and the last log lines (without user or computer name) to paste into a bug report. Crash notice: if the app crashed last time, it says so at the next start with a balloon notification (click it for the About screen with Copy diagnostics). A crash is recognized by the flag of the error safety net, or, for a hard crash, by an "Application Error" in the Windows event log (with the error code in diag.log). Closing via Task Manager or a power failure is only noted in the log, not reported as a crash. If you start the app a second time, the running app opens its settings.
Transparent background
The window is a layered window with per-pixel alpha. With "transparent" the
background is drawn with alpha 1: invisible, but still clickable. (A
TransparencyKey let clicks on the transparent parts fall through to the window underneath,
so the right-click menu sometimes did not appear.)
Administrator rights
The app requests administrator rights (via app.manifest). This is needed for the
temperature sensors (LibreHardwareMonitorLib). If you do not need those, you may set requestedExecutionLevel
in app.manifest to asInvoker; temperature then does not work.
Starting automatically with Windows
Use "Start with Windows" in the settings (General tab), or the option in the installer. This creates a scheduled "at log on" task with highest privileges, so there is no UAC prompt.
Code overview
| File | Role |
|---|---|
src/Program.cs | Entry point, single-instance mutex, --autostart-on/off for the installer. |
src/WidgetForm.cs | The taskbar widget: drawing to an ARGB bitmap (UpdateLayeredWindow), mouse, menu, tooltip, notifications, hotkeys, sampler thread. |
src/Metrics.cs | Performance counters (PDH wildcard for GPU), memory, battery, temperature, DXGI GPU names. |
src/DashboardForm.cs | Desktop dashboard + MetricHistory/Ring (graph history) and DashContext. |
src/FullscreenForm.cs | Fullscreen "cockpit": dense overview, detail views per tile, specifications page and automatic tour. |
src/HardwareInfo.cs | Hardware inventory (WMI etc.), collected once asynchronously for the specifications page. |
src/PingMonitor.cs | Ping measurement on its own thread (last, min/avg/max, jitter, loss). |
src/UsageTracker.cs | Network usage per adapter and per day (usage.json), thread-safe. |
src/ProcessSampler.cs | Heaviest processes (sampled asynchronously). |
src/AppSettings.cs | Settings (JSON). |
src/TaskbarHost.cs | Finds the position of the notification area/taskbar. |
src/StartupManager.cs | Autostart via a scheduled task (highest privileges). |
src/SettingsForm.cs, src/Themes.cs, src/Tiles.cs | Settings window with tabs (applied live), themes (bundled + own JSON files), item ids/order. |
src/LogForm.cs | Window with the usage log. |
src/WelcomeForm.cs, src/AboutForm.cs | Welcome screen and About window. |
src/Loc.cs, lang/*.json | Translations: Loc.T("English text"), Loc.P (plurals) with one JSON file per language (see Languages). |
tools/LangTool | Checks, synchronizes and renames the language texts (Roslyn); runs on every build. |
src/Diag.cs, src/AppPaths.cs | Log file, crash safety net, diagnostics report; where the data lives (%AppData%, TASKBARSTATS_DATA or portable). |
tests/TaskbarStats.Tests | Automated tests (xUnit); dotnet test tests\TaskbarStats.Tests -c Release. |
Performance and threads
The UI thread only does drawing and menus; the heavy work happens elsewhere:
- A sampler thread reads the measurements (
Metrics.Update) and tracks usage (UsageTracker.Sample); the UI draws with the latest values. Shared data is thread-safe (locked or replaced atomically). - GPU, network and CPU cores go through a single PDH query with a wildcard per counter (e.g.
\GPU Engine(*)\Utilization Percentage), not through separatePerformanceCounterobjects (GPU cost 150–780 ms per tick; the network went from ~39 to ~7 ms). - Frugal: with a hidden widget and no dashboard/fullscreen, it only measures every 5 s, usage is updated every 5 s, the working set is regularly returned to Windows and the runtime runs without an extra GC thread. Measured at rest: ~2% of one core and ~60 MB working set (was ~2–5% and ~93 MB).
- The widget is not put back on top every 200 ms (
SetWindowPoson a taskbar window can block 100+ ms); that only happens when another visible topmost window is really on top of it. - Sampling programs (
ProcessSampler.SampleAsync) and network drives (DriveInfo) run in the background.
License and credits
MIT license (see LICENSE): you may freely use, modify and share TaskbarStats, including in your own projects. The only condition is that the copyright line and the license text are kept — so please leave the credits in place. Thanks!
The program uses LibreHardwareMonitorLib (MPL-2.0), HidSharp (Apache-2.0) and .NET (MIT); these fall under their own licenses.
Contact
Questions, ideas or just want to say hi? Find me on LinkedIn or Facebook, or open an issue here.
Similar repos
Contributors
99 commits
Languages
C#
99.0%