
See what people are saying
README
Devbits Ollama Bench
A small, dependency-free CLI for benchmarking local Ollama models without turning the process into a spreadsheet project.
Devbits Ollama Bench focuses on the things that matter when you actually use a local model: time to first token, prompt processing, decode speed, context size, consistency, and memory pressure. It provides a few opinionated benchmark modes for quick checks, everyday workloads, and large-context testing, then writes the results to Markdown and JSON so you can keep or compare them later.
It is a single Python file, uses only the standard library, and talks directly to your local Ollama API. It does not download models automatically.
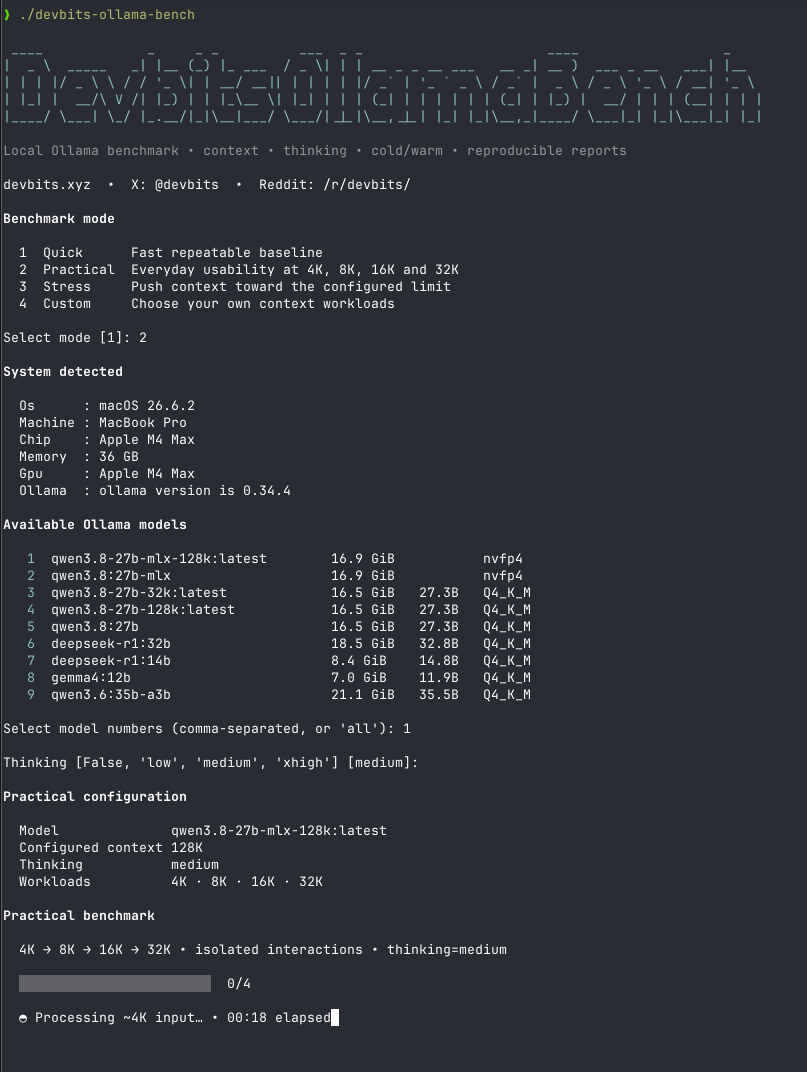
What you get
- Quick — a fast, repeatable baseline with cold, warmup, and measured runs.
- Practical — isolated 4K, 8K, 16K, and 32K interactions for a more realistic view of everyday context performance.
- Stress — pushes context toward the configured limit with isolated integrity and decode workloads, while watching for memory pressure.
- Custom — lets you choose your own context windows and workload sizes; each workload is one isolated interaction.
- Thinking control — use the thinking level supported by the selected model.
- Hardware-aware output — reports the detected machine and memory information available on the platform.
- Reproducible reports — every completed run writes both Markdown and JSON results.
- Built-in UI demos — preview the terminal experience without making Ollama inference requests.
Requirements
- Python 3
- Ollama installed and available as
ollama - A local Ollama model to benchmark
- Ollama's local API available at
http://localhost:11434
No Python packages need to be installed.
Run it
Make the script executable:
chmod +x devbits-ollama-bench
Then launch the interactive flow:
./devbits-ollama-bench
Choose a benchmark mode, select one or more local models, choose the context/thinking options when applicable, and the benchmark will guide you from there.
You can also select the same modes directly with flags:
./devbits-ollama-bench --mode quick
./devbits-ollama-bench --mode practical
./devbits-ollama-bench --mode stress
./devbits-ollama-bench --mode custom
Run ./devbits-ollama-bench --help for the complete option list, or ./devbits-ollama-bench --version to print the release version.
Custom workloads
Custom mode is useful when you want to answer a specific question such as, “How does this model behave around 64K or 128K on my machine?”
./devbits-ollama-bench --mode custom --models my-model --contexts 64k,128k --thinking medium
By default, Custom targets roughly 90% of each selected context window, leaving 10% headroom. You can provide an explicit target with --fill:
./devbits-ollama-bench --mode custom --models my-model --contexts 128k --fill 96k --thinking medium
Large contexts can consume substantial memory and take a long time to prefill. The CLI shows an advisory before potentially expensive runs and does not silently lower the context you requested.
Preview the UI without benchmarking
The demo mode is handy for seeing how a run behaves without waiting for inference:
./devbits-ollama-bench --demo quick
./devbits-ollama-bench --demo practical
./devbits-ollama-bench --demo stress
./devbits-ollama-bench --demo custom
For screenshot-friendly playback:
./devbits-ollama-bench --demo stress-pressure --demo-speed step
--demo-speed accepts normal, slow, or step. Demo mode does not make Ollama inference requests.
Understanding the results
The main measurements are intentionally straightforward:
| Metric | Meaning |
|---|---|
| TTFT | Time to first generated token. |
| Prompt | Prompt/prefill processing speed in tokens per second. |
| Decode | Generated-output speed in tokens per second. |
| Context / CTX | Configured maximum context window. |
| Fill | Approximate synthetic occupied-context target. |
| Load | Model load/setup time reported by Ollama. |
| Total | End-to-end request duration. |
Memory snapshots are taken around benchmark requests where applicable. On macOS, free memory by itself is only part of the story, so the report also uses swap and compressed-memory information to make pressure easier to spot.
Reports
Completed benchmarks write timestamped files in the current directory:
devbits-ollama-bench-YYYYMMDD-HHMMSS.md
devbits-ollama-bench-YYYYMMDD-HHMMSS.json
The Markdown file is meant to be easy to read or share. The JSON file keeps the structured measurements for later analysis, comparisons, or tooling.
A note on benchmark numbers
Local-model performance depends on much more than the model name: hardware, quantization, runtime, configured context, thinking mode, memory pressure, caching, and workload shape can all change the result.
That is why Devbits Ollama Bench records the environment and tries to keep benchmark behavior explicit. The numbers are most useful when you compare runs with the same protocol and understand what changed between them.
Project
Built by Devbits for people experimenting with local models and trying to answer the very practical question: how well does this model actually run on my machine?
- Website: https://devbits.xyz
- X: @devbits
- Reddit: r/devbits
Contributions, bug reports, and benchmark findings are welcome.
License
MIT. See LICENSE.
Similar repos





Languages
Python
100.0%
See what people are saying
README
Devbits Ollama Bench
A small, dependency-free CLI for benchmarking local Ollama models without turning the process into a spreadsheet project.
Devbits Ollama Bench focuses on the things that matter when you actually use a local model: time to first token, prompt processing, decode speed, context size, consistency, and memory pressure. It provides a few opinionated benchmark modes for quick checks, everyday workloads, and large-context testing, then writes the results to Markdown and JSON so you can keep or compare them later.
It is a single Python file, uses only the standard library, and talks directly to your local Ollama API. It does not download models automatically.
What you get
- Quick — a fast, repeatable baseline with cold, warmup, and measured runs.
- Practical — isolated 4K, 8K, 16K, and 32K interactions for a more realistic view of everyday context performance.
- Stress — pushes context toward the configured limit with isolated integrity and decode workloads, while watching for memory pressure.
- Custom — lets you choose your own context windows and workload sizes; each workload is one isolated interaction.
- Thinking control — use the thinking level supported by the selected model.
- Hardware-aware output — reports the detected machine and memory information available on the platform.
- Reproducible reports — every completed run writes both Markdown and JSON results.
- Built-in UI demos — preview the terminal experience without making Ollama inference requests.
Requirements
- Python 3
- Ollama installed and available as
ollama - A local Ollama model to benchmark
- Ollama's local API available at
http://localhost:11434
No Python packages need to be installed.
Run it
Make the script executable:
chmod +x devbits-ollama-bench
Then launch the interactive flow:
./devbits-ollama-bench
Choose a benchmark mode, select one or more local models, choose the context/thinking options when applicable, and the benchmark will guide you from there.
You can also select the same modes directly with flags:
./devbits-ollama-bench --mode quick
./devbits-ollama-bench --mode practical
./devbits-ollama-bench --mode stress
./devbits-ollama-bench --mode custom
Run ./devbits-ollama-bench --help for the complete option list, or ./devbits-ollama-bench --version to print the release version.
Custom workloads
Custom mode is useful when you want to answer a specific question such as, “How does this model behave around 64K or 128K on my machine?”
./devbits-ollama-bench --mode custom --models my-model --contexts 64k,128k --thinking medium
By default, Custom targets roughly 90% of each selected context window, leaving 10% headroom. You can provide an explicit target with --fill:
./devbits-ollama-bench --mode custom --models my-model --contexts 128k --fill 96k --thinking medium
Large contexts can consume substantial memory and take a long time to prefill. The CLI shows an advisory before potentially expensive runs and does not silently lower the context you requested.
Preview the UI without benchmarking
The demo mode is handy for seeing how a run behaves without waiting for inference:
./devbits-ollama-bench --demo quick
./devbits-ollama-bench --demo practical
./devbits-ollama-bench --demo stress
./devbits-ollama-bench --demo custom
For screenshot-friendly playback:
./devbits-ollama-bench --demo stress-pressure --demo-speed step
--demo-speed accepts normal, slow, or step. Demo mode does not make Ollama inference requests.
Understanding the results
The main measurements are intentionally straightforward:
| Metric | Meaning |
|---|---|
| TTFT | Time to first generated token. |
| Prompt | Prompt/prefill processing speed in tokens per second. |
| Decode | Generated-output speed in tokens per second. |
| Context / CTX | Configured maximum context window. |
| Fill | Approximate synthetic occupied-context target. |
| Load | Model load/setup time reported by Ollama. |
| Total | End-to-end request duration. |
Memory snapshots are taken around benchmark requests where applicable. On macOS, free memory by itself is only part of the story, so the report also uses swap and compressed-memory information to make pressure easier to spot.
Reports
Completed benchmarks write timestamped files in the current directory:
devbits-ollama-bench-YYYYMMDD-HHMMSS.md
devbits-ollama-bench-YYYYMMDD-HHMMSS.json
The Markdown file is meant to be easy to read or share. The JSON file keeps the structured measurements for later analysis, comparisons, or tooling.
A note on benchmark numbers
Local-model performance depends on much more than the model name: hardware, quantization, runtime, configured context, thinking mode, memory pressure, caching, and workload shape can all change the result.
That is why Devbits Ollama Bench records the environment and tries to keep benchmark behavior explicit. The numbers are most useful when you compare runs with the same protocol and understand what changed between them.
Project
Built by Devbits for people experimenting with local models and trying to answer the very practical question: how well does this model actually run on my machine?
- Website: https://devbits.xyz
- X: @devbits
- Reddit: r/devbits
Contributions, bug reports, and benchmark findings are welcome.
License
MIT. See LICENSE.
Similar repos
Languages
Python
100.0%