WebGL Globe is a platform for visualizing latitude longitude based information using WebGL.
See the codeThe WebGL Globe is an open platform for geographic data visualization created by the Google Data Arts Team. We encourage you to copy the code, add your own data, and create your own globes.
Check out the examples at https://experiments.withgoogle.com/chrome/globe, and if you create a globe, please share it with us. We post our favorite globes publicly.
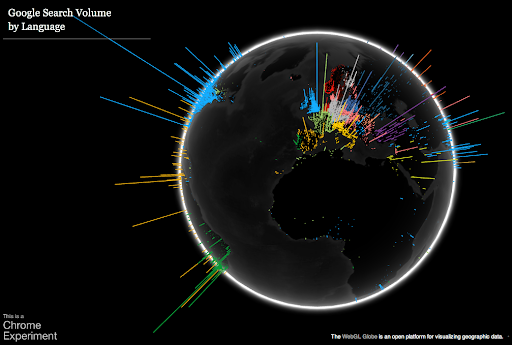
The WebGL Globe supports data in JSON format, a sample of which you can find here. webgl-globe makes heavy use of the Three.js library.
The following illustrates the JSON data format that the globe expects:
var data = [
    [
    'seriesA', [ latitude, longitude, magnitude, latitude, longitude, magnitude, ... ]
    ],
    [
    'seriesB', [ latitude, longitude, magnitude, latitude, longitude, magnitude, ... ]
    ]
];
The following code polls a JSON file (formatted like the one above) for geo-data and adds it to an animated, interactive WebGL globe.
// Where to put the globe?
var container = document.getElementById( 'container' );

// Make the globe
var globe = new DAT.Globe( container );

// We're going to ask a file for the JSON data.
var xhr = new XMLHttpRequest();

// Where do we get the data?
xhr.open( 'GET', 'myjson.json', true );

// What do we do when we have it?
xhr.onreadystatechange = function() {

    // If we've received the data
    if ( xhr.readyState === 4 && xhr.status === 200 ) {

        // Parse the JSON
        var data = JSON.parse( xhr.responseText );

        // Tell the globe about your JSON data
        for ( var i = 0; i < data.length; i ++ ) {
            globe.addData( data[i][1], {format: 'magnitude', name: data[i][0]} );
        }

        // Create the geometry
        globe.createPoints();

        // Begin animation
        globe.animate();

    }

};

// Begin request
xhr.send( null );
5,103 followers · starred Jul 2017
25,042 followers · starred Jul 2016
487 followers · starred Jan 2016
2,922 followers · starred Jan 2015
WebGL Globe is a platform for visualizing latitude longitude based information using WebGL.
See the codeThe WebGL Globe is an open platform for geographic data visualization created by the Google Data Arts Team. We encourage you to copy the code, add your own data, and create your own globes.
Check out the examples at https://experiments.withgoogle.com/chrome/globe, and if you create a globe, please share it with us. We post our favorite globes publicly.
The WebGL Globe supports data in JSON format, a sample of which you can find here. webgl-globe makes heavy use of the Three.js library.
The following illustrates the JSON data format that the globe expects:
var data = [
    [
    'seriesA', [ latitude, longitude, magnitude, latitude, longitude, magnitude, ... ]
    ],
    [
    'seriesB', [ latitude, longitude, magnitude, latitude, longitude, magnitude, ... ]
    ]
];
The following code polls a JSON file (formatted like the one above) for geo-data and adds it to an animated, interactive WebGL globe.
// Where to put the globe?
var container = document.getElementById( 'container' );

// Make the globe
var globe = new DAT.Globe( container );

// We're going to ask a file for the JSON data.
var xhr = new XMLHttpRequest();

// Where do we get the data?
xhr.open( 'GET', 'myjson.json', true );

// What do we do when we have it?
xhr.onreadystatechange = function() {

    // If we've received the data
    if ( xhr.readyState === 4 && xhr.status === 200 ) {

        // Parse the JSON
        var data = JSON.parse( xhr.responseText );

        // Tell the globe about your JSON data
        for ( var i = 0; i < data.length; i ++ ) {
            globe.addData( data[i][1], {format: 'magnitude', name: data[i][0]} );
        }

        // Create the geometry
        globe.createPoints();

        // Begin animation
        globe.animate();

    }

};

// Begin request
xhr.send( null );
5,103 followers · starred Jul 2017
25,042 followers · starred Jul 2016
487 followers · starred Jan 2016
2,922 followers · starred Jan 2015



