
Open source, self-hosted alternative to Power BI and Looker Studio: semantic model, drag-and-drop reports, AI assistant. One Docker container.
See the codeSee what people are saying
README
Open Report




Free and open source under AGPL-3.0. Self-host it, fork it, use it at work.
Superset too complicated? Metabase too limited? Power BI not open source? That's why I built Open Report.
An open source, self-hosted reporting and data visualization platform, easy to run and easy to configure. Point it at your database, describe your tables once (joins, dimensions, measures), then build interactive dashboards on a drag-and-drop canvas. It compiles the SQL for you, in your dialect, against your data. Nothing leaves your infrastructure.
Think Power BI / Looker Studio, but open source and self-hosted.
With an AI assistant that never touches your live data. Ask a question in any language and get a chart, or ask it to lay out a page, join the tables of a new model or explain a feature. It reads only Open Report's pre-aggregated cache, never your database, and works with Anthropic or any OpenAI-compatible server, a local one included. It proposes, you apply.
🧪 Still in development: we are looking for testers. Read more.
Website · Quick start · Screenshots · How it compares · Changelog
Quick start
One container, plain HTTP on port 3001, built for amd64 and arm64:
mkdir openreport && cd openreport
curl -fsSL https://raw.githubusercontent.com/cracky777/openreport/master/docker-compose.yml -o docker-compose.yml
printf 'SESSION_SECRET=%s\nINTERNAL_TOKEN_SECRET=%s\nDATASOURCE_ENC_KEY=%s\n' \
  $(openssl rand -hex 32) $(openssl rand -hex 32) $(openssl rand -hex 32) > .env
docker compose up -d
Open http://localhost:3001 and sign up: the first account becomes the admin. A guided tour and the assistant's Help tab take it from there.
Data, secrets, upgrades and reverse proxies
Everything lives in the openreport-data volume (SQLite metadata, uploads, caches). The three secrets in
.env are mandatory, and DATASOURCE_ENC_KEY encrypts your database passwords, so back it up with the
volume. Upgrade with docker compose pull && docker compose up -d.
- Behind your own reverse proxy (Caddy, Traefik, Nginx Proxy Manager): point it at port 3001 and forward
X-Forwarded-Proto. The session cookie gets itsSecureflag from that header, so plain HTTP on the LAN and HTTPS through the proxy both work with the same image. - Public host with TLS built in: the same
docker-compose.ymlalso bundles nginx and a Let's Encrypt certificate, behind thehttpsprofile. Clone the repository, addCOMPOSE_PROFILES=httpsto.envand follow the comments at the top of the file.
From source, without Docker
Prerequisites: Node.js >= 22 (an older one is refused with an EBADENGINE error, because DuckDB cannot be
built on it) and npm >= 9.
git clone https://github.com/cracky777/openreport.git open-report
cd open-report
./install.sh
npm run dev
install.sh settles the Node version first: it installs Node 22 through nvm, under your own home directory
and without sudo, when the one on your PATH is missing or too old, then installs every dependency. Set
OPENREPORT_SKIP_NODE=1 to manage Node yourself. On Windows, or to do it by hand: install Node 22, then
npm run install:all.
npm run dev serves the frontend on http://localhost:5173 and the API on http://localhost:3001. For a
production process without Docker, build the client with npm run build and run npm start: the server
then serves the built frontend itself on port 3001, with the same environment variables as the Docker image
(see .env.example).
Screenshots
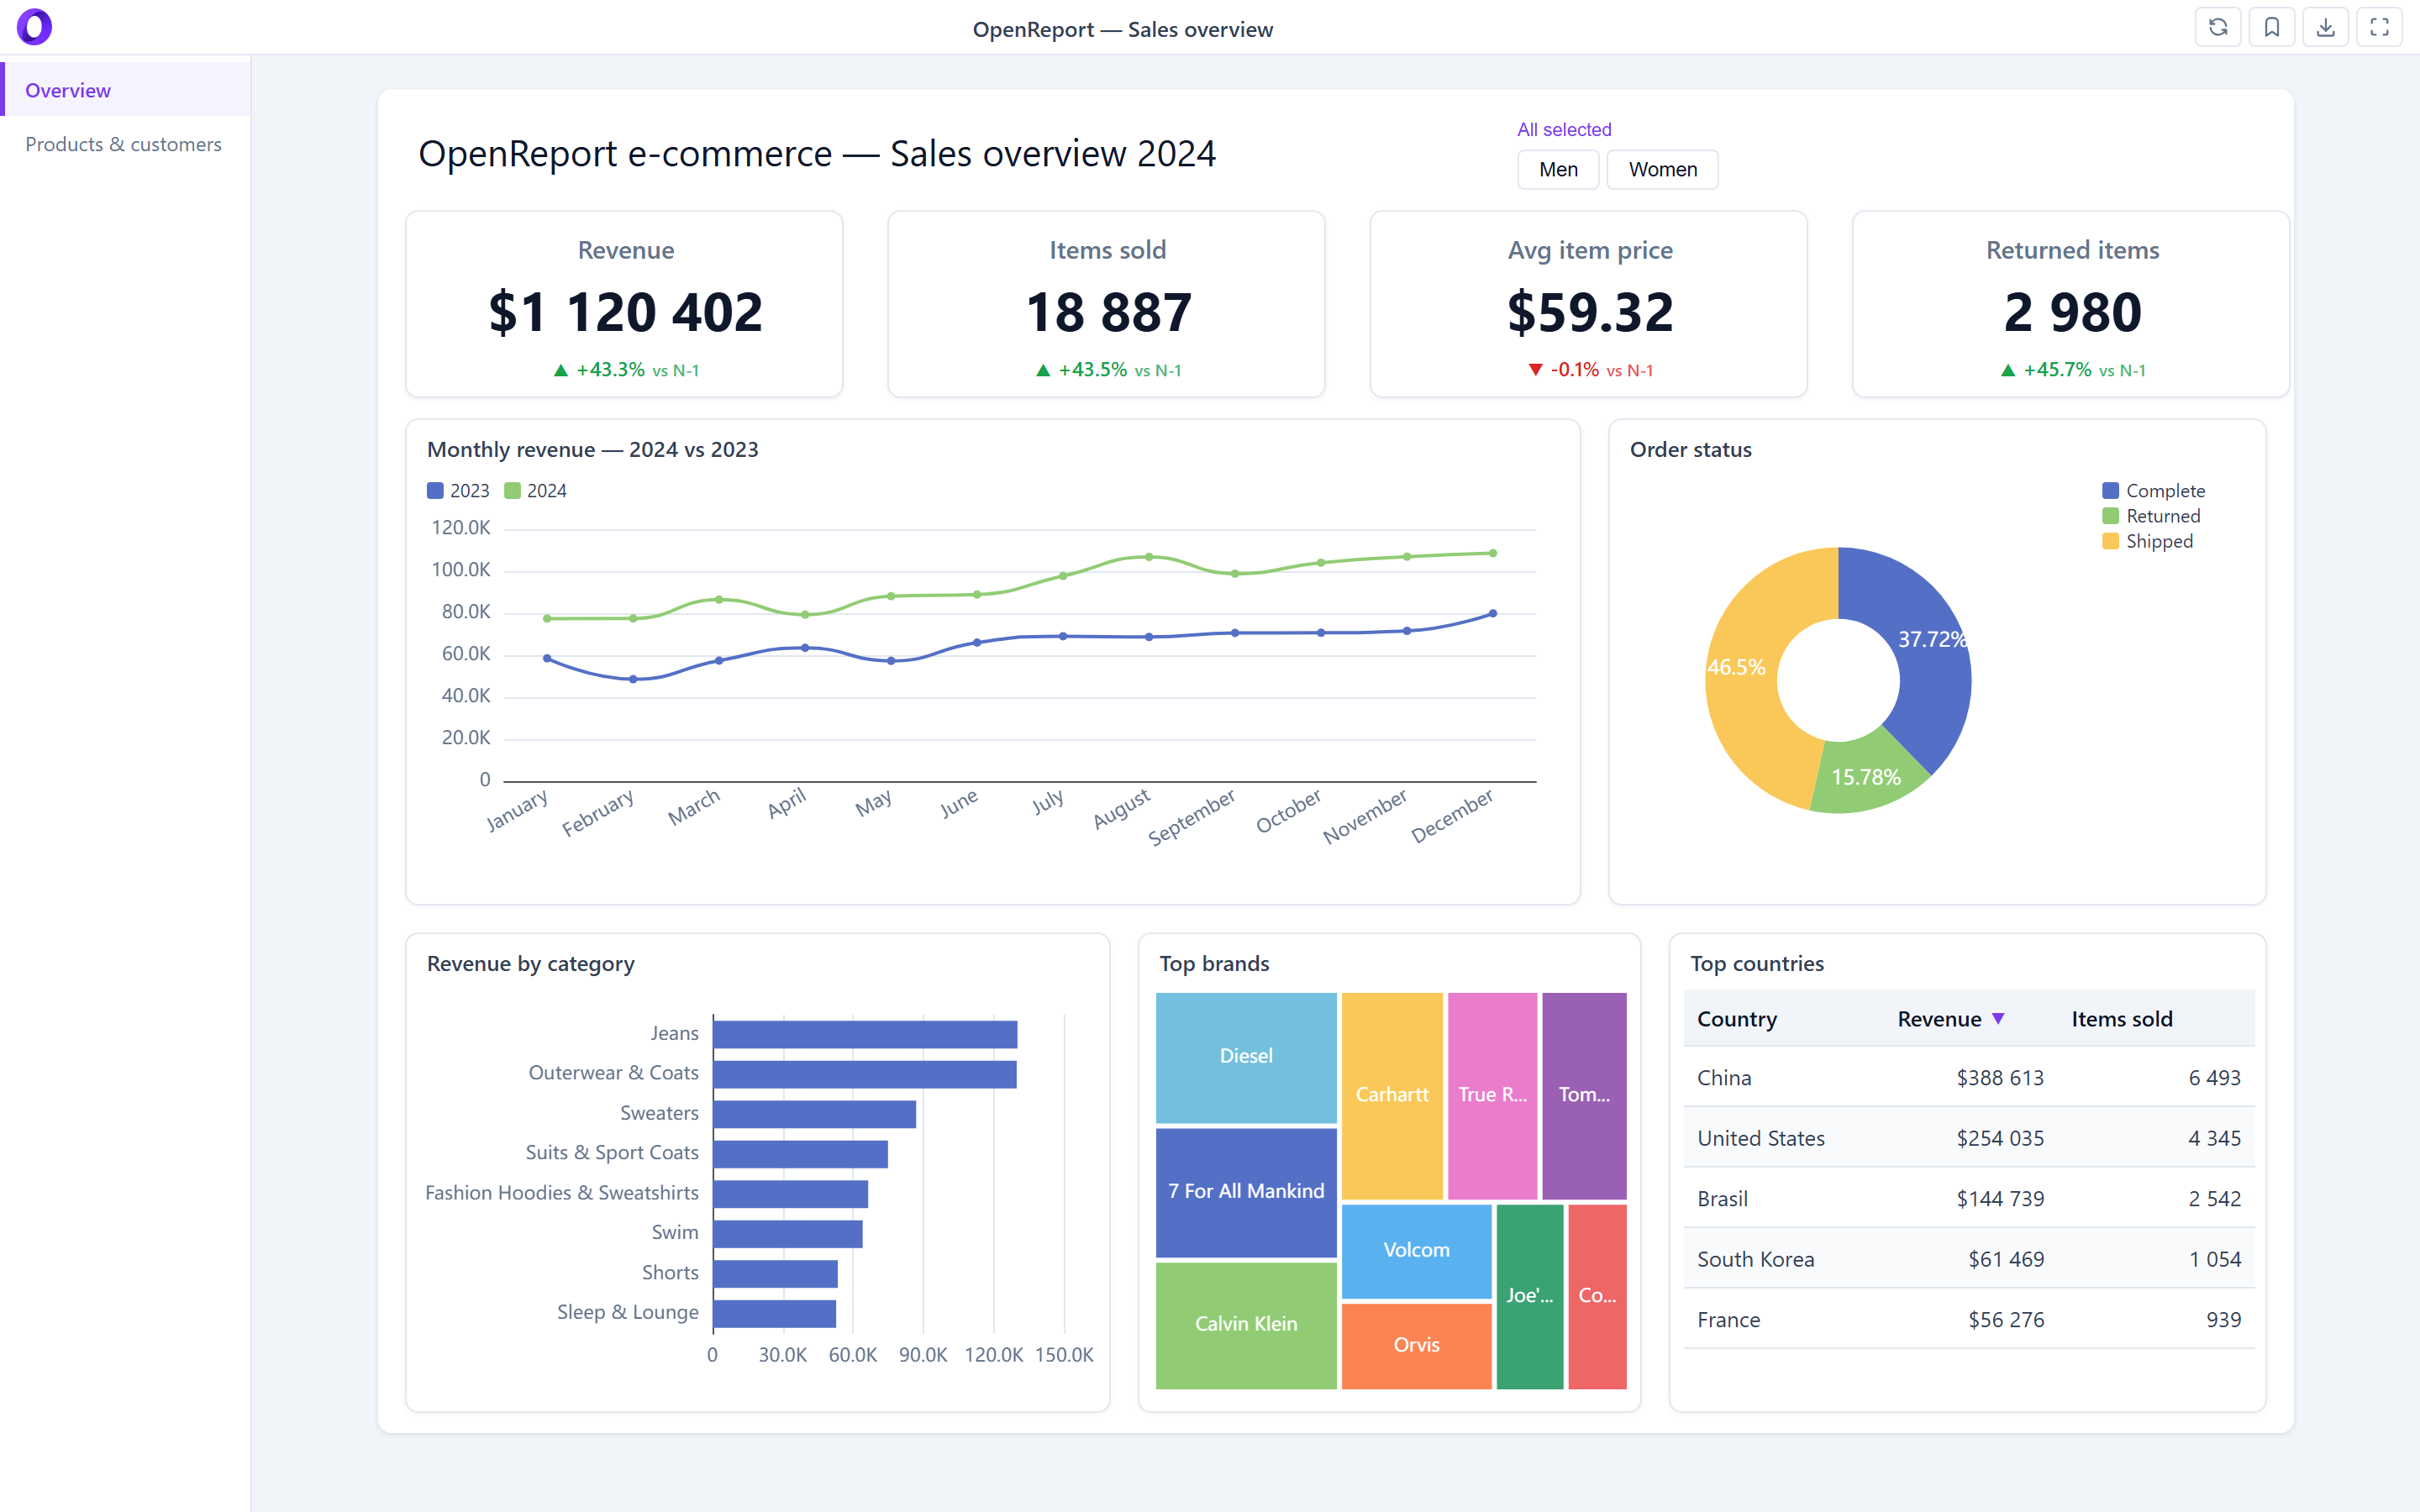
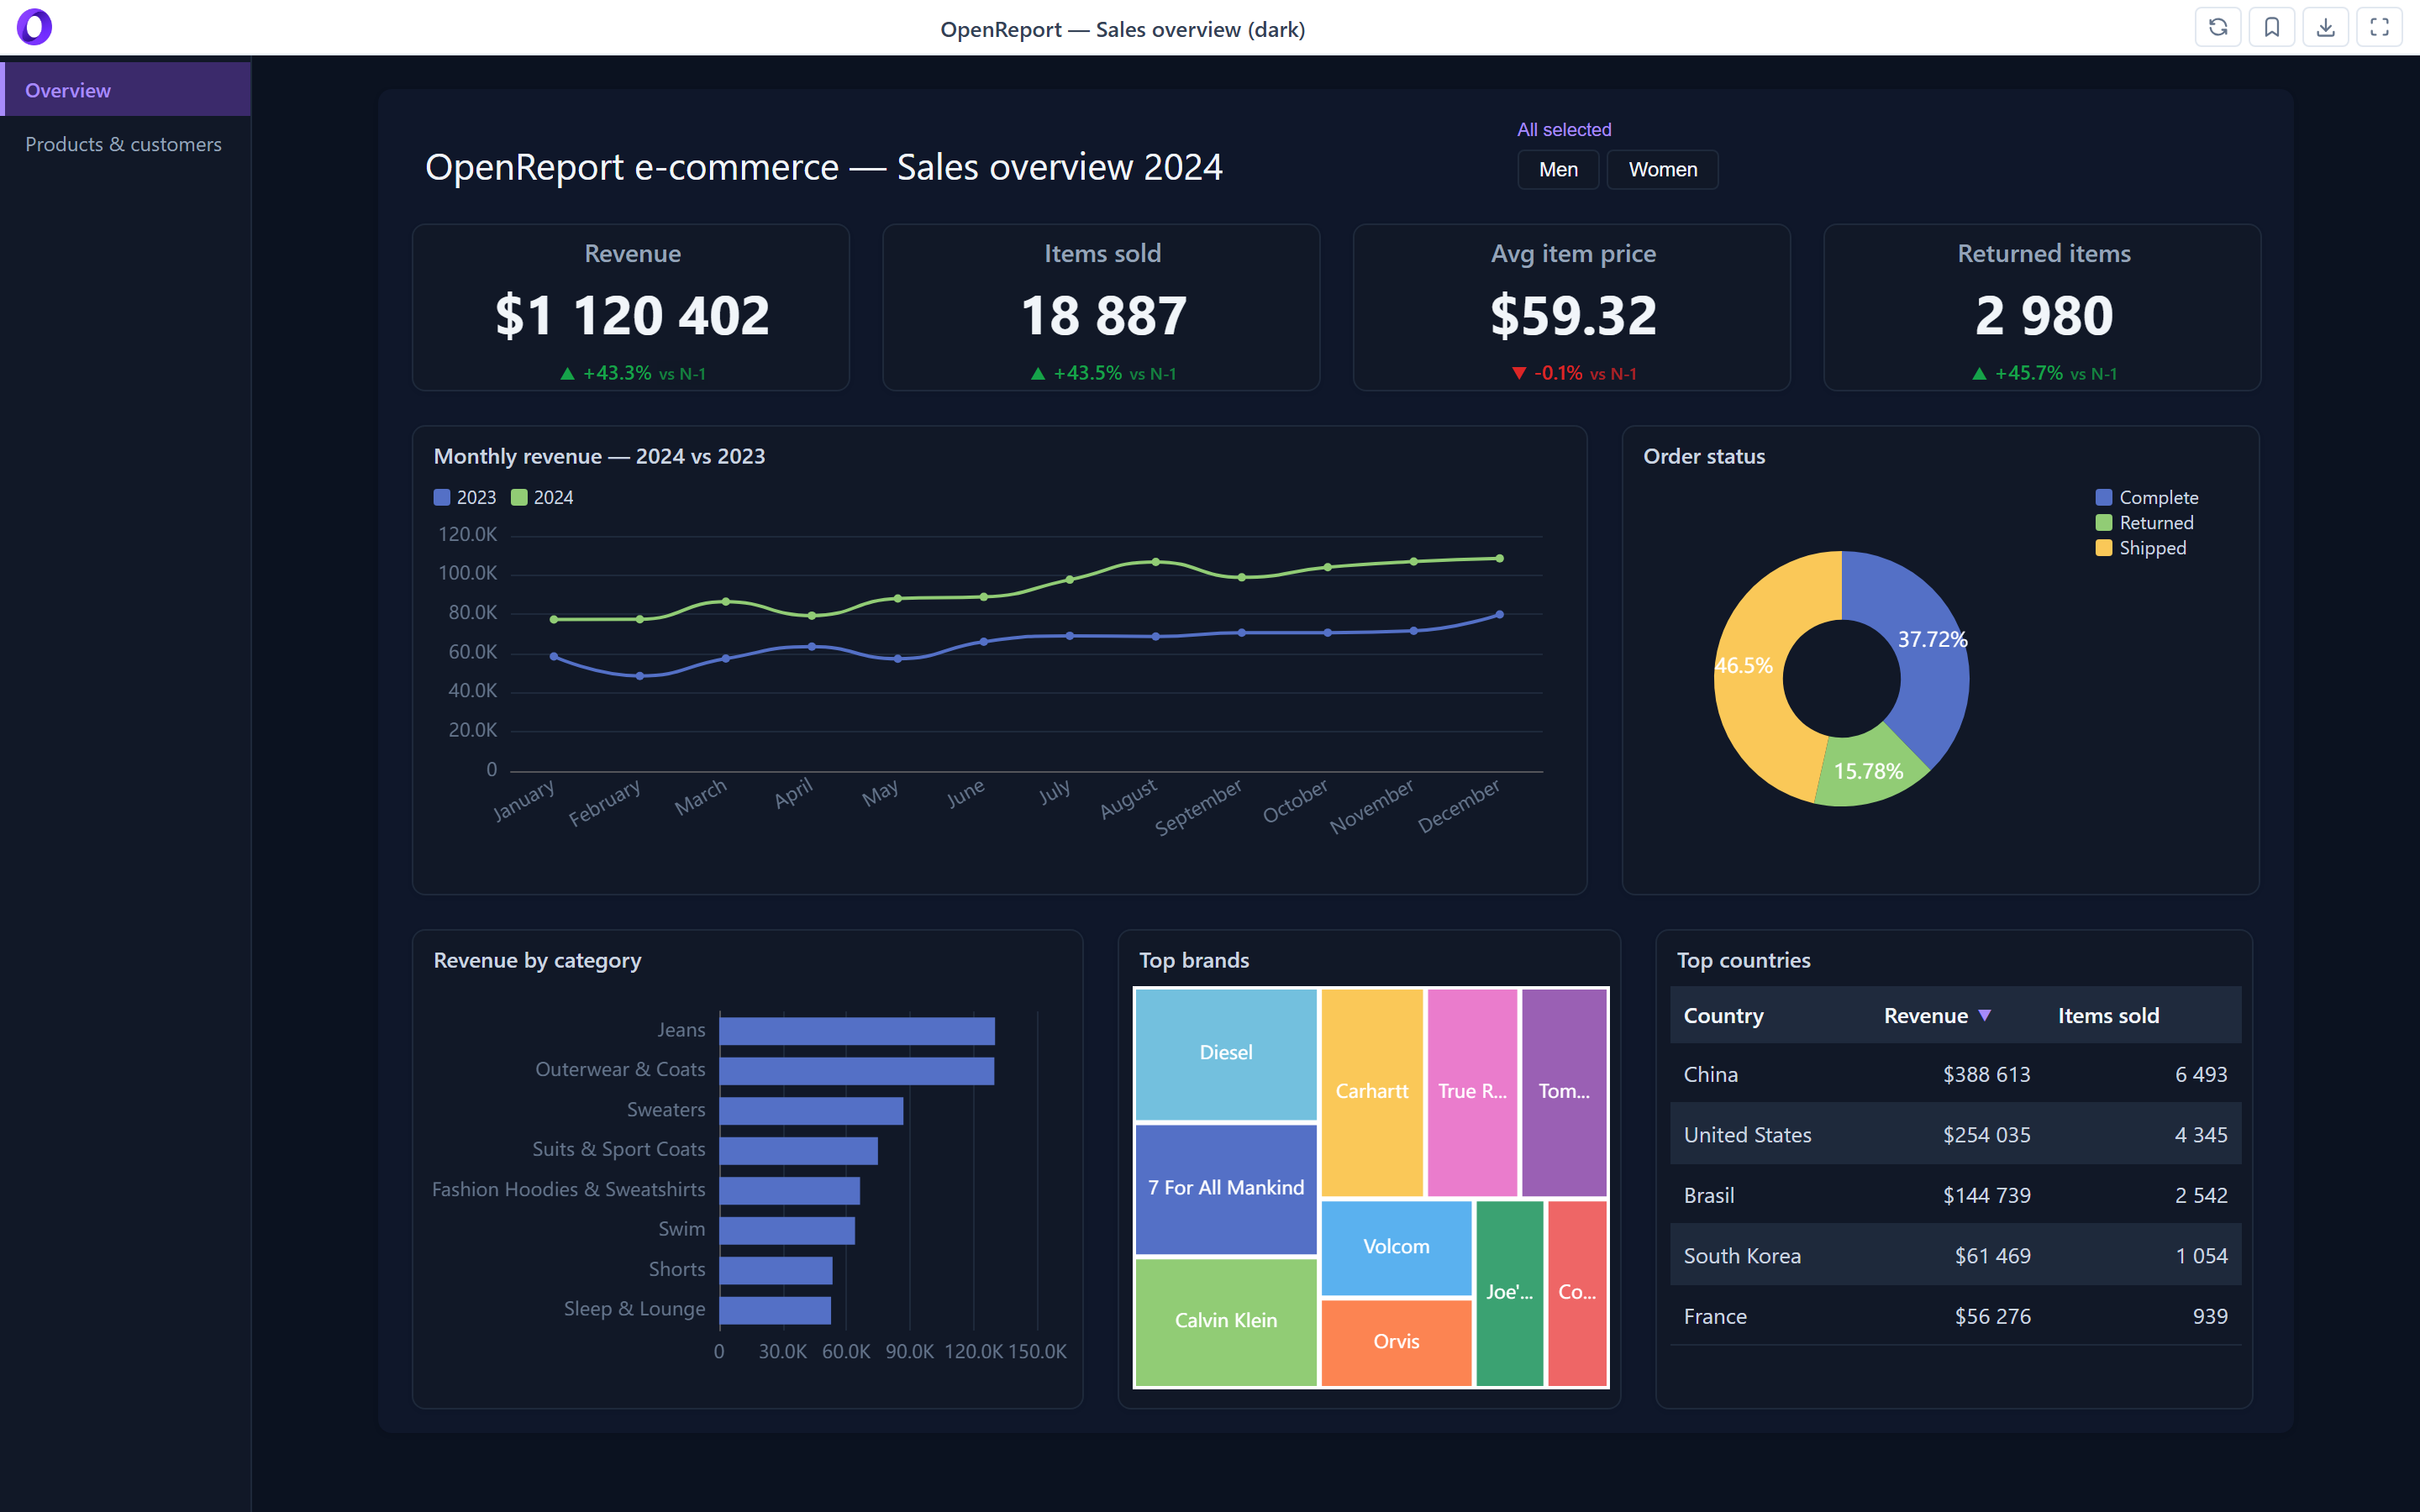
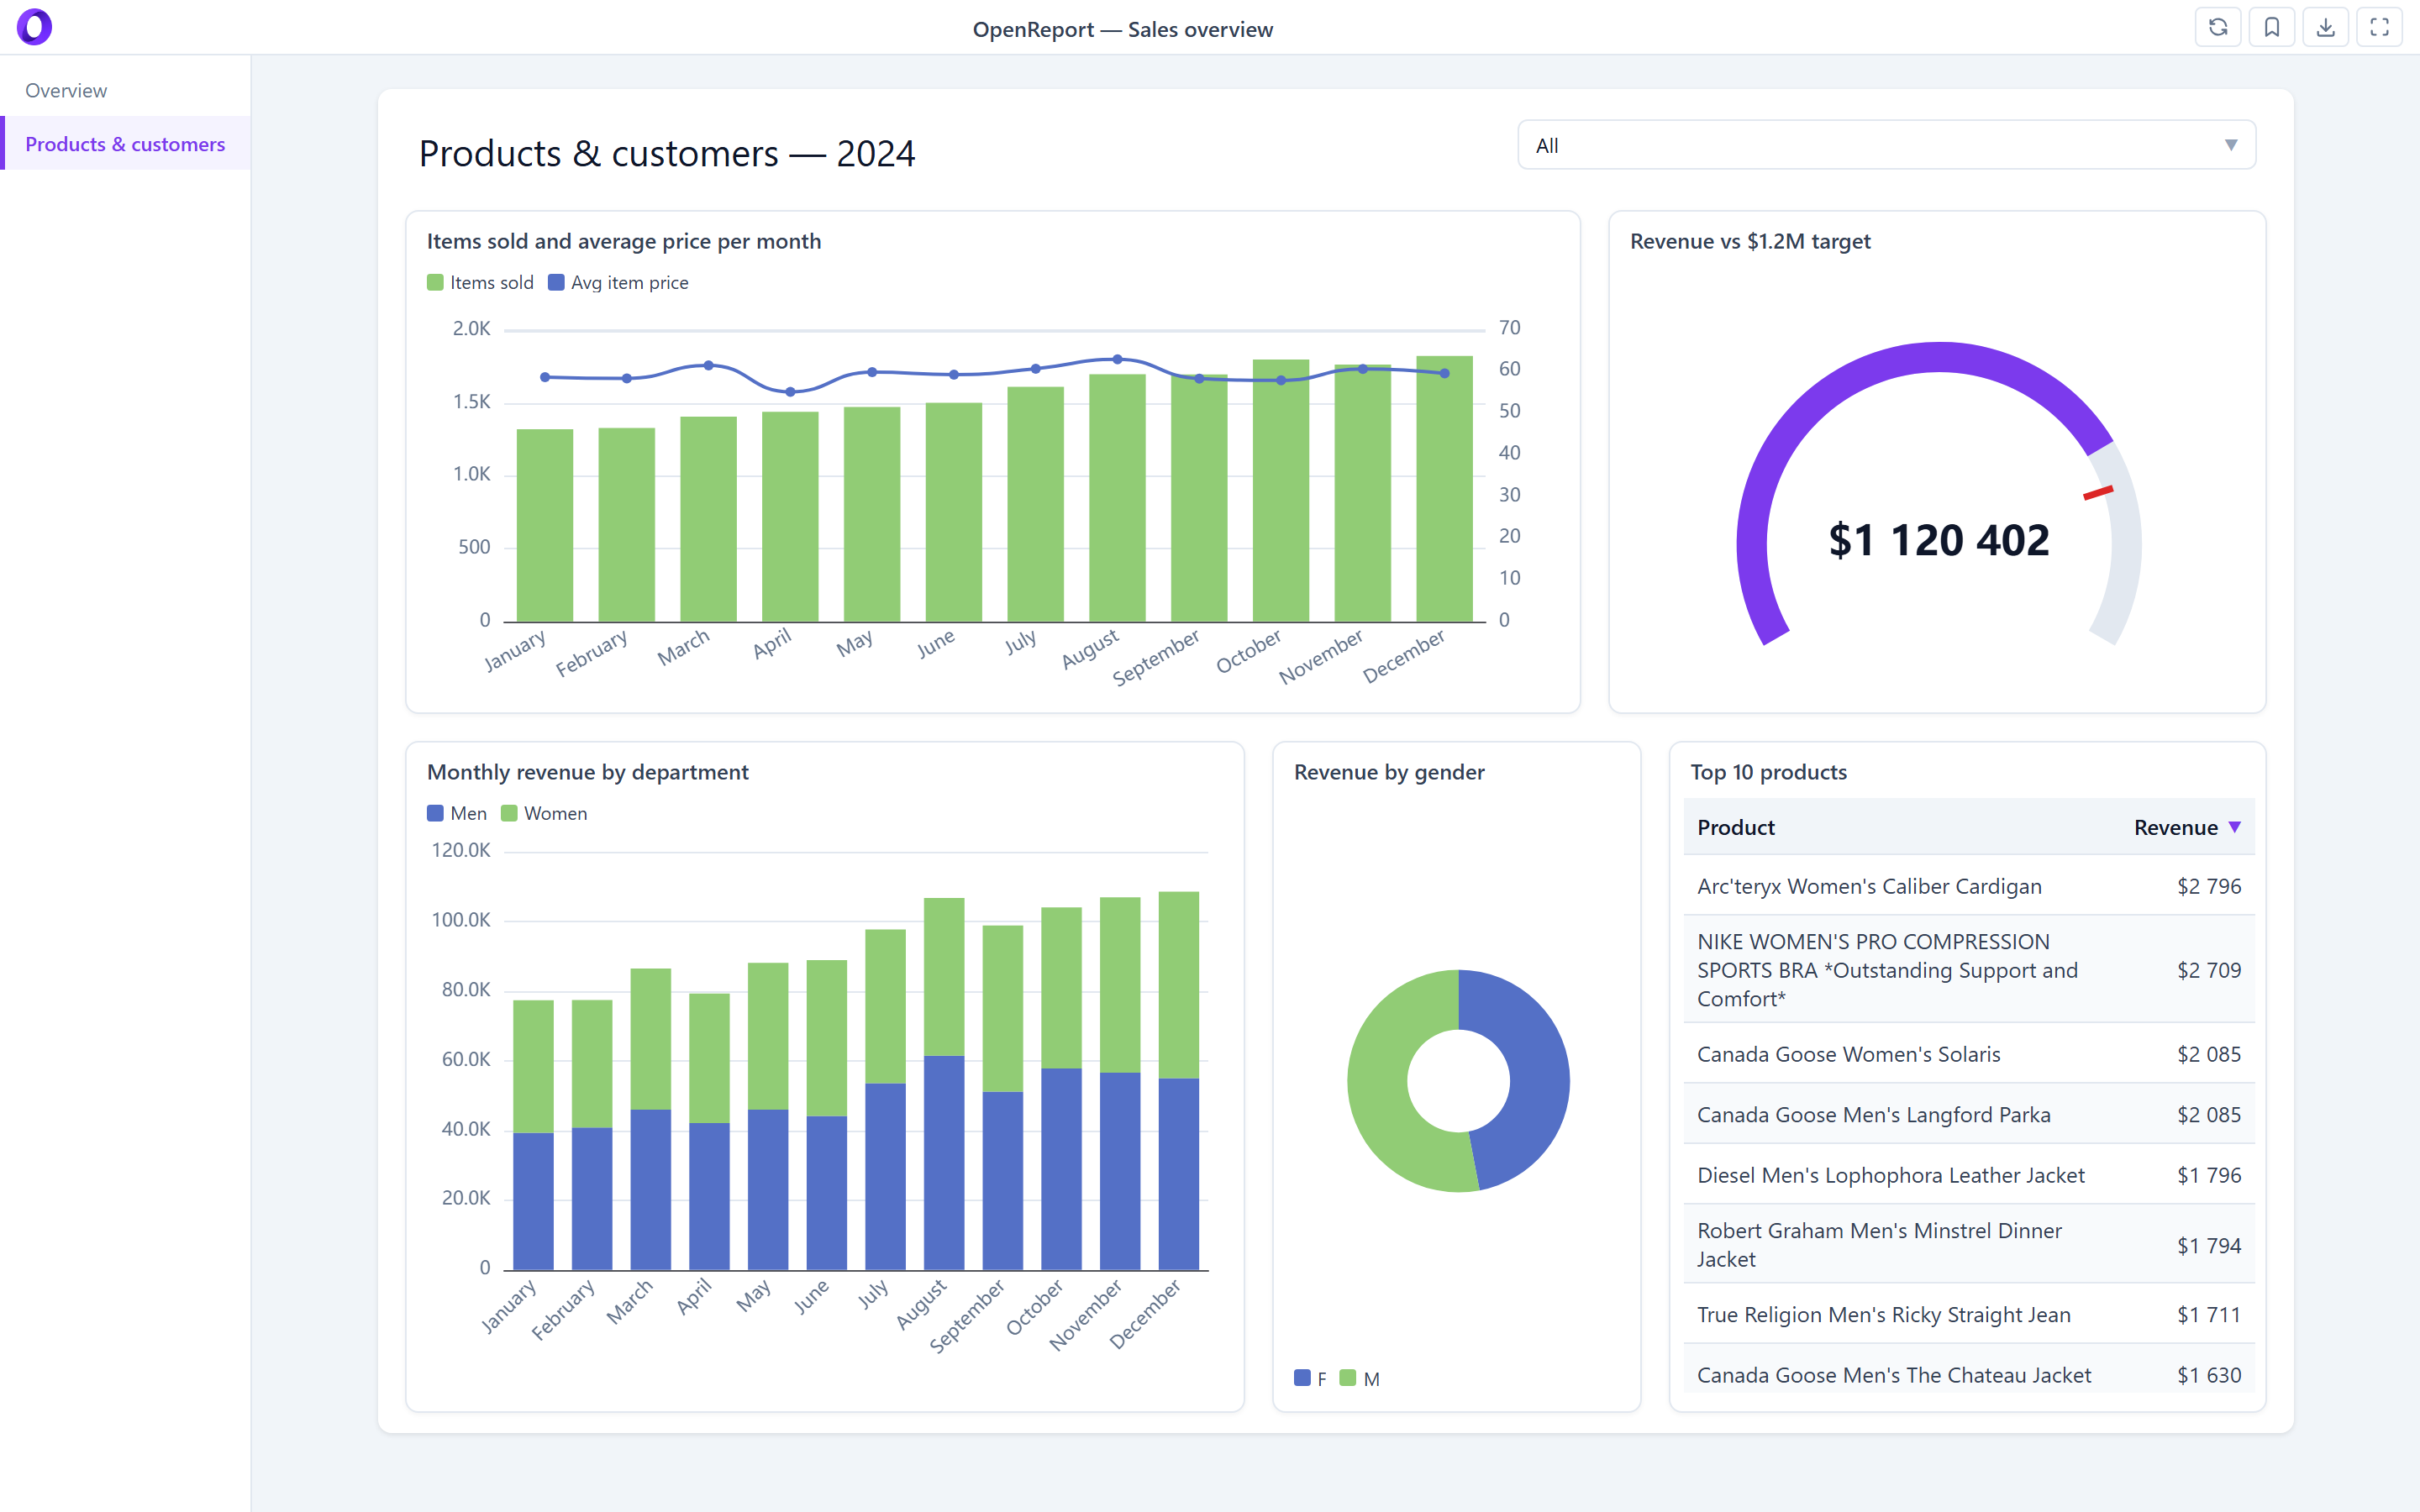
A sales report built on the public thelook_ecommerce BigQuery dataset. Every report has its own theme, and
reports can have several pages.
| Dark theme | Page two: combo chart, gauge, top-N table |
|---|---|
 |  |
| Report editor | Model editor |
|---|---|
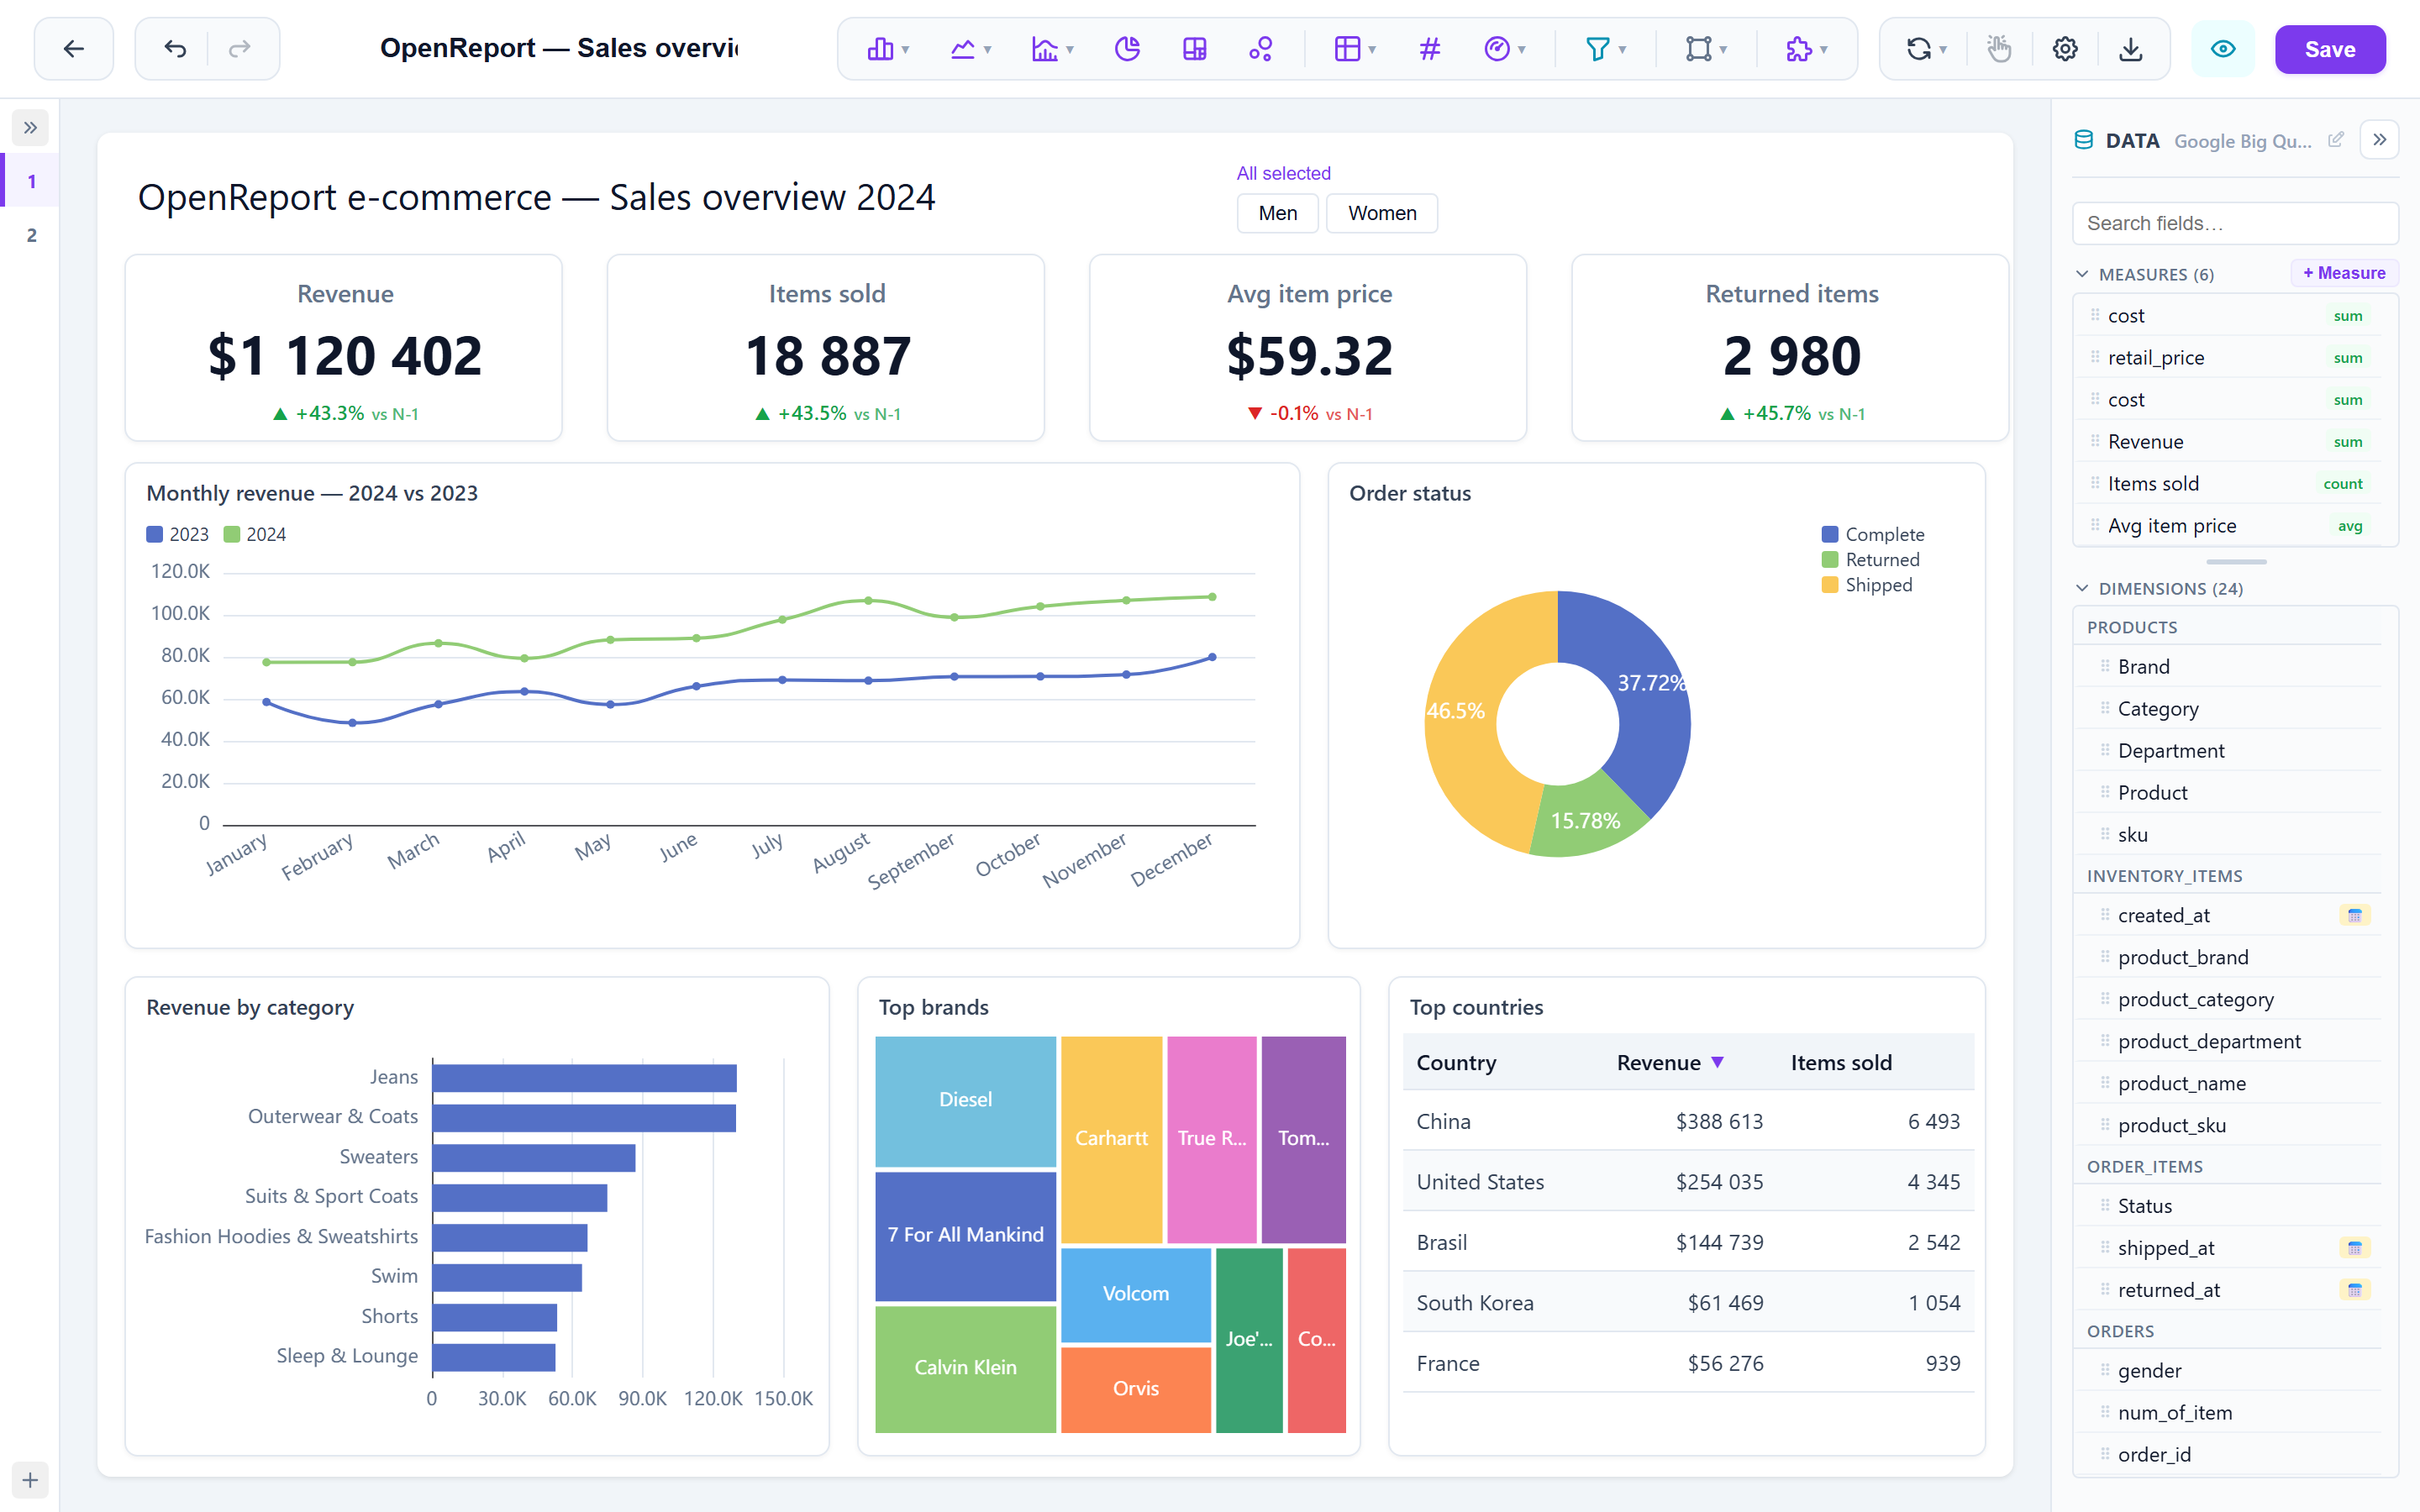 | 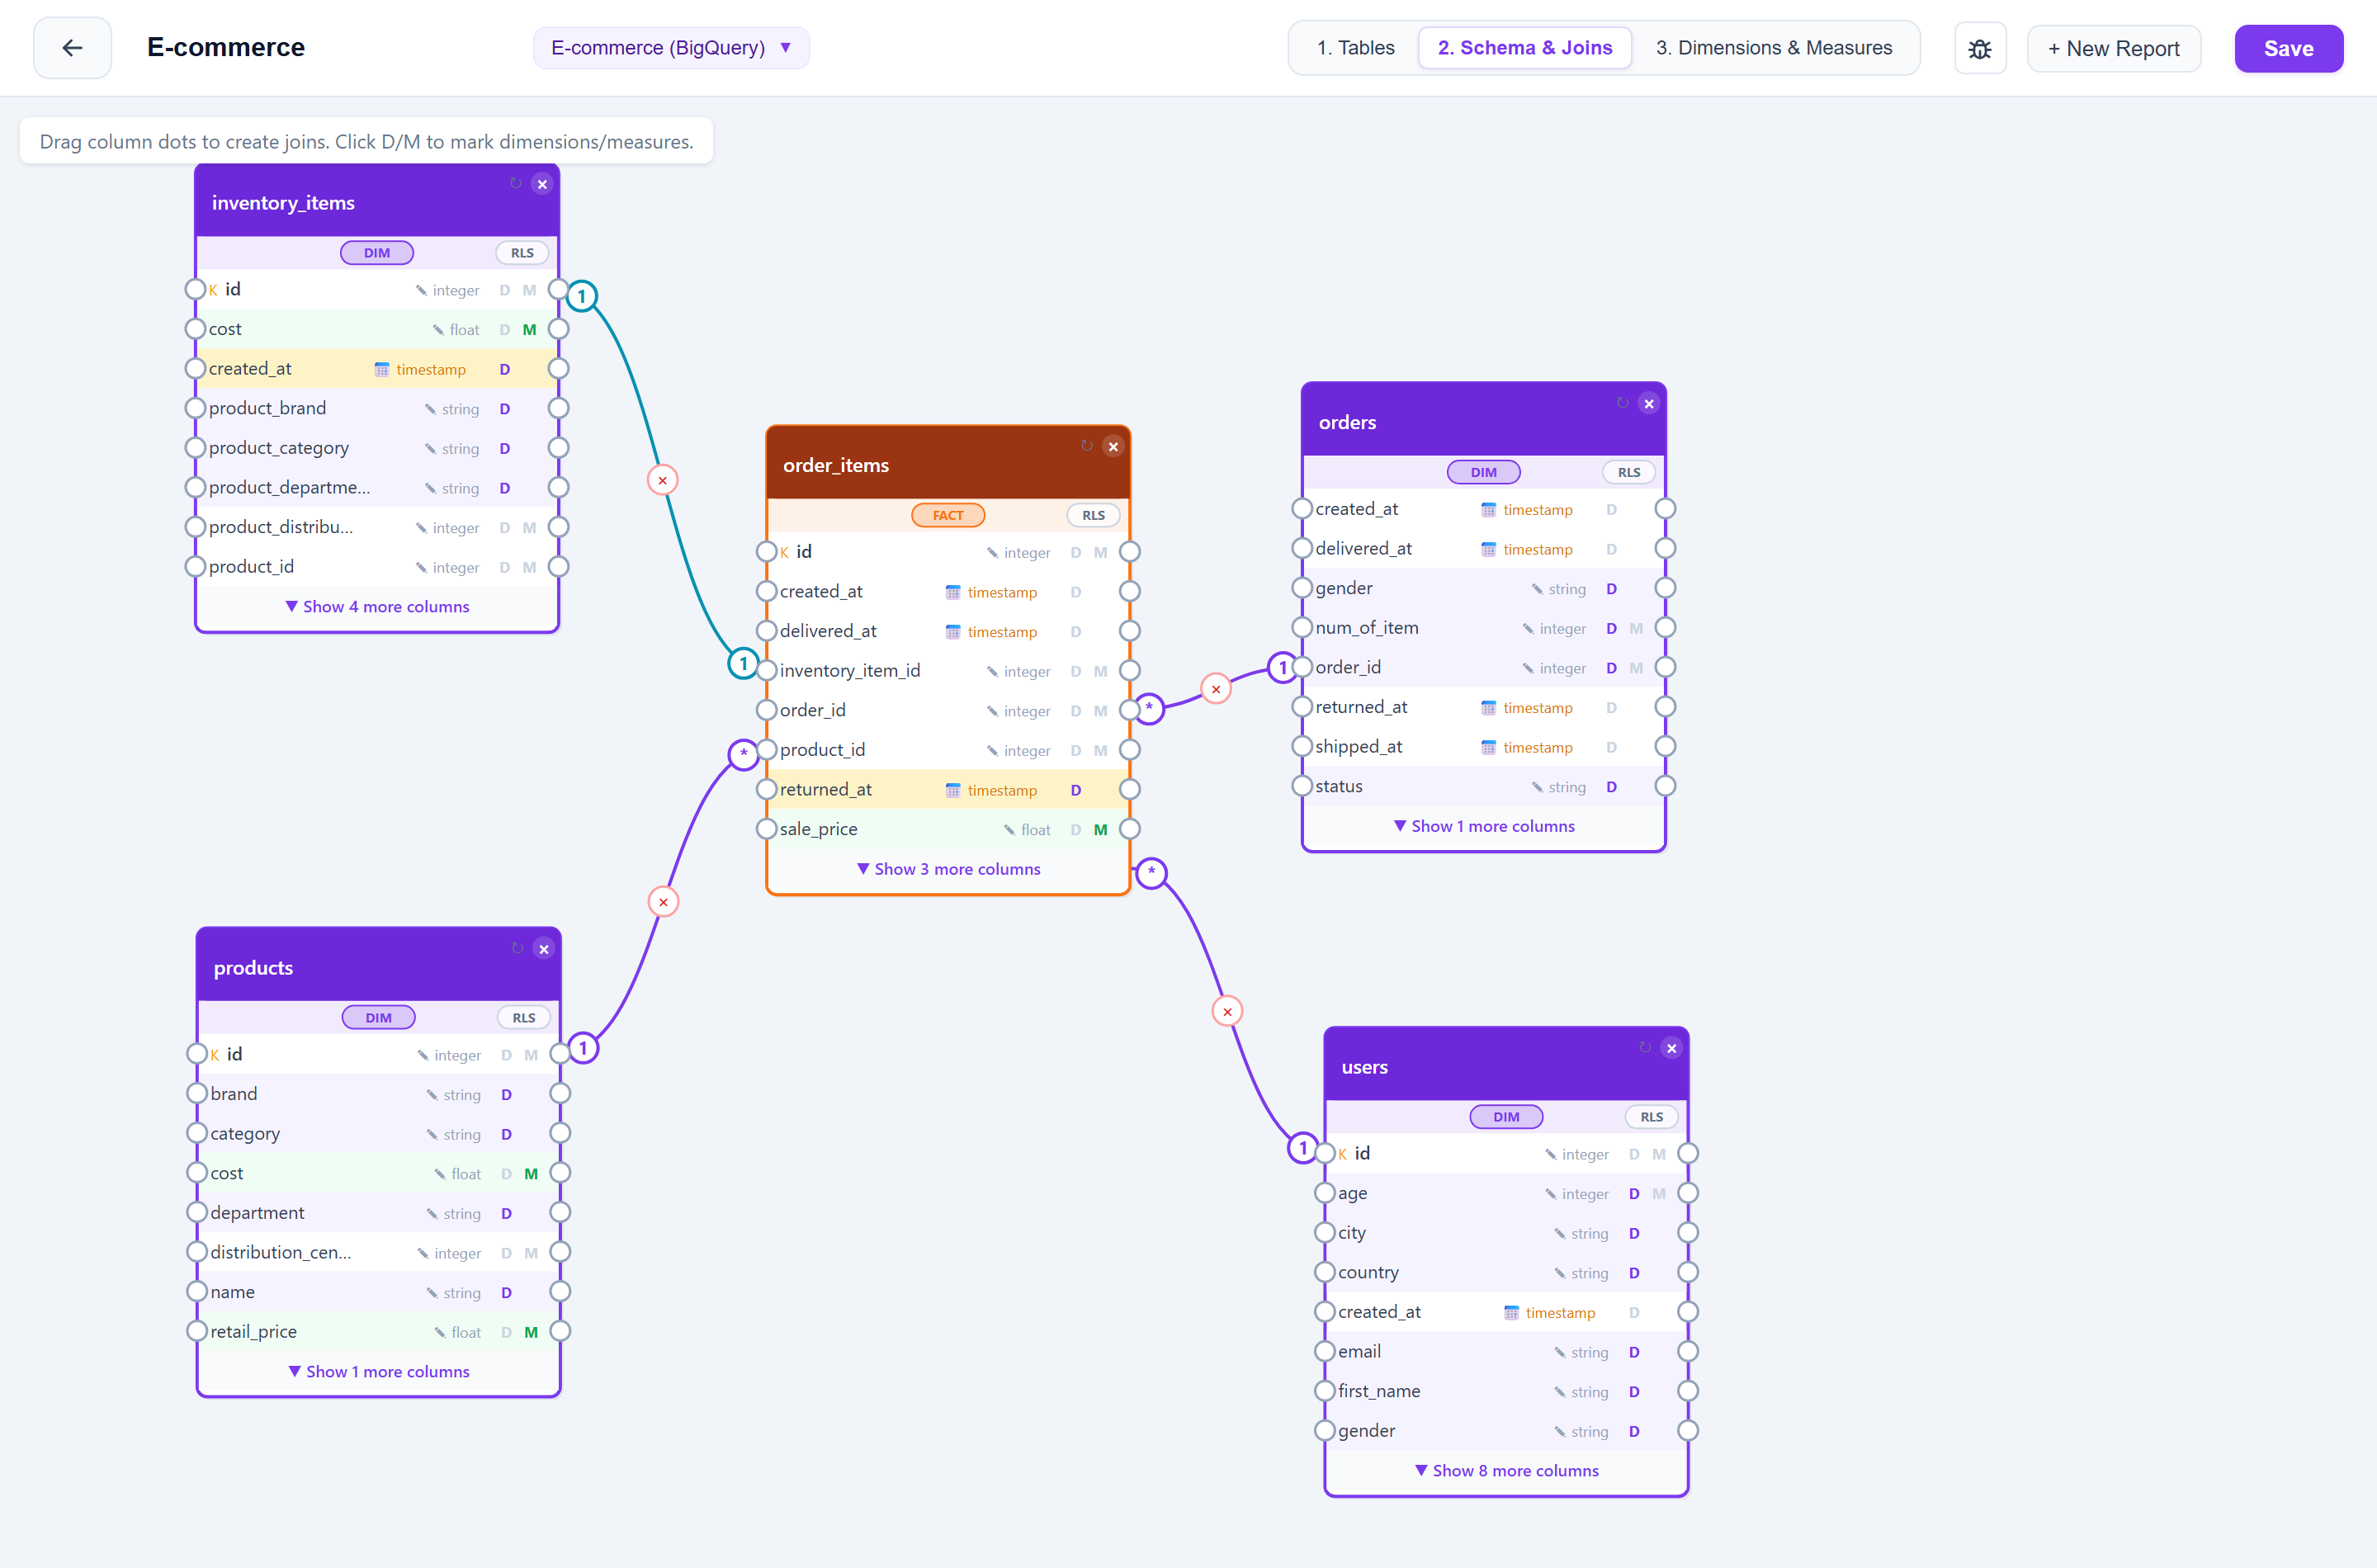 |
In the editor, drag fields from the model onto the page and tune each visual in the property panel, with undo/redo, snap-to-grid and cross-filtering. In the model editor, pick tables, draw joins with their cardinality, and flag dimensions and measures once for every report.
How it compares
| Open Report | Metabase | Apache Superset | Power BI | |
|---|---|---|---|---|
| License | AGPL-3.0 | AGPL-3.0 + commercial | Apache-2.0 | Proprietary |
| Self-hosted | ✅ | ✅ | ✅ | Report Server only |
| Free-form, multi-page report canvas | ✅ | Grid dashboards | Grid dashboards | ✅ |
| Semantic model (joins, measures) | ✅ | Partial | Datasets and metrics | ✅ |
| Row-level security in the free edition | ✅ | Paid plans | ✅ | Licensed |
| Built-in data preparation (ETL, like Power Query) | ❌ | ❌ | ❌ | ✅ |
Metabase and Superset are mature, widely used projects with many more connectors and years of production use. If something in this table is wrong or out of date, please open an issue.
Features
- Data: PostgreSQL, Amazon Redshift, Snowflake, Databricks, ClickHouse, MySQL, Oracle, SQL Server, Azure SQL, BigQuery, DuckDB. Files: CSV, Excel (.xlsx), Parquet, JSON, TSV, SQLite, DuckDB, several of them in one model.
- Modeling: joins with cardinality, dimensions, measures, calculated columns, filtered measures with CALCULATE semantics, same period last year, row-level security.
- Reports: 10+ visual types (bar, line, pie, pivot, table, waterfall, gauge, treemap, slicers…), plus your own custom visuals. Free positioning, snap-to-grid, shapes, multi-page reports, themes, cross-filtering and cross-highlighting.
- AI assistant (optional, bring your own provider): charts from questions, page layout, model building and in-app help.
- Performance: pre-aggregation cache with scheduled refreshes, with a fallback to live queries.
- Collaboration: workspaces with viewer, editor and admin roles, sharing between workspaces, public links.
- Output: export to PDF, PNG and Excel, plus a REST API for scripted refreshes with scoped tokens.
What it doesn't do (yet)
Open Report is still in active development, and we are looking for testers. Install it, point it at your own data and tell us what breaks or what is missing, in Discussions or Issues. Every report helps.
Known limits today:
- No ETL. There is no data preparation step like Power BI's Power Query (Edit queries): Open Report reads your tables as they are, so cleaning, reshaping and merging happen upstream, in your database or your files.
- The pre-aggregation cache doesn't cover every measure. Non-additive ones and exotic SQL functions fall back to a live query against the source.
- Pivot tables are computed client-side, so very large result sets will hurt.
- No schema migration tool. Upgrades run idempotent ALTERs at boot.
Contributing
Contributions are welcome.
- ARCHITECTURE.md: how a widget becomes SQL, and which file to open for which change. Read this first; it saves more time than it takes.
- CONTRIBUTING.md: setup, tests, and what a good pull request looks like.
- SECURITY.md: how to report a vulnerability. Please do not open an issue for one.
- CODE_OF_CONDUCT.md
Built with React, ECharts, Node.js, Express, SQLite and DuckDB.
Questions and ideas go to Discussions; confirmed bugs go to Issues.
License
GNU Affero General Public License v3.0.
Free to use, self-host, modify and redistribute. If you run a modified version as a network service, the AGPL requires you to publish your changes under the same license.
Contributions are accepted under the same license (see CONTRIBUTING.md).
Similar repos


Open source, self-hosted alternative to Power BI and Looker Studio: semantic model, drag-and-drop reports, AI assistant. One Docker container.
See the codeSee what people are saying
README
Open Report
Free and open source under AGPL-3.0. Self-host it, fork it, use it at work.
Superset too complicated? Metabase too limited? Power BI not open source? That's why I built Open Report.
An open source, self-hosted reporting and data visualization platform, easy to run and easy to configure. Point it at your database, describe your tables once (joins, dimensions, measures), then build interactive dashboards on a drag-and-drop canvas. It compiles the SQL for you, in your dialect, against your data. Nothing leaves your infrastructure.
Think Power BI / Looker Studio, but open source and self-hosted.
With an AI assistant that never touches your live data. Ask a question in any language and get a chart, or ask it to lay out a page, join the tables of a new model or explain a feature. It reads only Open Report's pre-aggregated cache, never your database, and works with Anthropic or any OpenAI-compatible server, a local one included. It proposes, you apply.
🧪 Still in development: we are looking for testers. Read more.
Website · Quick start · Screenshots · How it compares · Changelog
Quick start
One container, plain HTTP on port 3001, built for amd64 and arm64:
mkdir openreport && cd openreport
curl -fsSL https://raw.githubusercontent.com/cracky777/openreport/master/docker-compose.yml -o docker-compose.yml
printf 'SESSION_SECRET=%s\nINTERNAL_TOKEN_SECRET=%s\nDATASOURCE_ENC_KEY=%s\n' \
  $(openssl rand -hex 32) $(openssl rand -hex 32) $(openssl rand -hex 32) > .env
docker compose up -d
Open http://localhost:3001 and sign up: the first account becomes the admin. A guided tour and the assistant's Help tab take it from there.
Data, secrets, upgrades and reverse proxies
Everything lives in the openreport-data volume (SQLite metadata, uploads, caches). The three secrets in
.env are mandatory, and DATASOURCE_ENC_KEY encrypts your database passwords, so back it up with the
volume. Upgrade with docker compose pull && docker compose up -d.
- Behind your own reverse proxy (Caddy, Traefik, Nginx Proxy Manager): point it at port 3001 and forward
X-Forwarded-Proto. The session cookie gets itsSecureflag from that header, so plain HTTP on the LAN and HTTPS through the proxy both work with the same image. - Public host with TLS built in: the same
docker-compose.ymlalso bundles nginx and a Let's Encrypt certificate, behind thehttpsprofile. Clone the repository, addCOMPOSE_PROFILES=httpsto.envand follow the comments at the top of the file.
From source, without Docker
Prerequisites: Node.js >= 22 (an older one is refused with an EBADENGINE error, because DuckDB cannot be
built on it) and npm >= 9.
git clone https://github.com/cracky777/openreport.git open-report
cd open-report
./install.sh
npm run dev
install.sh settles the Node version first: it installs Node 22 through nvm, under your own home directory
and without sudo, when the one on your PATH is missing or too old, then installs every dependency. Set
OPENREPORT_SKIP_NODE=1 to manage Node yourself. On Windows, or to do it by hand: install Node 22, then
npm run install:all.
npm run dev serves the frontend on http://localhost:5173 and the API on http://localhost:3001. For a
production process without Docker, build the client with npm run build and run npm start: the server
then serves the built frontend itself on port 3001, with the same environment variables as the Docker image
(see .env.example).
Screenshots
A sales report built on the public thelook_ecommerce BigQuery dataset. Every report has its own theme, and
reports can have several pages.
| Dark theme | Page two: combo chart, gauge, top-N table |
|---|---|
| |
| Report editor | Model editor |
|---|---|
| |
In the editor, drag fields from the model onto the page and tune each visual in the property panel, with undo/redo, snap-to-grid and cross-filtering. In the model editor, pick tables, draw joins with their cardinality, and flag dimensions and measures once for every report.
How it compares
| Open Report | Metabase | Apache Superset | Power BI | |
|---|---|---|---|---|
| License | AGPL-3.0 | AGPL-3.0 + commercial | Apache-2.0 | Proprietary |
| Self-hosted | ✅ | ✅ | ✅ | Report Server only |
| Free-form, multi-page report canvas | ✅ | Grid dashboards | Grid dashboards | ✅ |
| Semantic model (joins, measures) | ✅ | Partial | Datasets and metrics | ✅ |
| Row-level security in the free edition | ✅ | Paid plans | ✅ | Licensed |
| Built-in data preparation (ETL, like Power Query) | ❌ | ❌ | ❌ | ✅ |
Metabase and Superset are mature, widely used projects with many more connectors and years of production use. If something in this table is wrong or out of date, please open an issue.
Features
- Data: PostgreSQL, Amazon Redshift, Snowflake, Databricks, ClickHouse, MySQL, Oracle, SQL Server, Azure SQL, BigQuery, DuckDB. Files: CSV, Excel (.xlsx), Parquet, JSON, TSV, SQLite, DuckDB, several of them in one model.
- Modeling: joins with cardinality, dimensions, measures, calculated columns, filtered measures with CALCULATE semantics, same period last year, row-level security.
- Reports: 10+ visual types (bar, line, pie, pivot, table, waterfall, gauge, treemap, slicers…), plus your own custom visuals. Free positioning, snap-to-grid, shapes, multi-page reports, themes, cross-filtering and cross-highlighting.
- AI assistant (optional, bring your own provider): charts from questions, page layout, model building and in-app help.
- Performance: pre-aggregation cache with scheduled refreshes, with a fallback to live queries.
- Collaboration: workspaces with viewer, editor and admin roles, sharing between workspaces, public links.
- Output: export to PDF, PNG and Excel, plus a REST API for scripted refreshes with scoped tokens.
What it doesn't do (yet)
Open Report is still in active development, and we are looking for testers. Install it, point it at your own data and tell us what breaks or what is missing, in Discussions or Issues. Every report helps.
Known limits today:
- No ETL. There is no data preparation step like Power BI's Power Query (Edit queries): Open Report reads your tables as they are, so cleaning, reshaping and merging happen upstream, in your database or your files.
- The pre-aggregation cache doesn't cover every measure. Non-additive ones and exotic SQL functions fall back to a live query against the source.
- Pivot tables are computed client-side, so very large result sets will hurt.
- No schema migration tool. Upgrades run idempotent ALTERs at boot.
Contributing
Contributions are welcome.
- ARCHITECTURE.md: how a widget becomes SQL, and which file to open for which change. Read this first; it saves more time than it takes.
- CONTRIBUTING.md: setup, tests, and what a good pull request looks like.
- SECURITY.md: how to report a vulnerability. Please do not open an issue for one.
- CODE_OF_CONDUCT.md
Built with React, ECharts, Node.js, Express, SQLite and DuckDB.
Questions and ideas go to Discussions; confirmed bugs go to Issues.
License
GNU Affero General Public License v3.0.
Free to use, self-host, modify and redistribute. If you run a modified version as a network service, the AGPL requires you to publish your changes under the same license.
Contributions are accepted under the same license (see CONTRIBUTING.md).