
README
isocubes 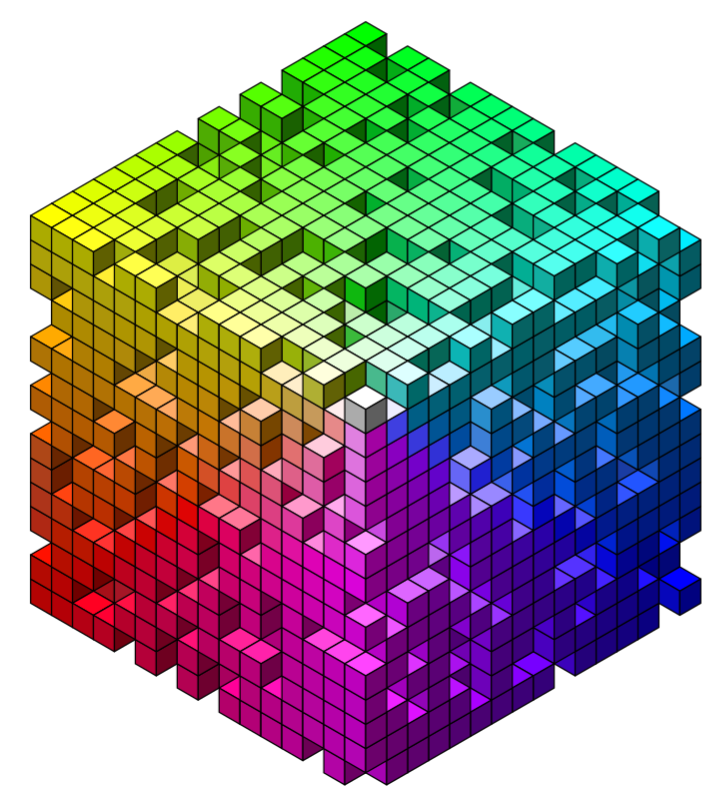


isocubes is a voxel renderer
which uses isometric cubes as the 3D pixel element.
A voxel is a representation of a value on a three-dimensional regular grid i.e. the 3d equivalent of a 2d pixel.
The necessary constraints to make this a fast renderer are:
- voxels are rendered at integer coordinates only
- the isocube representation is always from a fxed viewpoint - these cubes do not rotate.
What’s in the box
isocubesGrob()- create isometric cubes to represent voxels at the given coordinates.isolinesGrob()- create isometric grids of lines. Useful to represent a ground plane.isopointsGrob()- create isometric grids of points. Useful to represent a ground planeisoaxesGrob()- create lines representing x,y,z axes. Useful to debug orientation issues.calc_heightmap_coords()calculate coordinates for a height-map from a matrix of values- Transforms:
coords_translate()coords_rotate()coords_align()a custom translation to align the edges or centroid of an object with a particular location e.g. to move the centroid of the object to the origin
- Example objects:
obj_letterThe letter ‘R’obj_organicAn organic shape
- Object generators:
gen_isosurface()generate voxel coordinates for the isosurface of an implicit functiongen_sphere()generate voxel coordinates for a sphere of the given radiusgen_cube()generate voxel coordinates for a cube of the given size
calc_visibility()perform visibility culling on a set of voxel coordinates - voxels hidden behind other voxels will be removed. This is done internally during isocube creation and is not needed for general use. Possibly useful if the voxels were to be rendered with a different backend e.g. nativeRaster
Installation
You can install the latest development version from GitHub with:
# install.package('remotes')
install.packages('colorfast')
remotes::install_github('coolbutuseless/isocubes')
Pre-built source/binary versions can also be installed from R-universe
install.packages('isocubes', repos = c('https://coolbutuseless.r-universe.dev', 'https://cloud.r-project.org'))
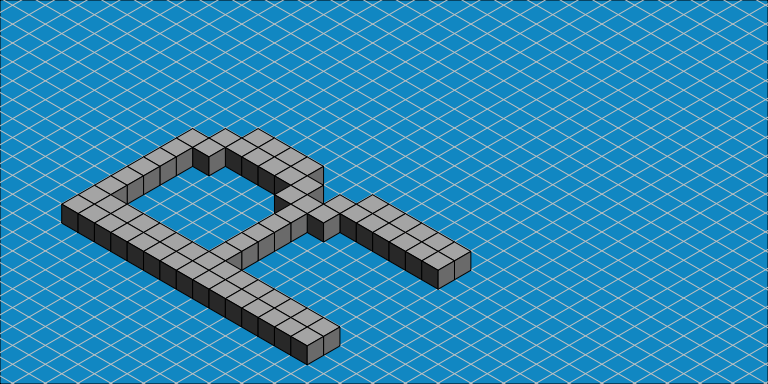
Letter ‘R’ in isocubes
library(grid)

# Coordinates for a letter 'R' included with this package
head(obj_letter)
#>   x  y z
#> 1 7 14 0
#> 2 6 14 0
#> 3 5 14 0
#> 4 4 14 0
#> 5 3 14 0
#> 6 2 14 0

cubes  <- isocubesGrob(obj_letter, size = 5, x = 0.4, y = 0.05)
gnd    <- isolinesGrob(size = 5, x = 0.4, y = 0.05, col = 'grey80')

# Draw background fill + isolines as ground + isocubes
grid.rect(gp = gpar(fill = 'deepskyblue3'))
grid.draw(gnd)
grid.draw(cubes)
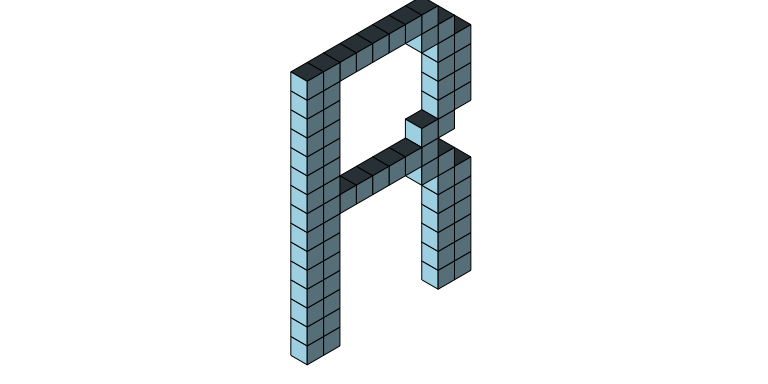
# Change the relative intensity of the shading of each face
cubes  <- isocubesGrob(
  obj_letter, size = 5,
  x = 0.4, y = 0.05,
  xyplane = 'right',
  fill = 'lightblue', intensity = c(0.3, 1, 0.6)
)

grid.newpage(); grid.draw(cubes)
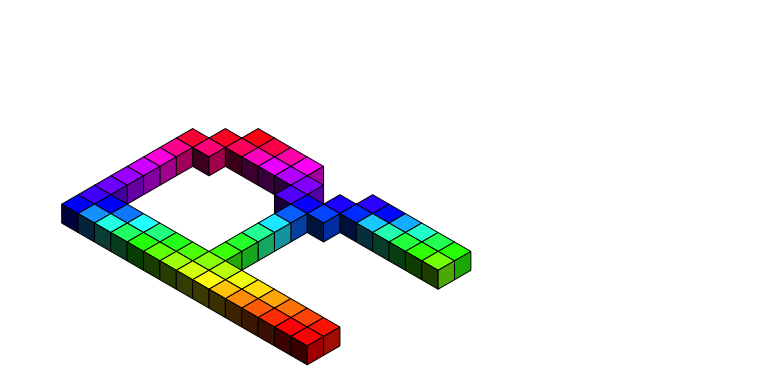
# Colour the cubes with rainbow
cubes <- isocubesGrob(obj_letter, fill = rainbow(nrow(obj_letter)), size = 5, x = 0.4, y = 0.05)
grid.newpage(); grid.draw(cubes)
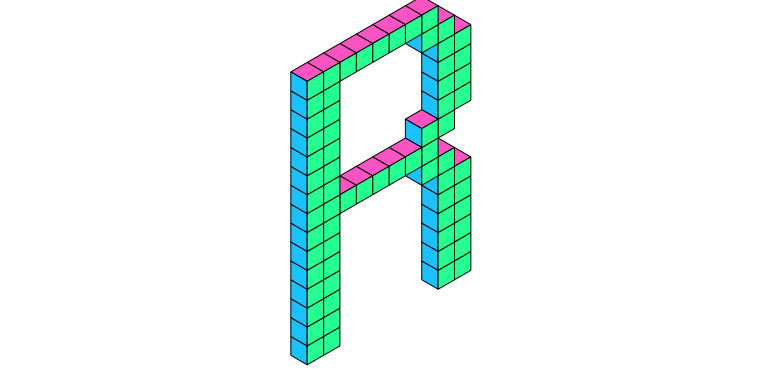
# VaporWave palette
cubes <- isocubesGrob(obj_letter, fill = '#ff71ce', fill_left = '#01cdfe',
                      xyplane = 'right',
                      fill_right = '#05ffa1', size = 5, x = 0.4, y = 0.05)
grid.newpage(); grid.draw(cubes)
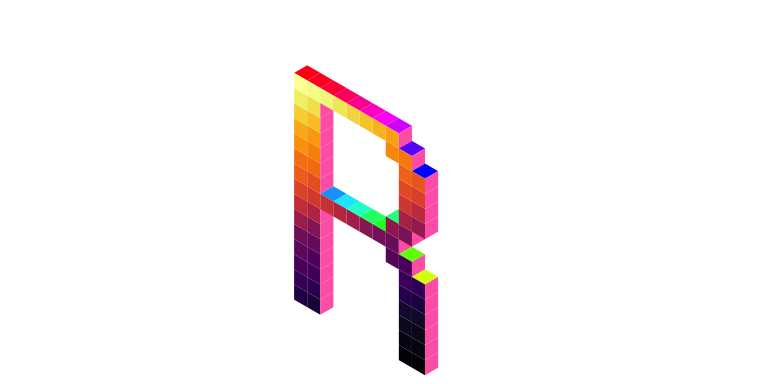
# Nightmare palette
cubes <- isocubesGrob(obj_letter,
                      fill = rainbow(nrow(obj_letter)),
                      fill_right = 'hotpink',
                      fill_left = viridisLite::inferno(nrow(obj_letter)),
                      size = 4,
                      x = 0.4, y = 0.2,
                      xyplane = 'left',
                      col = NA)
grid.newpage(); grid.draw(cubes)
Simple isosurface - a sphere
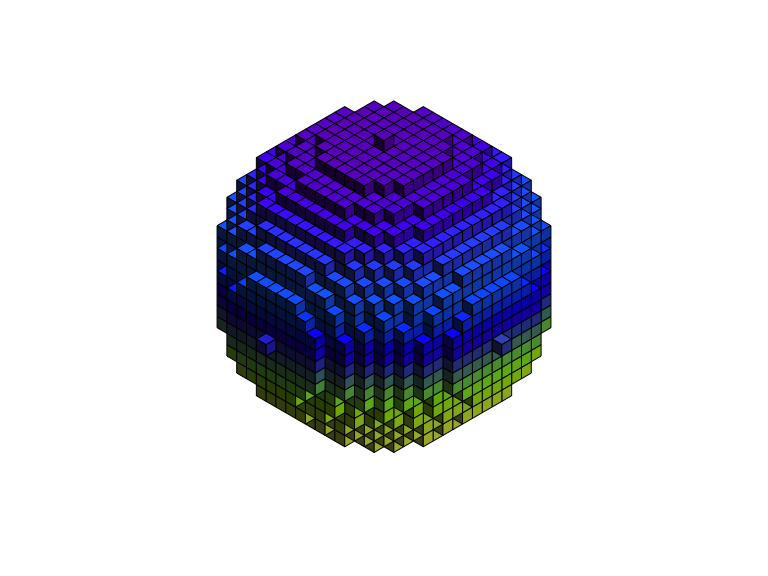
A data.frame with coordinates for a sphere can be generated with
gen_sphere()
library(grid)
library(isocubes)

coords <- gen_sphere(r = 12)
isocubesGrob(coords, size = 3, fill = rand_palette(nrow(coords), seed = 6)) |>
  grid::grid.draw()
Another isosurface
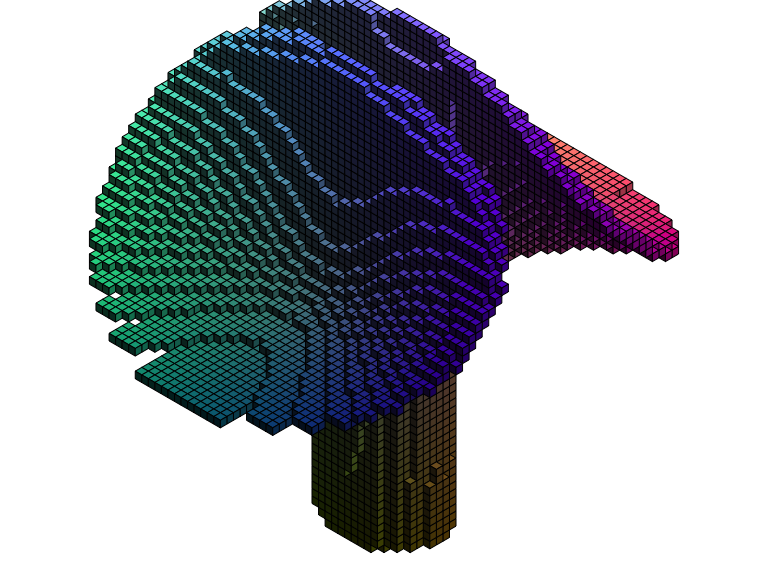
A fancy isosurface by Stephane Laurent
A data.frame with coordinates for this organic shape is included in the
package as obj_organic.
#~~~~~~~~~~~~~~~~~~~~~~~~~~~~~~~~~~~~~~~~~~~~~~~~~~~~~~~~~~~~~~~~~~~~~~~~~~~~
# Define the implicit function
#~~~~~~~~~~~~~~~~~~~~~~~~~~~~~~~~~~~~~~~~~~~~~~~~~~~~~~~~~~~~~~~~~~~~~~~~~~~~
A <- cospi(3/4); B <- sinpi(3/4)
f <- function(x, y, z) {
  z^4*B^2 + 4*x*y^2*A*B^2 + x*z^2*A*B^2 - 2*z^4*A - 4*x*y^2*B^2 - x*z^2*B^2 +
    3*z^2*A*B^2 - 2*z^4 - x*A*B^2 - 2*z^2*A + x*B^2 + A*B^2 + 2*z^2 - B^2
}


#~~~~~~~~~~~~~~~~~~~~~~~~~~~~~~~~~~~~~~~~~~~~~~~~~~~~~~~~~~~~~~~~~~~~~~~~~~~~
# Generate coordinates for this surface and transorm into a specific viewpoint
#~~~~~~~~~~~~~~~~~~~~~~~~~~~~~~~~~~~~~~~~~~~~~~~~~~~~~~~~~~~~~~~~~~~~~~~~~~~~
coords <- gen_isosurface(f, upper = 0, lower = -2, scale = 1/10, nx = 70) |>
  coord_rotate(-pi/2, 'y') |>
  coord_rotate(pi/2, 'z')

#~~~~~~~~~~~~~~~~~~~~~~~~~~~~~~~~~~~~~~~~~~~~~~~~~~~~~~~~~~~~~~~~~~~~~~~~~~~~
# Further filter the voxels to lie within spherical bound
#~~~~~~~~~~~~~~~~~~~~~~~~~~~~~~~~~~~~~~~~~~~~~~~~~~~~~~~~~~~~~~~~~~~~~~~~~~~~
coords <- coords[with(coords, x^2 + y^2 + z^2 < 10^3),]

#~~~~~~~~~~~~~~~~~~~~~~~~~~~~~~~~~~~~~~~~~~~~~~~~~~~~~~~~~~~~~~~~~~~~~~~~~~~~
# Gererate some colors
#~~~~~~~~~~~~~~~~~~~~~~~~~~~~~~~~~~~~~~~~~~~~~~~~~~~~~~~~~~~~~~~~~~~~~~~~~~~~
coords$fill <-  rgb(red = 1 + coords$x/31, 1 + coords$y/31, 1 + coords$z/31, maxColorValue = 2)

#~~~~~~~~~~~~~~~~~~~~~~~~~~~~~~~~~~~~~~~~~~~~~~~~~~~~~~~~~~~~~~~~~~~~~~~~~~~~
# Render the voxels as isocubes
#~~~~~~~~~~~~~~~~~~~~~~~~~~~~~~~~~~~~~~~~~~~~~~~~~~~~~~~~~~~~~~~~~~~~~~~~~~~~
grid::grid.newpage()
isocubesGrob(coords, size = 2) |>
  grid::grid.draw()
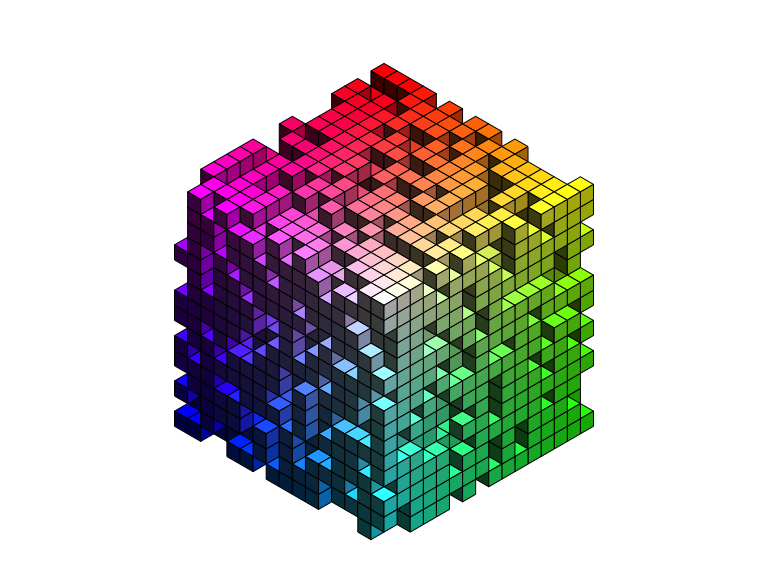
Random rainbow volume of isocubes
library(grid)
library(isocubes)
set.seed(1)

N      <- 15
coords <- expand.grid(x=0:N, y=0:N, z=0:N)
coords <- coords[sample(nrow(coords), 0.66 * nrow(coords)),]
fill   <- rgb(red = coords$z / N, 1 - coords$y / N, 1 - coords$x/N, maxColorValue = 1)

cubes <- isocubesGrob(coords, fill, size = 4, y = 0.05)
grid.newpage(); grid.draw(cubes)
Heightmap as isocubes
#~~~~~~~~~~~~~~~~~~~~~~~~~~~~~~~~~~~~~~~~~~~~~~~~~~~~~~~~~~~~~~~~~~~~~~~~~~~~~
# Prepare a matrix of values
#~~~~~~~~~~~~~~~~~~~~~~~~~~~~~~~~~~~~~~~~~~~~~~~~~~~~~~~~~~~~~~~~~~~~~~~~~~~~~
mat <- volcano

#~~~~~~~~~~~~~~~~~~~~~~~~~~~~~~~~~~~~~~~~~~~~~~~~~~~~~~~~~~~~~~~~~~~~~~~~~~~~~
# An optional matrix of colours
#~~~~~~~~~~~~~~~~~~~~~~~~~~~~~~~~~~~~~~~~~~~~~~~~~~~~~~~~~~~~~~~~~~~~~~~~~~~~~
val <- as.vector(mat)
val <- round(255 * (val - min(val)) / diff(range(val)))
fill <- terrain.colors(256)[val + 1L]
dim(fill) <- dim(mat)

#~~~~~~~~~~~~~~~~~~~~~~~~~~~~~~~~~~~~~~~~~~~~~~~~~~~~~~~~~~~~~~~~~~~~~~~~~~~~~
# Find the (integer) coordiinates of the cubes in the heightmap
#~~~~~~~~~~~~~~~~~~~~~~~~~~~~~~~~~~~~~~~~~~~~~~~~~~~~~~~~~~~~~~~~~~~~~~~~~~~~~
coords <- calc_heightmap_coords(mat - min(mat), fill = fill, scale = 0.3)

#~~~~~~~~~~~~~~~~~~~~~~~~~~~~~~~~~~~~~~~~~~~~~~~~~~~~~~~~~~~~~~~~~~~~~~~~~~~~~
# Convert the coordinates into a grob
#~~~~~~~~~~~~~~~~~~~~~~~~~~~~~~~~~~~~~~~~~~~~~~~~~~~~~~~~~~~~~~~~~~~~~~~~~~~~~
cubes  <- isocubesGrob(coords, size = 1.5, x = 0.65, y = 0)
grid.newpage(); grid.draw(cubes)
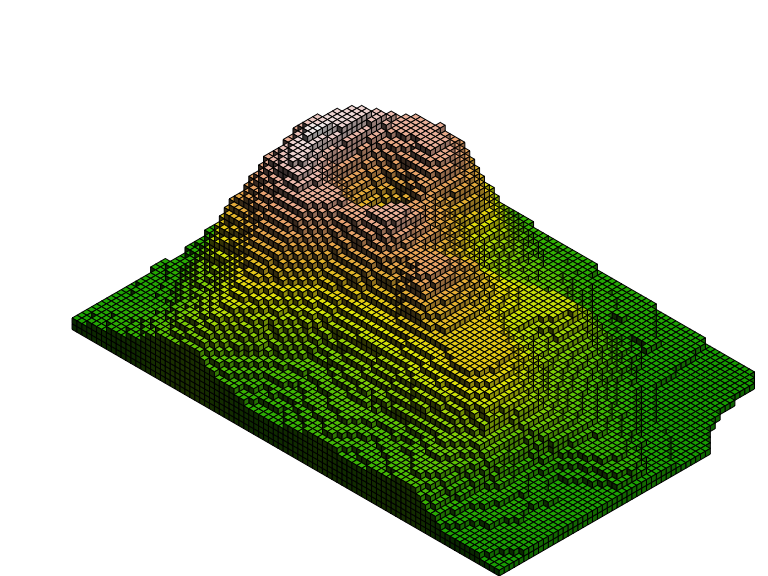
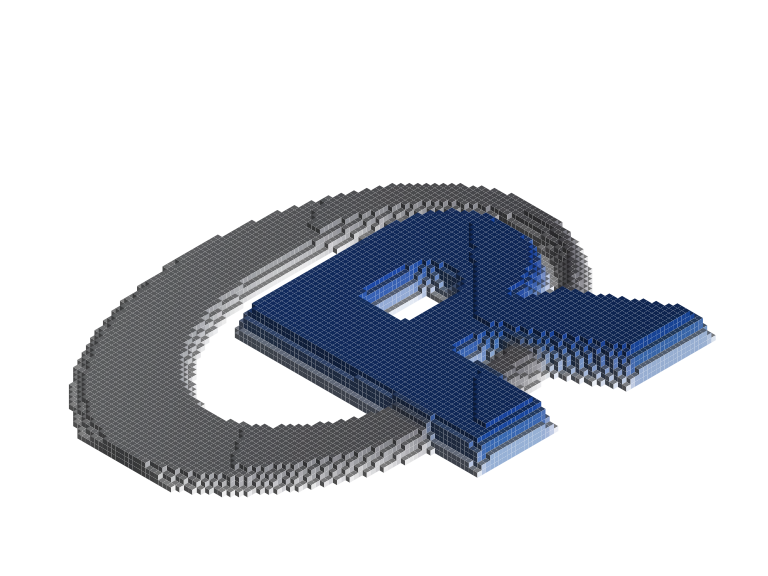
Image as isocubes
- Treat image to a heightmap
#~~~~~~~~~~~~~~~~~~~~~~~~~~~~~~~~~~~~~~~~~~~~~~~~~~~~~~~~~~~~~~~~~~~~~~~~~~~~~
# Load image and convert to a matrix of heights
#~~~~~~~~~~~~~~~~~~~~~~~~~~~~~~~~~~~~~~~~~~~~~~~~~~~~~~~~~~~~~~~~~~~~~~~~~~~~~
img <- png::readPNG("man/figures/Rlogo-small-blur.png")
ht        <- round( 10 * (1 - img[,,2]) ) # Use Green channel intensity as height
ht[,1]    <- 0 # image editing to remove some artefacts

#~~~~~~~~~~~~~~~~~~~~~~~~~~~~~~~~~~~~~~~~~~~~~~~~~~~~~~~~~~~~~~~~~~~~~~~~~~~~~
# A matrix of colours extracted from the image
#~~~~~~~~~~~~~~~~~~~~~~~~~~~~~~~~~~~~~~~~~~~~~~~~~~~~~~~~~~~~~~~~~~~~~~~~~~~~~
fill       <- rgb(img[,,1], img[,,2], img[,,3])
dim(fill)  <- dim(ht)

#~~~~~~~~~~~~~~~~~~~~~~~~~~~~~~~~~~~~~~~~~~~~~~~~~~~~~~~~~~~~~~~~~~~~~~~~~~~~~
# convert to cubes and draw
#~~~~~~~~~~~~~~~~~~~~~~~~~~~~~~~~~~~~~~~~~~~~~~~~~~~~~~~~~~~~~~~~~~~~~~~~~~~~~
coords <- calc_heightmap_coords(ht, fill = fill, ground = 'xy')
cubes  <- isocubesGrob(coords, size = 1.3, x = 0.4, y = 0, col = NA, intensity = c(0.6, 0.4, 1),
                       handedness = 'right')
grid.newpage(); grid.draw(cubes)
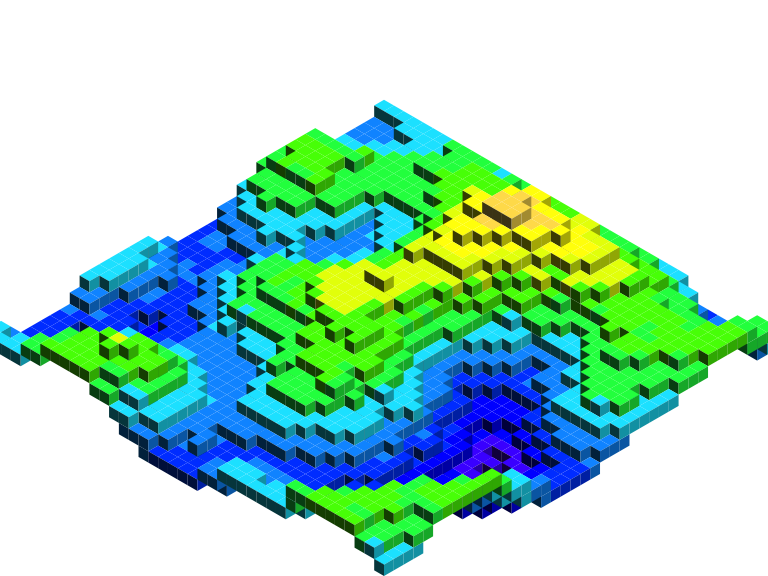
Generating terrain with ambient
library(grid)
library(ggplot2)
library(dplyr)
library(ambient)

#~~~~~~~~~~~~~~~~~~~~~~~~~~~~~~~~~~~~~~~~~~~~~~~~~~~~~~~~~~~~~~~~~~~~~~~~~~~~
# Create some perlin noise on an NxN grid
#~~~~~~~~~~~~~~~~~~~~~~~~~~~~~~~~~~~~~~~~~~~~~~~~~~~~~~~~~~~~~~~~~~~~~~~~~~~~
set.seed(3)
N <- 60

dat <- long_grid(x = seq(0, 10, length.out = N), y = seq(0, 10, length.out = N)) %>%
  mutate(
    noise =
      gen_perlin(x, y, frequency = 0.3) +
      gen_perlin(x, y, frequency = 2) / 10
  )

hm <- dat %>%
  mutate(
    x = x * 4,
    y = y * 4,
    z = noise * 8
  )

pal  <- topo.colors(11)
sy   <- as.integer(10 * (hm$z - min(hm$z)) / diff(range(hm$z))) + 1
cols <- pal[sy]

cubes  <- isocubesGrob(hm, size = 3, fill = cols, col = NA, y = 0)

grid.newpage(); grid.draw(cubes)
Technical bits
Visibility checks
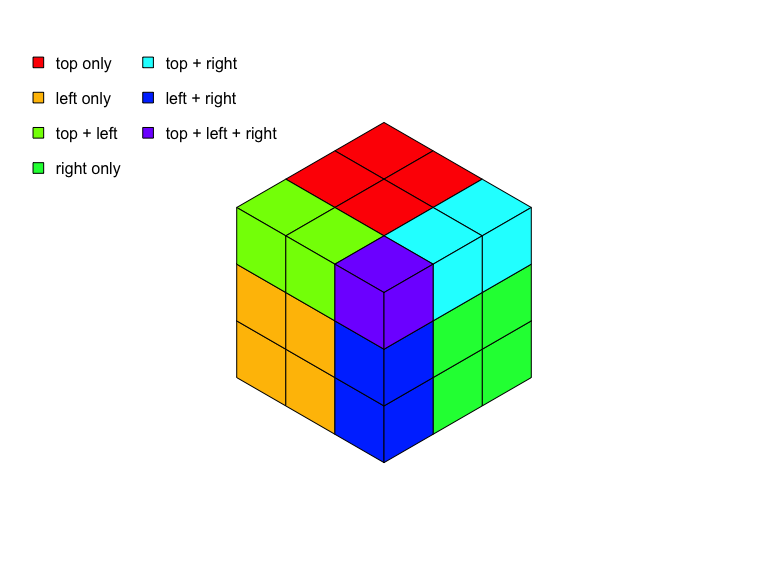
In order to speed up rendering, voxels which are hidden are not rendered.
In addition, to per-voxel visibility, the visibility of individual faces are also checked. This is done in C for speed.
Because faces can be partially hidden, depth-sorted rendering (Painters algorithm) is still required.
The figure below illustrates the results of the visibility calculation, showing how visible voxels may have 1, 2 or 3 faces visible. Also, there are 8-voxels removed from rendering because they are not visible from this viewpoint.
Coordinate system
The default coordinate system is a flat x,y plane with z directed up the page.

i.e. the xy-plane is flat and the z axis is oriented for a right-handed coordinate system.
The orientation of the xy-plane is set using the xyplane argument and
can be one of three values:
- Aligned with the
leftface of the isocube - Aligned with the
rightface of the isocube - Aligned with the
topface of the isocube (also calledflat)
There are two possible “handed-ness” settings:
leftfor left-handed coordinate systemrightfor right-handed coordinate system
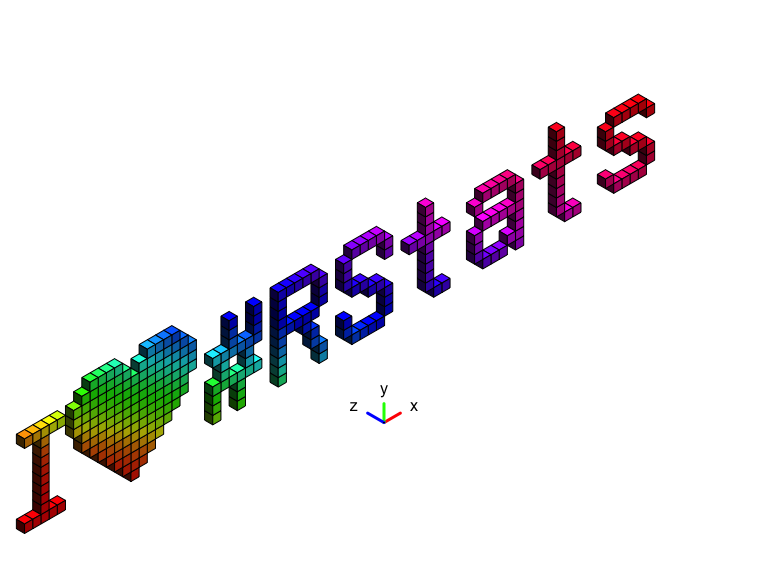
To help visually orient the axes, use isoaxesGrob() to add an axis
guide (directions for x,y,z are colored red,green,blue respectively).
library(grid)
library(isocubes)
library(lofifonts)

coords <- lofifonts::bitmap_text_coords('I\u2764#RStats')
coords$z <- 0

cols <- rainbow(nrow(coords))

cubes  <- isocubesGrob(
  coords, x = 0, y = 0, size = 2.5, fill = cols,
  xyplane = 'right', handedness = 'left'
)

grid.newpage();
grid.draw(cubes)

isoaxesGrob(xyplane = 'right', handedness = 'left', x = 0.5, y = 0.25) |>
  grid.draw()
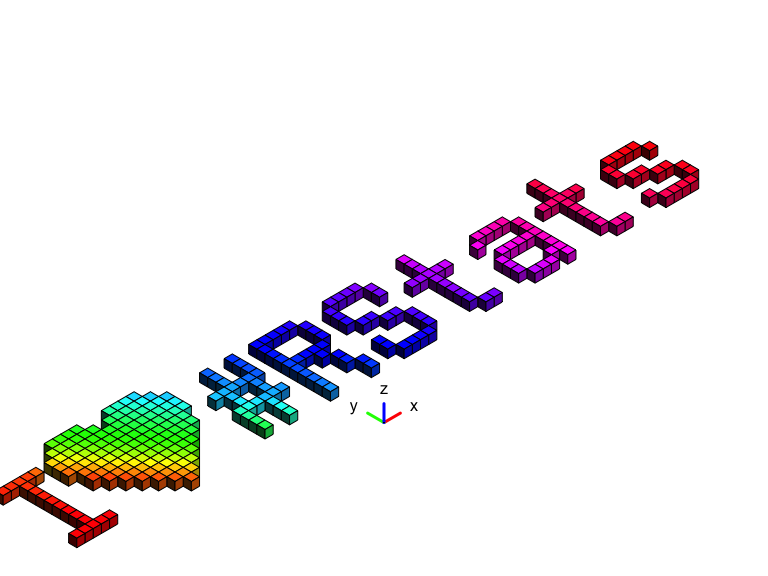
library(grid)
library(isocubes)
library(lofifonts)

coords <- lofifonts::bitmap_text_coords('I\u2764#RStats')
coords$z <- 0

cols <- rainbow(nrow(coords))

cubes  <- isocubesGrob(
  coords, x = 0.1, y = 0, size = 2.5, fill = cols,
  xyplane = 'flat', handedness = 'right'
)

grid.newpage();
grid.draw(cubes)


isoaxesGrob(xyplane = 'flat', handedness = 'right', x = 0.5, y = 0.25) |>
  grid.draw()
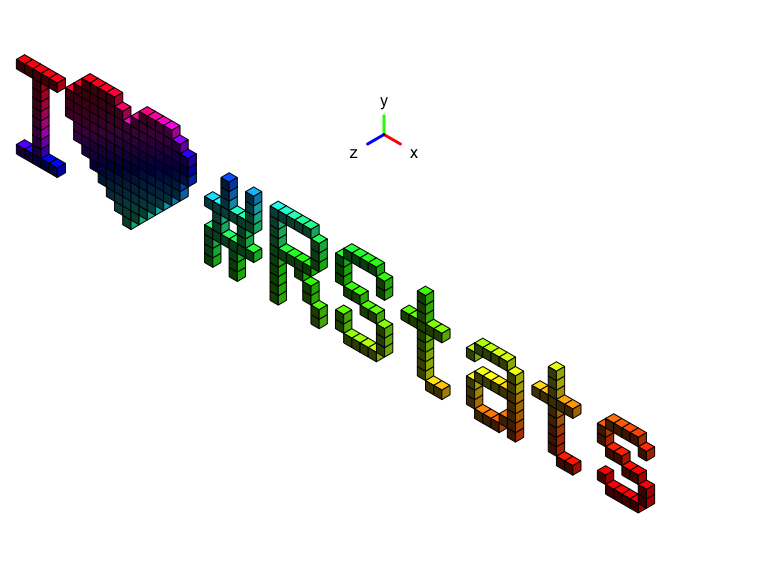
library(grid)
library(isocubes)
library(lofifonts)

coords <- lofifonts::bitmap_text_coords('I\u2764#RStats')
coords$z <- 0

cols <- rainbow(nrow(coords))

cubes  <- isocubesGrob(
  coords, x = 0, y = 0.7, size = 2.5, fill = cols,
  xyplane = 'left', handedness = 'right'
)

grid.newpage();
grid.draw(cubes)


isoaxesGrob(xyplane = 'left', handedness = 'right', x = 0.5, y = 0.75) |>
  grid.draw()
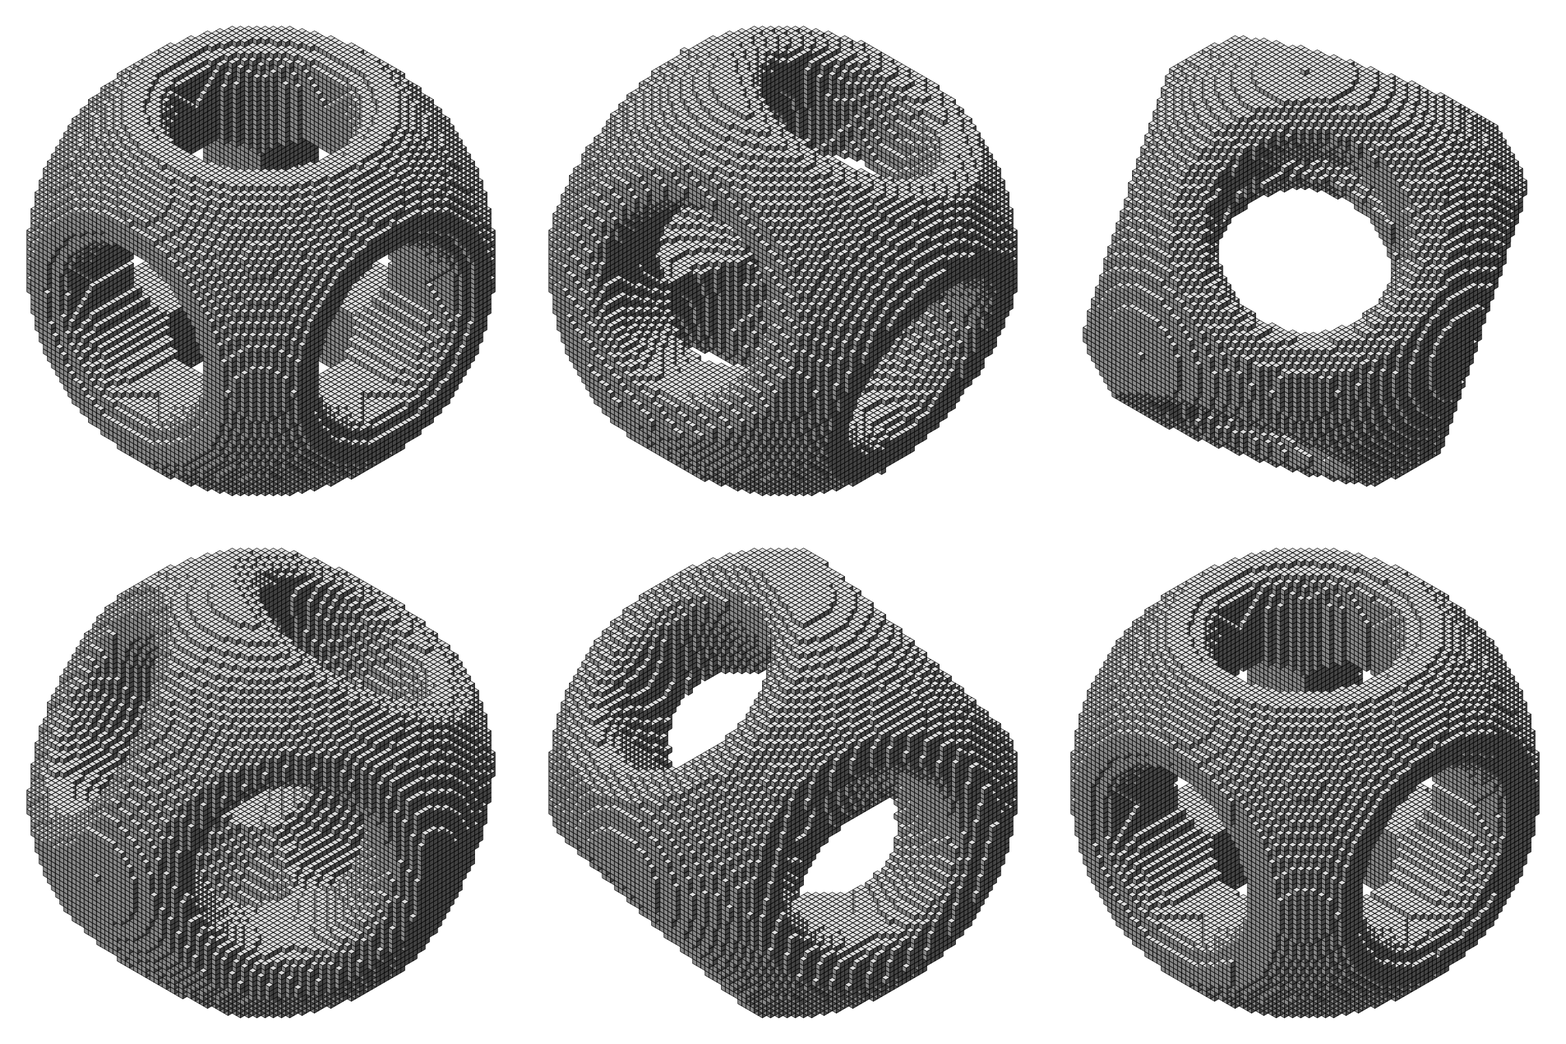
Advanced geometry - animated!
This object was created using Constructive Solid Geometry with Signed Distance Fields
See also
Contributors

89 commits
Similar repos



Languages
R
68.0%
HTML
17.3%
C
12.1%
CSS
1.7%
README
isocubes
isocubes is a voxel renderer
which uses isometric cubes as the 3D pixel element.
A voxel is a representation of a value on a three-dimensional regular grid i.e. the 3d equivalent of a 2d pixel.
The necessary constraints to make this a fast renderer are:
- voxels are rendered at integer coordinates only
- the isocube representation is always from a fxed viewpoint - these cubes do not rotate.
What’s in the box
isocubesGrob()- create isometric cubes to represent voxels at the given coordinates.isolinesGrob()- create isometric grids of lines. Useful to represent a ground plane.isopointsGrob()- create isometric grids of points. Useful to represent a ground planeisoaxesGrob()- create lines representing x,y,z axes. Useful to debug orientation issues.calc_heightmap_coords()calculate coordinates for a height-map from a matrix of values- Transforms:
coords_translate()coords_rotate()coords_align()a custom translation to align the edges or centroid of an object with a particular location e.g. to move the centroid of the object to the origin
- Example objects:
obj_letterThe letter ‘R’obj_organicAn organic shape
- Object generators:
gen_isosurface()generate voxel coordinates for the isosurface of an implicit functiongen_sphere()generate voxel coordinates for a sphere of the given radiusgen_cube()generate voxel coordinates for a cube of the given size
calc_visibility()perform visibility culling on a set of voxel coordinates - voxels hidden behind other voxels will be removed. This is done internally during isocube creation and is not needed for general use. Possibly useful if the voxels were to be rendered with a different backend e.g. nativeRaster
Installation
You can install the latest development version from GitHub with:
# install.package('remotes')
install.packages('colorfast')
remotes::install_github('coolbutuseless/isocubes')
Pre-built source/binary versions can also be installed from R-universe
install.packages('isocubes', repos = c('https://coolbutuseless.r-universe.dev', 'https://cloud.r-project.org'))
Letter ‘R’ in isocubes
library(grid)

# Coordinates for a letter 'R' included with this package
head(obj_letter)
#>   x  y z
#> 1 7 14 0
#> 2 6 14 0
#> 3 5 14 0
#> 4 4 14 0
#> 5 3 14 0
#> 6 2 14 0

cubes  <- isocubesGrob(obj_letter, size = 5, x = 0.4, y = 0.05)
gnd    <- isolinesGrob(size = 5, x = 0.4, y = 0.05, col = 'grey80')

# Draw background fill + isolines as ground + isocubes
grid.rect(gp = gpar(fill = 'deepskyblue3'))
grid.draw(gnd)
grid.draw(cubes)
# Change the relative intensity of the shading of each face
cubes  <- isocubesGrob(
  obj_letter, size = 5,
  x = 0.4, y = 0.05,
  xyplane = 'right',
  fill = 'lightblue', intensity = c(0.3, 1, 0.6)
)

grid.newpage(); grid.draw(cubes)
# Colour the cubes with rainbow
cubes <- isocubesGrob(obj_letter, fill = rainbow(nrow(obj_letter)), size = 5, x = 0.4, y = 0.05)
grid.newpage(); grid.draw(cubes)
# VaporWave palette
cubes <- isocubesGrob(obj_letter, fill = '#ff71ce', fill_left = '#01cdfe',
                      xyplane = 'right',
                      fill_right = '#05ffa1', size = 5, x = 0.4, y = 0.05)
grid.newpage(); grid.draw(cubes)
# Nightmare palette
cubes <- isocubesGrob(obj_letter,
                      fill = rainbow(nrow(obj_letter)),
                      fill_right = 'hotpink',
                      fill_left = viridisLite::inferno(nrow(obj_letter)),
                      size = 4,
                      x = 0.4, y = 0.2,
                      xyplane = 'left',
                      col = NA)
grid.newpage(); grid.draw(cubes)
Simple isosurface - a sphere
A data.frame with coordinates for a sphere can be generated with
gen_sphere()
library(grid)
library(isocubes)

coords <- gen_sphere(r = 12)
isocubesGrob(coords, size = 3, fill = rand_palette(nrow(coords), seed = 6)) |>
  grid::grid.draw()
Another isosurface
A fancy isosurface by Stephane Laurent
A data.frame with coordinates for this organic shape is included in the
package as obj_organic.
#~~~~~~~~~~~~~~~~~~~~~~~~~~~~~~~~~~~~~~~~~~~~~~~~~~~~~~~~~~~~~~~~~~~~~~~~~~~~
# Define the implicit function
#~~~~~~~~~~~~~~~~~~~~~~~~~~~~~~~~~~~~~~~~~~~~~~~~~~~~~~~~~~~~~~~~~~~~~~~~~~~~
A <- cospi(3/4); B <- sinpi(3/4)
f <- function(x, y, z) {
  z^4*B^2 + 4*x*y^2*A*B^2 + x*z^2*A*B^2 - 2*z^4*A - 4*x*y^2*B^2 - x*z^2*B^2 +
    3*z^2*A*B^2 - 2*z^4 - x*A*B^2 - 2*z^2*A + x*B^2 + A*B^2 + 2*z^2 - B^2
}


#~~~~~~~~~~~~~~~~~~~~~~~~~~~~~~~~~~~~~~~~~~~~~~~~~~~~~~~~~~~~~~~~~~~~~~~~~~~~
# Generate coordinates for this surface and transorm into a specific viewpoint
#~~~~~~~~~~~~~~~~~~~~~~~~~~~~~~~~~~~~~~~~~~~~~~~~~~~~~~~~~~~~~~~~~~~~~~~~~~~~
coords <- gen_isosurface(f, upper = 0, lower = -2, scale = 1/10, nx = 70) |>
  coord_rotate(-pi/2, 'y') |>
  coord_rotate(pi/2, 'z')

#~~~~~~~~~~~~~~~~~~~~~~~~~~~~~~~~~~~~~~~~~~~~~~~~~~~~~~~~~~~~~~~~~~~~~~~~~~~~
# Further filter the voxels to lie within spherical bound
#~~~~~~~~~~~~~~~~~~~~~~~~~~~~~~~~~~~~~~~~~~~~~~~~~~~~~~~~~~~~~~~~~~~~~~~~~~~~
coords <- coords[with(coords, x^2 + y^2 + z^2 < 10^3),]

#~~~~~~~~~~~~~~~~~~~~~~~~~~~~~~~~~~~~~~~~~~~~~~~~~~~~~~~~~~~~~~~~~~~~~~~~~~~~
# Gererate some colors
#~~~~~~~~~~~~~~~~~~~~~~~~~~~~~~~~~~~~~~~~~~~~~~~~~~~~~~~~~~~~~~~~~~~~~~~~~~~~
coords$fill <-  rgb(red = 1 + coords$x/31, 1 + coords$y/31, 1 + coords$z/31, maxColorValue = 2)

#~~~~~~~~~~~~~~~~~~~~~~~~~~~~~~~~~~~~~~~~~~~~~~~~~~~~~~~~~~~~~~~~~~~~~~~~~~~~
# Render the voxels as isocubes
#~~~~~~~~~~~~~~~~~~~~~~~~~~~~~~~~~~~~~~~~~~~~~~~~~~~~~~~~~~~~~~~~~~~~~~~~~~~~
grid::grid.newpage()
isocubesGrob(coords, size = 2) |>
  grid::grid.draw()
Random rainbow volume of isocubes
library(grid)
library(isocubes)
set.seed(1)

N      <- 15
coords <- expand.grid(x=0:N, y=0:N, z=0:N)
coords <- coords[sample(nrow(coords), 0.66 * nrow(coords)),]
fill   <- rgb(red = coords$z / N, 1 - coords$y / N, 1 - coords$x/N, maxColorValue = 1)

cubes <- isocubesGrob(coords, fill, size = 4, y = 0.05)
grid.newpage(); grid.draw(cubes)
Heightmap as isocubes
#~~~~~~~~~~~~~~~~~~~~~~~~~~~~~~~~~~~~~~~~~~~~~~~~~~~~~~~~~~~~~~~~~~~~~~~~~~~~~
# Prepare a matrix of values
#~~~~~~~~~~~~~~~~~~~~~~~~~~~~~~~~~~~~~~~~~~~~~~~~~~~~~~~~~~~~~~~~~~~~~~~~~~~~~
mat <- volcano

#~~~~~~~~~~~~~~~~~~~~~~~~~~~~~~~~~~~~~~~~~~~~~~~~~~~~~~~~~~~~~~~~~~~~~~~~~~~~~
# An optional matrix of colours
#~~~~~~~~~~~~~~~~~~~~~~~~~~~~~~~~~~~~~~~~~~~~~~~~~~~~~~~~~~~~~~~~~~~~~~~~~~~~~
val <- as.vector(mat)
val <- round(255 * (val - min(val)) / diff(range(val)))
fill <- terrain.colors(256)[val + 1L]
dim(fill) <- dim(mat)

#~~~~~~~~~~~~~~~~~~~~~~~~~~~~~~~~~~~~~~~~~~~~~~~~~~~~~~~~~~~~~~~~~~~~~~~~~~~~~
# Find the (integer) coordiinates of the cubes in the heightmap
#~~~~~~~~~~~~~~~~~~~~~~~~~~~~~~~~~~~~~~~~~~~~~~~~~~~~~~~~~~~~~~~~~~~~~~~~~~~~~
coords <- calc_heightmap_coords(mat - min(mat), fill = fill, scale = 0.3)

#~~~~~~~~~~~~~~~~~~~~~~~~~~~~~~~~~~~~~~~~~~~~~~~~~~~~~~~~~~~~~~~~~~~~~~~~~~~~~
# Convert the coordinates into a grob
#~~~~~~~~~~~~~~~~~~~~~~~~~~~~~~~~~~~~~~~~~~~~~~~~~~~~~~~~~~~~~~~~~~~~~~~~~~~~~
cubes  <- isocubesGrob(coords, size = 1.5, x = 0.65, y = 0)
grid.newpage(); grid.draw(cubes)
Image as isocubes
- Treat image to a heightmap
#~~~~~~~~~~~~~~~~~~~~~~~~~~~~~~~~~~~~~~~~~~~~~~~~~~~~~~~~~~~~~~~~~~~~~~~~~~~~~
# Load image and convert to a matrix of heights
#~~~~~~~~~~~~~~~~~~~~~~~~~~~~~~~~~~~~~~~~~~~~~~~~~~~~~~~~~~~~~~~~~~~~~~~~~~~~~
img <- png::readPNG("man/figures/Rlogo-small-blur.png")
ht        <- round( 10 * (1 - img[,,2]) ) # Use Green channel intensity as height
ht[,1]    <- 0 # image editing to remove some artefacts

#~~~~~~~~~~~~~~~~~~~~~~~~~~~~~~~~~~~~~~~~~~~~~~~~~~~~~~~~~~~~~~~~~~~~~~~~~~~~~
# A matrix of colours extracted from the image
#~~~~~~~~~~~~~~~~~~~~~~~~~~~~~~~~~~~~~~~~~~~~~~~~~~~~~~~~~~~~~~~~~~~~~~~~~~~~~
fill       <- rgb(img[,,1], img[,,2], img[,,3])
dim(fill)  <- dim(ht)

#~~~~~~~~~~~~~~~~~~~~~~~~~~~~~~~~~~~~~~~~~~~~~~~~~~~~~~~~~~~~~~~~~~~~~~~~~~~~~
# convert to cubes and draw
#~~~~~~~~~~~~~~~~~~~~~~~~~~~~~~~~~~~~~~~~~~~~~~~~~~~~~~~~~~~~~~~~~~~~~~~~~~~~~
coords <- calc_heightmap_coords(ht, fill = fill, ground = 'xy')
cubes  <- isocubesGrob(coords, size = 1.3, x = 0.4, y = 0, col = NA, intensity = c(0.6, 0.4, 1),
                       handedness = 'right')
grid.newpage(); grid.draw(cubes)
Generating terrain with ambient
library(grid)
library(ggplot2)
library(dplyr)
library(ambient)

#~~~~~~~~~~~~~~~~~~~~~~~~~~~~~~~~~~~~~~~~~~~~~~~~~~~~~~~~~~~~~~~~~~~~~~~~~~~~
# Create some perlin noise on an NxN grid
#~~~~~~~~~~~~~~~~~~~~~~~~~~~~~~~~~~~~~~~~~~~~~~~~~~~~~~~~~~~~~~~~~~~~~~~~~~~~
set.seed(3)
N <- 60

dat <- long_grid(x = seq(0, 10, length.out = N), y = seq(0, 10, length.out = N)) %>%
  mutate(
    noise =
      gen_perlin(x, y, frequency = 0.3) +
      gen_perlin(x, y, frequency = 2) / 10
  )

hm <- dat %>%
  mutate(
    x = x * 4,
    y = y * 4,
    z = noise * 8
  )

pal  <- topo.colors(11)
sy   <- as.integer(10 * (hm$z - min(hm$z)) / diff(range(hm$z))) + 1
cols <- pal[sy]

cubes  <- isocubesGrob(hm, size = 3, fill = cols, col = NA, y = 0)

grid.newpage(); grid.draw(cubes)
Technical bits
Visibility checks
In order to speed up rendering, voxels which are hidden are not rendered.
In addition, to per-voxel visibility, the visibility of individual faces are also checked. This is done in C for speed.
Because faces can be partially hidden, depth-sorted rendering (Painters algorithm) is still required.
The figure below illustrates the results of the visibility calculation, showing how visible voxels may have 1, 2 or 3 faces visible. Also, there are 8-voxels removed from rendering because they are not visible from this viewpoint.
Coordinate system
The default coordinate system is a flat x,y plane with z directed up the page.
i.e. the xy-plane is flat and the z axis is oriented for a right-handed coordinate system.
The orientation of the xy-plane is set using the xyplane argument and
can be one of three values:
- Aligned with the
leftface of the isocube - Aligned with the
rightface of the isocube - Aligned with the
topface of the isocube (also calledflat)
There are two possible “handed-ness” settings:
leftfor left-handed coordinate systemrightfor right-handed coordinate system
To help visually orient the axes, use isoaxesGrob() to add an axis
guide (directions for x,y,z are colored red,green,blue respectively).
library(grid)
library(isocubes)
library(lofifonts)

coords <- lofifonts::bitmap_text_coords('I\u2764#RStats')
coords$z <- 0

cols <- rainbow(nrow(coords))

cubes  <- isocubesGrob(
  coords, x = 0, y = 0, size = 2.5, fill = cols,
  xyplane = 'right', handedness = 'left'
)

grid.newpage();
grid.draw(cubes)

isoaxesGrob(xyplane = 'right', handedness = 'left', x = 0.5, y = 0.25) |>
  grid.draw()
library(grid)
library(isocubes)
library(lofifonts)

coords <- lofifonts::bitmap_text_coords('I\u2764#RStats')
coords$z <- 0

cols <- rainbow(nrow(coords))

cubes  <- isocubesGrob(
  coords, x = 0.1, y = 0, size = 2.5, fill = cols,
  xyplane = 'flat', handedness = 'right'
)

grid.newpage();
grid.draw(cubes)


isoaxesGrob(xyplane = 'flat', handedness = 'right', x = 0.5, y = 0.25) |>
  grid.draw()
library(grid)
library(isocubes)
library(lofifonts)

coords <- lofifonts::bitmap_text_coords('I\u2764#RStats')
coords$z <- 0

cols <- rainbow(nrow(coords))

cubes  <- isocubesGrob(
  coords, x = 0, y = 0.7, size = 2.5, fill = cols,
  xyplane = 'left', handedness = 'right'
)

grid.newpage();
grid.draw(cubes)


isoaxesGrob(xyplane = 'left', handedness = 'right', x = 0.5, y = 0.75) |>
  grid.draw()
Advanced geometry - animated!
This object was created using Constructive Solid Geometry with Signed Distance Fields
See also
Similar repos
Contributors
89 commits
Languages
R
68.0%
HTML
17.3%
C
12.1%
CSS
1.7%