
Find code blocking your Tokio workers. eBPF-powered, no instrumentation.
Rust
199
185 commits
updated Apr 20, 2026
README
hud



Find what's blocking your Tokio runtime. Zero-instrumentation eBPF profiler.
Linux only. This tool uses eBPF, which is a Linux kernel feature. It does not work on macOS or Windows.
The Problem
Tokio uses cooperative scheduling. Tasks yield at .await points, trusting that work between awaits is fast. When it isn't—CPU-heavy code, sync I/O, blocking locks—one task starves the rest.
These bugs are silent. No errors, no panics—just degraded throughput. hud makes them visible.
How It Works
Watches the Linux scheduler via eBPF. When a worker thread experiences high OS-level scheduling latency (time the thread waits in the kernel run queue, not Tokio's task queue), captures a stack trace. High scheduling latency is a symptom of blocking—when one task monopolizes a worker, others queue up waiting.
Why hud?
Unlike tokio-console or tokio-blocked, hud requires no code changes—attach to any running Tokio process.
Why not just use tokio-console? It's the official tool and more accurate—it measures actual task poll durations. Use it if you can. But it requires adding console-subscriber and rebuilding.
What about Tokio's unstable blocking detection? Compile with RUSTFLAGS="--cfg tokio_unstable" and Tokio warns when task polls exceed a threshold. This catches the blocker directly, not victims—more accurate than hud. But it requires a rebuild, and only catches blocks exceeding the threshold during that run.
hud exists for profiling without code changes or rebuilds—staging environments, load testing, quick triage of a running process, or confirming blocking is even the problem before investing in instrumentation.
When to use what
| Tool | Best for | Trade-off |
|---|---|---|
| hud | Quick triage of running processes | Measures symptoms, not direct cause |
| Tokio unstable detection | Find the blocker directly | Requires rebuild with tokio_unstable |
| tokio-console | Precise task poll times | Requires code instrumentation |
| perf + flamegraphs | CPU profiling, broad analysis | Manual interpretation needed |
| Custom metrics | Production monitoring | Must know where to instrument |
Use hud to narrow down suspects, then dig deeper with instrumentation if needed.
Requirements
System:
- Linux 5.8+
- x86_64 or aarch64 architecture
- Root privileges
Your application needs debug symbols (so hud can show function names):
# Cargo.toml
[profile.release]
debug = true
frame-pointers = "force-on"
debug = trueadds ~10-20% to binary size.frame-pointersadds ~1-2% runtime overhead. For production, you can swap in a debug-enabled binary temporarily for investigation.
Install
Option A: Pre-built binary (no Rust toolchain needed)
curl -L https://github.com/cong-or/hud/releases/latest/download/hud-linux-x86_64.tar.gz | tar xz
sudo ./hud my-app
Option B: Build from source
git clone https://github.com/cong-or/hud.git && cd hud
cargo xtask build-ebpf --release && cargo build --release
sudo ./target/release/hud my-app
Usage
# Profile by process name
sudo hud my-app

# Profile by PID
sudo hud --pid 1234

# Custom blocking threshold (default: 5ms)
sudo hud my-app --threshold 10   # less sensitive
sudo hud my-app --threshold 1    # more sensitive

# Rolling time window (only show last N seconds)
sudo hud my-app --window 30      # metrics decay when load stops

# Custom Tokio thread names are auto-detected. Override if needed:
sudo hud my-app --workers my-io-worker

# Headless mode (CI/scripting) - run for 60 seconds then exit
sudo hud my-app --headless --export trace.json --duration 60
See Tuning for threshold selection guide.
Demo
Try hud with the included demo server (requires Option B):
# Build demo server - MUST be debug build (release inlines functions)
cargo build --example demo-server
./target/debug/examples/demo-server &

# Profile it (auto-detects PID and binary)
sudo ./target/release/hud demo-server

# Generate load (another terminal)
./hud/examples/load.sh
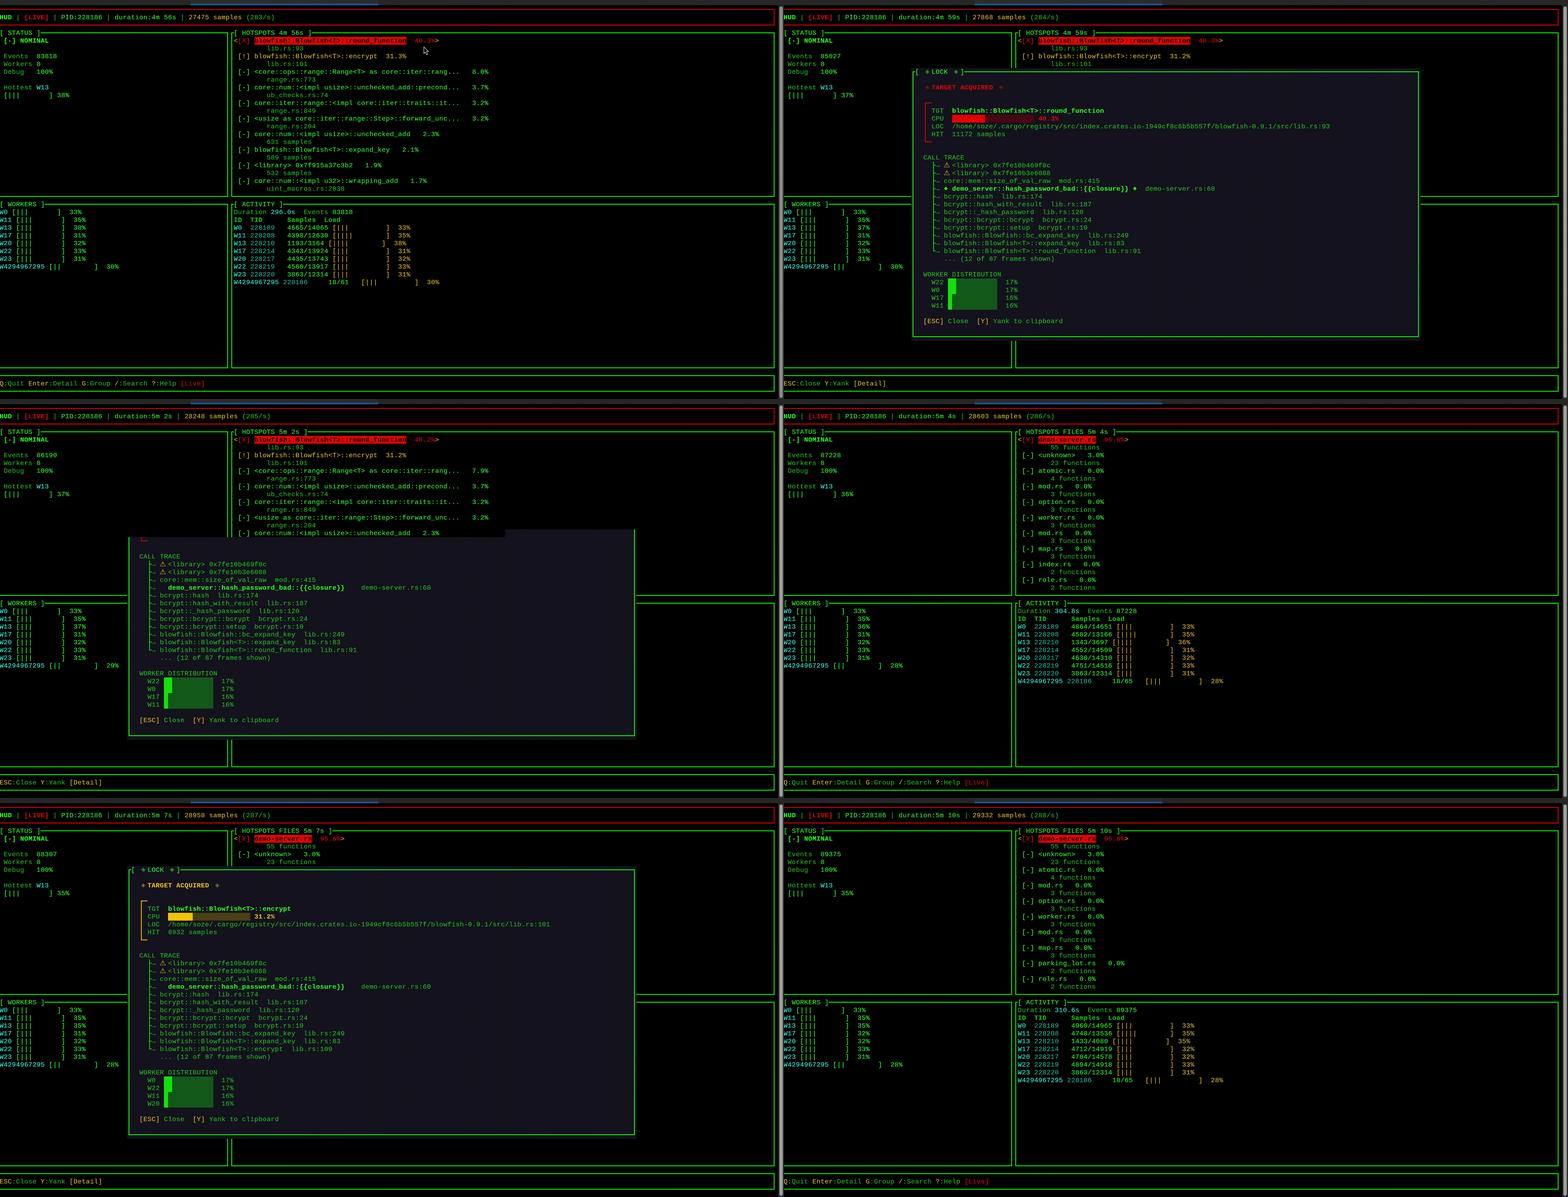
The demo server has intentionally blocking endpoints (/hash, /compress, /read, /dns). You'll see bcrypt and blowfish hotspots from the /hash endpoint, with demo-server.rs highlighted as the entry point in call traces.
Important: The demo-server must be a debug build. Release builds aggressively inline functions, hiding your code from stack traces. If you don't see
demo-server.rsin drilldowns, rebuild without--release.
Press Q to quit hud.
Limitations
- Measures scheduling latency (a symptom of blocking), not blocking directly
- Captures the victim's stack, not the blocker's—if Task A blocks causing Task B to wait, you see Task B's stack. Look for patterns across multiple traces.
- System CPU pressure can cause false positives—look for consistent, repeatable traces
- Lock contention where threads sleep (not spin) may not appear
- Tokio 1.x only. Worker detection tries the default thread name prefix, then stack-based classification (looks for Tokio scheduler frames), then largest thread group heuristic. Use
--workers <prefix>to skip auto-detection - See Troubleshooting for common issues
Docs
- Tuning — Threshold selection, debugging workflow
- Exports — JSON format, before/after analysis
- Troubleshooting — Common issues
- Architecture — How it works internally
- Development — Contributing
Further Reading
- Async: What is blocking? — Alice Ryhl's deep dive on blocking in async Rust
- tokio::task::spawn_blocking — Offload blocking I/O to a thread pool
- rayon — For parallelizable CPU work; call from within
spawn_blocking, not directly from async code - Reducing tail latencies with automatic cooperative task yielding — Tokio's approach to preemption
License
MIT or Apache-2.0
Contributors


Similar repos


Languages
Rust
99.8%
Find code blocking your Tokio workers. eBPF-powered, no instrumentation.
Rust
199
185 commits
updated Apr 20, 2026
README
hud
Find what's blocking your Tokio runtime. Zero-instrumentation eBPF profiler.
Linux only. This tool uses eBPF, which is a Linux kernel feature. It does not work on macOS or Windows.
The Problem
Tokio uses cooperative scheduling. Tasks yield at .await points, trusting that work between awaits is fast. When it isn't—CPU-heavy code, sync I/O, blocking locks—one task starves the rest.
These bugs are silent. No errors, no panics—just degraded throughput. hud makes them visible.
How It Works
Watches the Linux scheduler via eBPF. When a worker thread experiences high OS-level scheduling latency (time the thread waits in the kernel run queue, not Tokio's task queue), captures a stack trace. High scheduling latency is a symptom of blocking—when one task monopolizes a worker, others queue up waiting.
Why hud?
Unlike tokio-console or tokio-blocked, hud requires no code changes—attach to any running Tokio process.
Why not just use tokio-console? It's the official tool and more accurate—it measures actual task poll durations. Use it if you can. But it requires adding console-subscriber and rebuilding.
What about Tokio's unstable blocking detection? Compile with RUSTFLAGS="--cfg tokio_unstable" and Tokio warns when task polls exceed a threshold. This catches the blocker directly, not victims—more accurate than hud. But it requires a rebuild, and only catches blocks exceeding the threshold during that run.
hud exists for profiling without code changes or rebuilds—staging environments, load testing, quick triage of a running process, or confirming blocking is even the problem before investing in instrumentation.
When to use what
| Tool | Best for | Trade-off |
|---|---|---|
| hud | Quick triage of running processes | Measures symptoms, not direct cause |
| Tokio unstable detection | Find the blocker directly | Requires rebuild with tokio_unstable |
| tokio-console | Precise task poll times | Requires code instrumentation |
| perf + flamegraphs | CPU profiling, broad analysis | Manual interpretation needed |
| Custom metrics | Production monitoring | Must know where to instrument |
Use hud to narrow down suspects, then dig deeper with instrumentation if needed.
Requirements
System:
- Linux 5.8+
- x86_64 or aarch64 architecture
- Root privileges
Your application needs debug symbols (so hud can show function names):
# Cargo.toml
[profile.release]
debug = true
frame-pointers = "force-on"
debug = trueadds ~10-20% to binary size.frame-pointersadds ~1-2% runtime overhead. For production, you can swap in a debug-enabled binary temporarily for investigation.
Install
Option A: Pre-built binary (no Rust toolchain needed)
curl -L https://github.com/cong-or/hud/releases/latest/download/hud-linux-x86_64.tar.gz | tar xz
sudo ./hud my-app
Option B: Build from source
git clone https://github.com/cong-or/hud.git && cd hud
cargo xtask build-ebpf --release && cargo build --release
sudo ./target/release/hud my-app
Usage
# Profile by process name
sudo hud my-app

# Profile by PID
sudo hud --pid 1234

# Custom blocking threshold (default: 5ms)
sudo hud my-app --threshold 10   # less sensitive
sudo hud my-app --threshold 1    # more sensitive

# Rolling time window (only show last N seconds)
sudo hud my-app --window 30      # metrics decay when load stops

# Custom Tokio thread names are auto-detected. Override if needed:
sudo hud my-app --workers my-io-worker

# Headless mode (CI/scripting) - run for 60 seconds then exit
sudo hud my-app --headless --export trace.json --duration 60
See Tuning for threshold selection guide.
Demo
Try hud with the included demo server (requires Option B):
# Build demo server - MUST be debug build (release inlines functions)
cargo build --example demo-server
./target/debug/examples/demo-server &

# Profile it (auto-detects PID and binary)
sudo ./target/release/hud demo-server

# Generate load (another terminal)
./hud/examples/load.sh
The demo server has intentionally blocking endpoints (/hash, /compress, /read, /dns). You'll see bcrypt and blowfish hotspots from the /hash endpoint, with demo-server.rs highlighted as the entry point in call traces.
Important: The demo-server must be a debug build. Release builds aggressively inline functions, hiding your code from stack traces. If you don't see
demo-server.rsin drilldowns, rebuild without--release.
Press Q to quit hud.
Limitations
- Measures scheduling latency (a symptom of blocking), not blocking directly
- Captures the victim's stack, not the blocker's—if Task A blocks causing Task B to wait, you see Task B's stack. Look for patterns across multiple traces.
- System CPU pressure can cause false positives—look for consistent, repeatable traces
- Lock contention where threads sleep (not spin) may not appear
- Tokio 1.x only. Worker detection tries the default thread name prefix, then stack-based classification (looks for Tokio scheduler frames), then largest thread group heuristic. Use
--workers <prefix>to skip auto-detection - See Troubleshooting for common issues
Docs
- Tuning — Threshold selection, debugging workflow
- Exports — JSON format, before/after analysis
- Troubleshooting — Common issues
- Architecture — How it works internally
- Development — Contributing
Further Reading
- Async: What is blocking? — Alice Ryhl's deep dive on blocking in async Rust
- tokio::task::spawn_blocking — Offload blocking I/O to a thread pool
- rayon — For parallelizable CPU work; call from within
spawn_blocking, not directly from async code - Reducing tail latencies with automatic cooperative task yielding — Tokio's approach to preemption
License
MIT or Apache-2.0
Similar repos
Contributors
Languages
Rust
99.8%