
Records every process and file access in a build and shows it as an interactive timeline
22
stars
92
commits
Rust
primary language
Sep 12, 2026
updated
README



What is Buildprof?
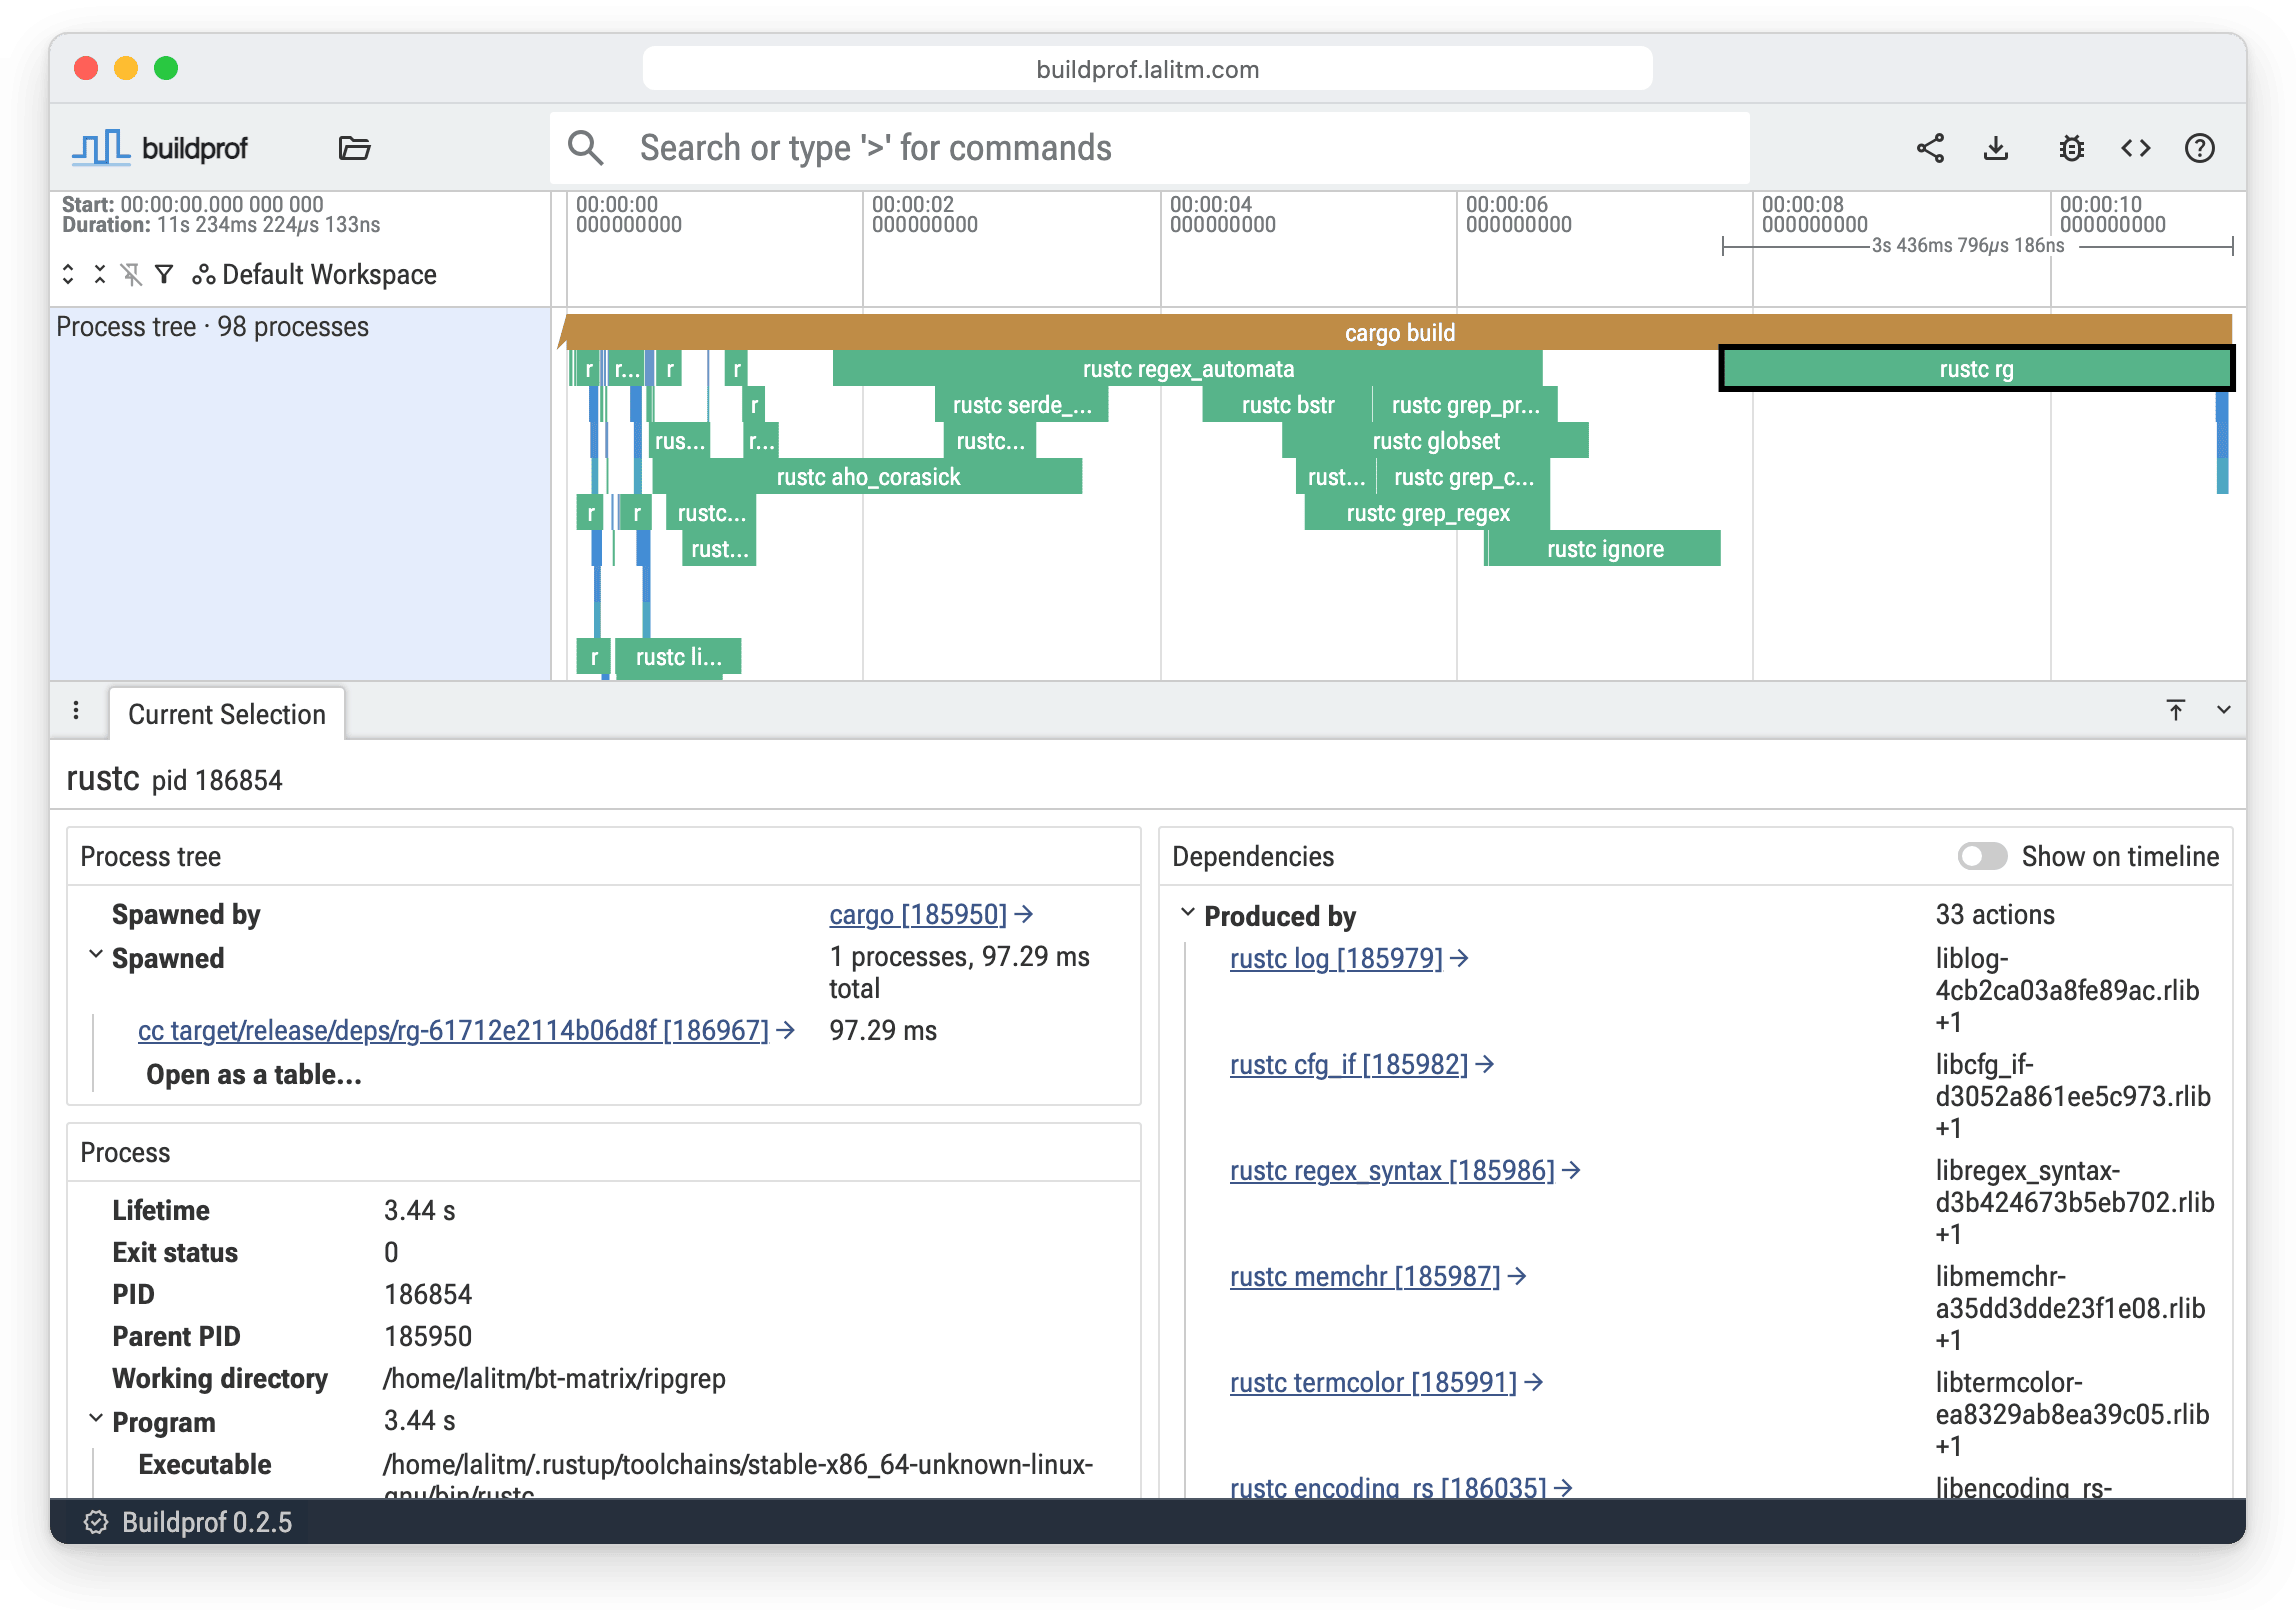
Buildprof traces every process a Linux build launches and turns the recording
into an interactive timeline you can explore in the browser. Put buildprof --
in front of your build command to get started.
- See the whole build. Find expensive commands, gaps in parallelism, and work that starts unexpectedly late across Make, Ninja, CMake, Meson, Cargo, Go, and shell scripts.
- Follow the files. Inspect commands, working directories, and exit statuses, then follow inputs back to the processes that produced them.
- Look inside compilers. Optionally add internal timing data from Clang, LLD, and nightly Rust alongside the process timeline.
Recording requires Linux. You can explore recordings on any platform in the web UI; trace data stays in your browser.
Try it in your browser
Explore a clean ripgrep release build without installing anything. Click the screenshot to open the recording, or follow the guided tour.
Quick start
1. Install Buildprof
On the Linux machine that runs your build:
curl -fsSL https://buildprof.lalitm.com/install.sh | sh
Prefer a package manager? See Install for Homebrew, mise, Cargo, and Linux packages.
2. Record a build
In your project directory, put buildprof -- in front of your usual build
command:
buildprof -- make -j8
Replace make -j8 with your build command, such as cargo build or
ninja -C out. Bazel, Gradle, Buck2, and other build systems with a daemon
need a slightly different command.
3. Explore the recording
When the build finishes, the recording is saved as output.buildprof and
opens in your browser. Allow the one-time prompt to access other apps and
services on this device: that is the page fetching the recording from
localhost. Nothing is ever uploaded.
Start with the longest commands and gaps in parallelism. The investigation guide walks through finding bottlenecks, following file dependencies, and checking whether a change helped. For builds over SSH, see Builds on a remote machine.
Why use Buildprof?
Build tools generally explain only the work they manage themselves. Cargo
timings cannot break down an arbitrary build.rs script; Ninja cannot see
inside commands it launches; compiler traces describe one compiler invocation
rather than the build around it.
Buildprof follows the complete process tree, so the same view includes the build system, compilers, linkers, code generators, and arbitrary tools launched along the way. You can see how their work fits together and where the build spends its time.
Install
Install on your Linux build machine using whichever method you prefer.
Shell installer:
curl -fsSL https://buildprof.lalitm.com/install.sh | sh
Homebrew:
brew install lalitmaganti/tap/buildprof
mise:
mise use -g github:LalitMaganti/buildprof
Cargo (builds from source; needs Rust 1.91 or newer):
cargo install --locked buildprof
Debian, Ubuntu, Fedora, and other .deb or .rpm distributions: download
the package for your architecture from the
latest release
and install it with apt install ./buildprof_*.deb or
dnf install ./buildprof-*.rpm.
Tarballs: the same release page carries prebuilt binaries for x86_64 and aarch64 Linux, both glibc and static musl.
Requirements
Recording builds is currently supported on Linux only. The kernel or
container configuration must permit tracing child processes: Docker needs
--cap-add SYS_PTRACE, kernel.yama.ptrace_scope must be below 3, and
gVisor-style sandboxes cannot trace at all. Installing from source needs Rust
1.91 or newer.
Existing recordings can be viewed on any platform in the web UI, without installing Buildprof. Viewing a recording does not require the same operating system it was recorded on.
Usage
Recording a build
Put buildprof -- in front of the build command. Choose another output path
or disable automatic opening when needed:
buildprof -o clean-build.buildprof --no-open -- ninja -C out
Opening recordings
Open an existing recording later with:
buildprof open clean-build.buildprof
buildprof.lalitm.com only delivers the UI itself. Your browser fetches the recording from localhost and processes it entirely in the page; no trace data leaves your machine.
Because the page comes from buildprof.lalitm.com and the recording from
localhost, the browser asks once whether the site may access other apps and
services on this device. Allow it. If you block it, the trace never loads. To
recover, allow it again in the site settings next to the address bar, under
"Apps on device" in Chrome or "Access this device" in Firefox, then run
buildprof open again.
Recordings contain command lines and filesystem paths. Review them before sending them to anyone.
Builds on a remote machine
Over SSH there is no browser to launch, so Buildprof prints the port forward to run from your own machine instead and waits for the browser to fetch the trace:
ssh -L 9001:127.0.0.1:9001 user@buildhost
VS Code Remote and JetBrains Gateway forward the port automatically. The wait
gives up after ten minutes; adjust it with --wait <SECONDS>, where 0 waits
forever. Alternatively, copy the recording to your own machine and open it
in the web UI. No local installation is needed
for viewing.
Collection options
Process creation, commands, and timing are always recorded. File opens and renames are also recorded by default; to reduce overhead on builds with lots of filesystem activity, disable that layer:
buildprof --no-file-events -- make -j6
The process timeline remains available, but file lists and producer/consumer links are unavailable. This skips filesystem interception itself, rather than collecting and discarding events. The UI identifies recordings made this way.
Compiler details
Process timing is usually the right level for understanding a build. When a particular compiler or linker invocation needs a closer look, enable compiler tracing:
buildprof --compiler-traces -- cargo build
Buildprof currently imports Clang -ftime-trace, explicitly selected LLD
--time-trace, and nightly Rust self-profile data. These events appear as a
summary of active compiler threads with expandable per-thread phase tracks.
Compiler tracing can be combined with process-only recording:
buildprof --no-file-events --compiler-traces -- ninja -C build
A build which invokes Clang through an absolute path currently bypasses compiler tracing. Buildprof will still record the compiler process, but its Clang and LLD internal phases will be absent.
Compiler tracing can also change compiler cache keys or turn cache hits into misses. Existing Rust compiler wrappers remain in the invocation chain, but cache preservation is not guaranteed in this mode.
Build systems
Buildprof follows the process tree, so it does not need to understand the build system. These are exercised by the conformance suite on every change:
- Make: compiles, archiving, linking, and renamed outputs.
- CMake with Ninja: the configure step and the Ninja build.
- Meson with Ninja: the setup step and the Ninja build.
- Cargo:
rustcinvocations and linking; nightly self-profile data with--compiler-traces. - Go: compile, assemble, and link.
Anything else that runs as a child process is recorded the same way: shell scripts, code generators, wrapper scripts, and tools launched by the build.
Daemon build systems
Work handed to a daemon or a remote executor happens outside the process tree and is not visible. If the daemon is already running, the recording shows only the client; if the recorded command starts it, the recording continues until the daemon exits. Run without the daemon, or stop it before and after the build:
bazel shutdown && buildprof -- sh -c 'bazel build //... ; bazel shutdown'
buildprof -- ./gradlew --no-daemon build
buck2 kill && buildprof -- sh -c 'buck2 build //... ; buck2 kill'
sccache --stop-server && buildprof -- sh -c 'cargo build; sccache --stop-server'
How it works
On Linux, Buildprof launches the command under ptrace and follows process
creation, execution, and exit through the complete descendant tree. A seccomp
filter lets it stop only for the filesystem operations it records instead of
paying the cost of intercepting every system call.
The recorder writes a Perfetto protobuf trace directly. Perfetto provides the storage format, query engine, and core timeline interactions; Buildprof adds the build-specific view on top, including process ancestry, command types, concurrency, file relationships, and optional compiler timing data.
Backwards compatibility
Before 1.0, the CLI and the UI move in lockstep at the minor version: a recording is meant to be viewed in a UI from the same 0.x series, and patch releases never change the trace format. Every UI version stays deployed under its own path, the CLI opens the one matching its version, and the UI links to the matching series when it is handed a recording from a different one, so nothing stops working, but the trace format may change between minor releases.
From 1.0 onward, the trace format is stable and compatibility is permanent: any recording opens in every later UI, and newer UIs simply add features on top of older recordings.
Self-hosting the UI
Each release attaches buildprof-ui-v<version>.tar.zst, the complete UI as
static files. Serve its contents from any web server and point the CLI at it:
buildprof open --url https://ui.example.internal/v0.2.0 clean-build.buildprof
Development
See CONTRIBUTING.md for the layout and the UI workflow. Run the complete conformance suite in the Linux development container:
just bootstrap
just test
For a quick host-side check of formatting, lints, unit tests, and package contents:
just release-check
License
Licensed under the Apache License, Version 2.0. See LICENSE and AUTHORS.
Contributors


See what people are saying
Similar repos




Languages
Rust
62.4%
Python
32.5%
Nix
1.9%
Shell
1.7%
Records every process and file access in a build and shows it as an interactive timeline
22
stars
92
commits
Rust
primary language
Sep 12, 2026
updated
README
What is Buildprof?
Buildprof traces every process a Linux build launches and turns the recording
into an interactive timeline you can explore in the browser. Put buildprof --
in front of your build command to get started.
- See the whole build. Find expensive commands, gaps in parallelism, and work that starts unexpectedly late across Make, Ninja, CMake, Meson, Cargo, Go, and shell scripts.
- Follow the files. Inspect commands, working directories, and exit statuses, then follow inputs back to the processes that produced them.
- Look inside compilers. Optionally add internal timing data from Clang, LLD, and nightly Rust alongside the process timeline.
Recording requires Linux. You can explore recordings on any platform in the web UI; trace data stays in your browser.
Try it in your browser
Explore a clean ripgrep release build without installing anything. Click the screenshot to open the recording, or follow the guided tour.
Quick start
1. Install Buildprof
On the Linux machine that runs your build:
curl -fsSL https://buildprof.lalitm.com/install.sh | sh
Prefer a package manager? See Install for Homebrew, mise, Cargo, and Linux packages.
2. Record a build
In your project directory, put buildprof -- in front of your usual build
command:
buildprof -- make -j8
Replace make -j8 with your build command, such as cargo build or
ninja -C out. Bazel, Gradle, Buck2, and other build systems with a daemon
need a slightly different command.
3. Explore the recording
When the build finishes, the recording is saved as output.buildprof and
opens in your browser. Allow the one-time prompt to access other apps and
services on this device: that is the page fetching the recording from
localhost. Nothing is ever uploaded.
Start with the longest commands and gaps in parallelism. The investigation guide walks through finding bottlenecks, following file dependencies, and checking whether a change helped. For builds over SSH, see Builds on a remote machine.
Why use Buildprof?
Build tools generally explain only the work they manage themselves. Cargo
timings cannot break down an arbitrary build.rs script; Ninja cannot see
inside commands it launches; compiler traces describe one compiler invocation
rather than the build around it.
Buildprof follows the complete process tree, so the same view includes the build system, compilers, linkers, code generators, and arbitrary tools launched along the way. You can see how their work fits together and where the build spends its time.
Install
Install on your Linux build machine using whichever method you prefer.
Shell installer:
curl -fsSL https://buildprof.lalitm.com/install.sh | sh
Homebrew:
brew install lalitmaganti/tap/buildprof
mise:
mise use -g github:LalitMaganti/buildprof
Cargo (builds from source; needs Rust 1.91 or newer):
cargo install --locked buildprof
Debian, Ubuntu, Fedora, and other .deb or .rpm distributions: download
the package for your architecture from the
latest release
and install it with apt install ./buildprof_*.deb or
dnf install ./buildprof-*.rpm.
Tarballs: the same release page carries prebuilt binaries for x86_64 and aarch64 Linux, both glibc and static musl.
Requirements
Recording builds is currently supported on Linux only. The kernel or
container configuration must permit tracing child processes: Docker needs
--cap-add SYS_PTRACE, kernel.yama.ptrace_scope must be below 3, and
gVisor-style sandboxes cannot trace at all. Installing from source needs Rust
1.91 or newer.
Existing recordings can be viewed on any platform in the web UI, without installing Buildprof. Viewing a recording does not require the same operating system it was recorded on.
Usage
Recording a build
Put buildprof -- in front of the build command. Choose another output path
or disable automatic opening when needed:
buildprof -o clean-build.buildprof --no-open -- ninja -C out
Opening recordings
Open an existing recording later with:
buildprof open clean-build.buildprof
buildprof.lalitm.com only delivers the UI itself. Your browser fetches the recording from localhost and processes it entirely in the page; no trace data leaves your machine.
Because the page comes from buildprof.lalitm.com and the recording from
localhost, the browser asks once whether the site may access other apps and
services on this device. Allow it. If you block it, the trace never loads. To
recover, allow it again in the site settings next to the address bar, under
"Apps on device" in Chrome or "Access this device" in Firefox, then run
buildprof open again.
Recordings contain command lines and filesystem paths. Review them before sending them to anyone.
Builds on a remote machine
Over SSH there is no browser to launch, so Buildprof prints the port forward to run from your own machine instead and waits for the browser to fetch the trace:
ssh -L 9001:127.0.0.1:9001 user@buildhost
VS Code Remote and JetBrains Gateway forward the port automatically. The wait
gives up after ten minutes; adjust it with --wait <SECONDS>, where 0 waits
forever. Alternatively, copy the recording to your own machine and open it
in the web UI. No local installation is needed
for viewing.
Collection options
Process creation, commands, and timing are always recorded. File opens and renames are also recorded by default; to reduce overhead on builds with lots of filesystem activity, disable that layer:
buildprof --no-file-events -- make -j6
The process timeline remains available, but file lists and producer/consumer links are unavailable. This skips filesystem interception itself, rather than collecting and discarding events. The UI identifies recordings made this way.
Compiler details
Process timing is usually the right level for understanding a build. When a particular compiler or linker invocation needs a closer look, enable compiler tracing:
buildprof --compiler-traces -- cargo build
Buildprof currently imports Clang -ftime-trace, explicitly selected LLD
--time-trace, and nightly Rust self-profile data. These events appear as a
summary of active compiler threads with expandable per-thread phase tracks.
Compiler tracing can be combined with process-only recording:
buildprof --no-file-events --compiler-traces -- ninja -C build
A build which invokes Clang through an absolute path currently bypasses compiler tracing. Buildprof will still record the compiler process, but its Clang and LLD internal phases will be absent.
Compiler tracing can also change compiler cache keys or turn cache hits into misses. Existing Rust compiler wrappers remain in the invocation chain, but cache preservation is not guaranteed in this mode.
Build systems
Buildprof follows the process tree, so it does not need to understand the build system. These are exercised by the conformance suite on every change:
- Make: compiles, archiving, linking, and renamed outputs.
- CMake with Ninja: the configure step and the Ninja build.
- Meson with Ninja: the setup step and the Ninja build.
- Cargo:
rustcinvocations and linking; nightly self-profile data with--compiler-traces. - Go: compile, assemble, and link.
Anything else that runs as a child process is recorded the same way: shell scripts, code generators, wrapper scripts, and tools launched by the build.
Daemon build systems
Work handed to a daemon or a remote executor happens outside the process tree and is not visible. If the daemon is already running, the recording shows only the client; if the recorded command starts it, the recording continues until the daemon exits. Run without the daemon, or stop it before and after the build:
bazel shutdown && buildprof -- sh -c 'bazel build //... ; bazel shutdown'
buildprof -- ./gradlew --no-daemon build
buck2 kill && buildprof -- sh -c 'buck2 build //... ; buck2 kill'
sccache --stop-server && buildprof -- sh -c 'cargo build; sccache --stop-server'
How it works
On Linux, Buildprof launches the command under ptrace and follows process
creation, execution, and exit through the complete descendant tree. A seccomp
filter lets it stop only for the filesystem operations it records instead of
paying the cost of intercepting every system call.
The recorder writes a Perfetto protobuf trace directly. Perfetto provides the storage format, query engine, and core timeline interactions; Buildprof adds the build-specific view on top, including process ancestry, command types, concurrency, file relationships, and optional compiler timing data.
Backwards compatibility
Before 1.0, the CLI and the UI move in lockstep at the minor version: a recording is meant to be viewed in a UI from the same 0.x series, and patch releases never change the trace format. Every UI version stays deployed under its own path, the CLI opens the one matching its version, and the UI links to the matching series when it is handed a recording from a different one, so nothing stops working, but the trace format may change between minor releases.
From 1.0 onward, the trace format is stable and compatibility is permanent: any recording opens in every later UI, and newer UIs simply add features on top of older recordings.
Self-hosting the UI
Each release attaches buildprof-ui-v<version>.tar.zst, the complete UI as
static files. Serve its contents from any web server and point the CLI at it:
buildprof open --url https://ui.example.internal/v0.2.0 clean-build.buildprof
Development
See CONTRIBUTING.md for the layout and the UI workflow. Run the complete conformance suite in the Linux development container:
just bootstrap
just test
For a quick host-side check of formatting, lints, unit tests, and package contents:
just release-check
License
Licensed under the Apache License, Version 2.0. See LICENSE and AUTHORS.
See what people are saying
Similar repos
Contributors
Languages
Rust
62.4%
Python
32.5%
Nix
1.9%
Shell
1.7%