Self-hosted homelab infrastructure visualizer — interactive network diagram with live status monitoring
See the code Homelable
Self-hosted homelab infrastructure visualization, documentation, scanning & live monitoring


Screenshots · Features · Installation · Documentation · Rack Canvas · Network Scanner · Zigbee / Z-Wave · Proxmox · Live View · REST API · MCP Server
Homelable is a self-hosted infrastructure visualization solution. It provides a network/zigbee/zwave scanning feature to accelerate the identification of machines, devices and services deployed on your local infrastructure.
Homelable also offers a healthcheck system through multiple methods (ping/TCP, /health API, etc.) to get a global overview of online/offline services.
Every device also gets a document — written for you from what the scan found, and yours to maintain from there — next to a Library of pages you write yourself: runbooks, incidents, a network overview. Your homelab stops being documented in a wiki somewhere else.
You can also select some pre-built design styles, or personalize each device in your diagram.
If you just like the design, you can only run the frontend and export your design as PNG.
If you are running Homeassistant, check the Homelable HA version (via HACS)
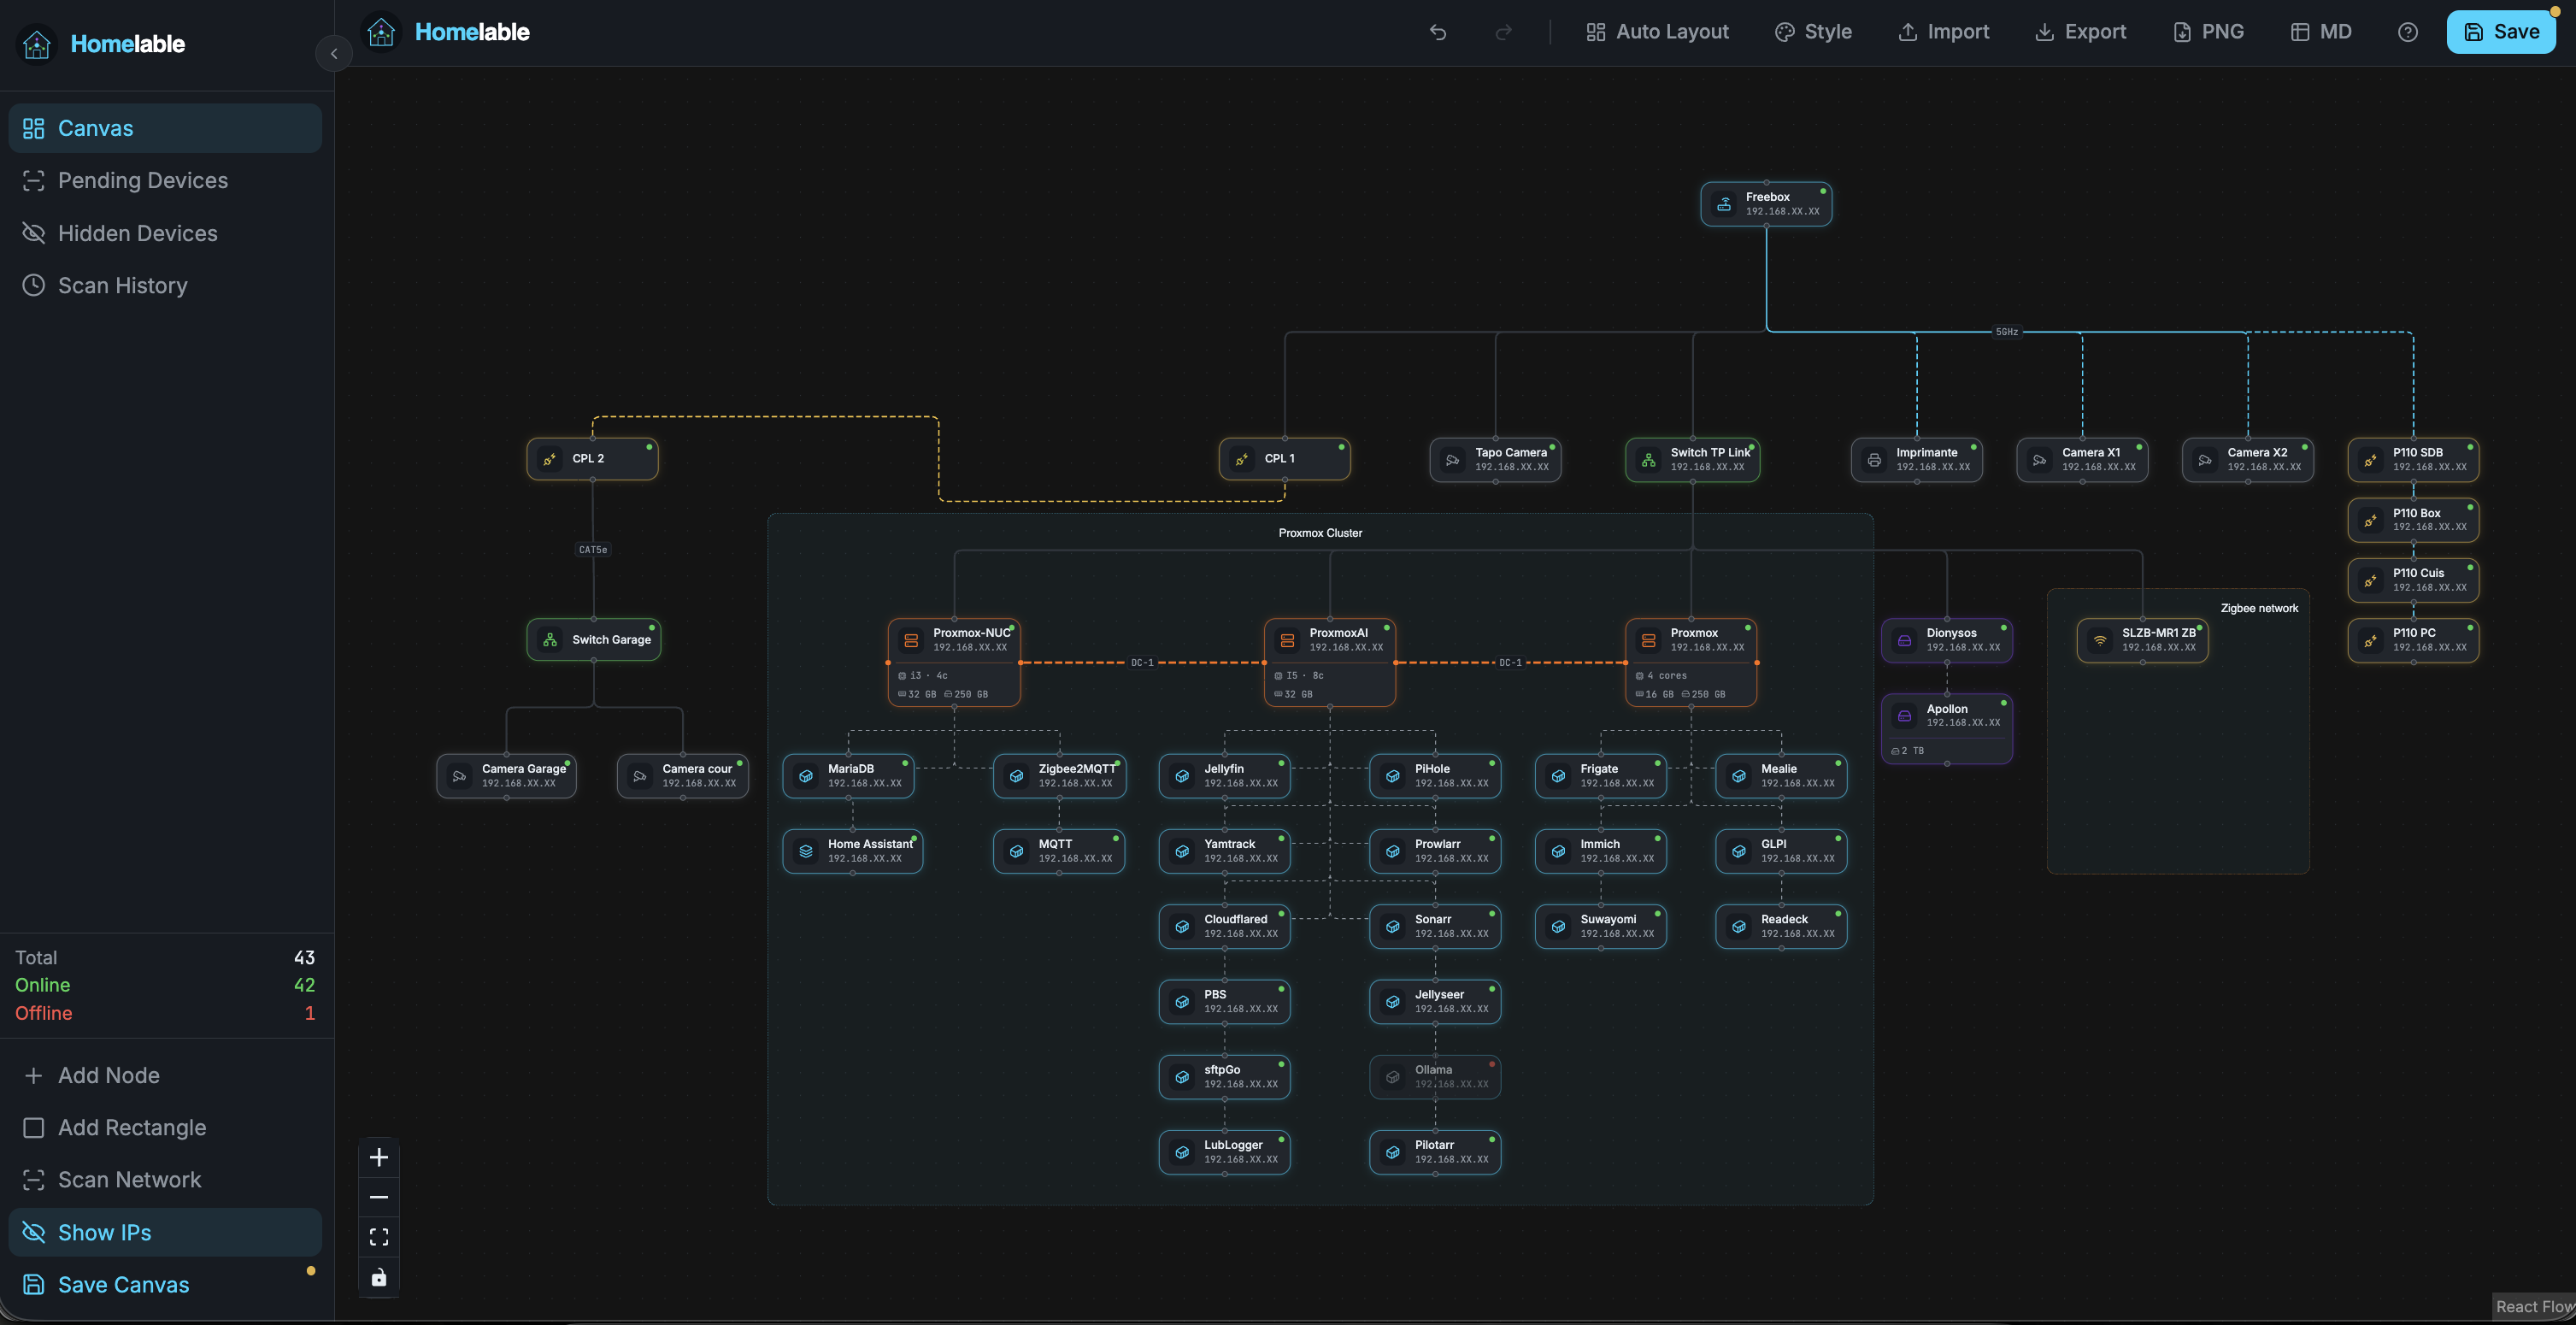
From one-click network scans and Proxmox / Zigbee / Z-Wave imports to live status monitoring, floor plans, rack canvases with port-to-port patching, a markdown documentation space for the whole lab, multi-canvas layouts and an MCP server for AI assistants — Homelable maps, documents and watches your whole homelab.
Every feature, with how to turn it on and use it, is described in FEATURES.md.
Docker (from the pre-built GHCR images), Proxmox LXC, bare metal without Docker (sudo bash scripts/install-baremetal.sh — systemd unit plus nginx on a Debian/Ubuntu host), build from source, configuration, and development setup are all covered in INSTALLATION.md.
Next to the network diagram, Homelable draws the physical side of your lab: racks, the gear mounted in them, and the patch cables between their ports. It is a canvas kind of its own — create it from the canvas switcher, New Canvas → Kind → Rack.
Gear sits in a U range and part of a 12-column width grid, so half- and third-width machines share a U; a drop snaps to the nearest free slot. A mount can follow the status check of its matching diagram node, and Import links derives patches from the links already drawn on your diagrams.
Full documentation: docs/rack-canvas.md
Homelable keeps its own markdown documentation space, so the lab is described where it is drawn. Sidebar → Documentation.
Every device has a document, generated once from what the scan actually found — identity, hardware, one section per service, network, operations, troubleshooting — and never rewritten behind you. Beside it, a Library of pages you write: runbooks, incidents, decisions, a network overview, from a template or blank.
/ inserts a freshly generated block (services, hardware, network, rack) from the device's current data[[VLAN plan]], [[device:nas-01]]. Each document lists Linked from at the bottom, so you can see what points at itreview_every: 6m on the ones that rot; a document past its interval is badged as dueA device that changes after its document was written raises a device data changed banner, and Regenerate rebuilds the document from scratch when you want that. Old per-device Notes migrate into documents from a banner, non-destructively.
Full mode only — documents need the backend to store, index and search them.
Full documentation: docs/documentation.md
Documentation View shares your documentation space — the tree, the pages and their version history — with anyone on your network, no login required. It is disabled by default, and uses its own key: enabling Live View does not enable this.
Add DOCS_VIEW_KEY to your .env:
DOCS_VIEW_KEY=your-secret-key
Generate one with python3 -c "import secrets; print(secrets.token_urlsafe(32))", then
restart the backend:
docker compose restart backend
Use this URL to read your documentation:
http://<your-homelab-ip>/docs?key=your-secret-key
The page shows the document tree, the filter box and any page you pick, plus its earlier versions. Nothing can be written: no editing, no restoring, no deleting. Your device inventory and your canvases are not reachable through it.
Anyone holding that URL reads every document, and every image a document embeds — uploaded media is served without authentication. There is no per-document opt-in: the key is all or nothing. Keep documentation you would not share out of Homelable, or leave this off.
The scanner runs nmap -sV --open on your configured CIDR ranges and populates a Pending Devices queue. From the sidebar you can then approve (adds a node to the canvas), hide, or ignore each discovered device.
To save you time when mapping your infrastructure, Homlable can scan your network and report all the services it detects. It can also identify them, saving you even more time. Click Scan Network in the sidebar. The Scan History tab opens automatically and refreshes every 3 seconds until the scan completes.
By default the scanner only probes nmap's standard port set. To fingerprint services on non-standard ports, enable the deep scan via .env (all options are overridable per-scan from the scan dialog):
# JSON array of port specs — each entry is a single port "N" or an inclusive
# range "N-M" (1–65535, N <= M). These are ports, not CIDRs or bare integers.
SCANNER_HTTP_RANGES=["8080","9000-9100"]
SCANNER_HTTP_PROBE_ENABLED=true   # send an HTTP probe to those ports for service ID
SCANNER_HTTP_VERIFY_TLS=false     # verify TLS certs on the HTTP probe
The listed ports are appended to nmap's -p spec. Invalid entries (out-of-range, malformed, or reversed ranges) are silently skipped.
The scan reports no MAC address when the backend runs on a Docker bridge network — ARP is layer 2, and from a bridge every LAN host sits behind the Docker gateway. It also means a DHCP device that changes IP comes back as a new inventory entry, since matching prefers the MAC. Fix and caveats: INSTALLATION.md.
Some nmap scan types (SYN scan, OS detection) require root. If the scan fails with a permissions error, run it manually with sudo using the included script:
cd backend
sudo python ../scripts/run_scan.py 192.168.1.0/24

# Multiple ranges:
sudo python ../scripts/run_scan.py 192.168.1.0/24 10.0.0.0/24
Results are written directly to the database and appear as Pending Devices in the UI without restarting the backend.
On Linux the backend process itself can be given the
NET_RAWcapability instead of running as root:sudo setcap cap_net_raw+ep $(which nmap)
Homelable continuously monitors your nodes and displays their live status (online / offline / unknown) directly on the canvas. Each node can be configured with an independent check method suited to the service it runs.
| Method | Description |
|---|---|
ping | ICMP ping |
http | GET request, success if status < 500 |
https | GET with TLS verify |
tcp | TCP connect (target: host:port) |
ssh | TCP connect to port 22 |
prometheus | GET /metrics |
health | GET /health |
Homelable can connect directly to your MQTT broker and import your Zigbee network topology from Zigbee2MQTT, placing each device on the canvas as a typed node.
1883), optional credentials, and base topic (default zigbee2mqtt)| Type | Z2M Device | Icon |
|---|---|---|
zigbee_coordinator | Coordinator | Network hub |
zigbee_router | Router (mains-powered) | Radio |
zigbee_enddevice | End Device (battery) | Antenna |
Hierarchy is set automatically: coordinator → routers → end devices (parent_id).
LQI (Link Quality Indicator) is stored as a node property.
Full documentation: docs/zigbee-import.md
Homelable can also import your Z-Wave network from Z-Wave JS UI (formerly zwavejs2mqtt) over the same MQTT broker, dropping each node on the canvas as a typed node.
1883), optional credentials, MQTT prefix (default zwave), and gateway name (default zwavejs2mqtt)| Type | Z-Wave Role | Icon |
|---|---|---|
zwave_coordinator | Controller | Network hub |
zwave_router | Routing (mains-powered) node | Radio |
zwave_enddevice | End Device (battery) | Antenna |
Hierarchy is set automatically: controller → routers → end devices (parent_id), derived from each node's neighbor list. Z-Wave has no LQI, so that property is omitted.
Full documentation: docs/zwave-import.md
Homelable can import your Proxmox VE inventory over the Proxmox REST API — hosts, VMs and LXC containers arrive as typed, named nodes with run state and hardware specs, and can auto-sync on a schedule. Guest IPs that were already found by a network scan are merged in place (no duplicates).
8006)PVEAuditor role (Datacenter → Permissions → API Tokens)8006), and API token (user@realm!tokenid + secret) — or leave the token blank to use the server-configured one| Type | Proxmox object | Icon |
|---|---|---|
proxmox | Host / cluster member | Layers |
vm | QEMU virtual machine | Box |
lxc | LXC container | Container |
Each host is linked to its guests with a virtual edge. vCPU / RAM / disk are imported as node properties (hidden by default). Enable auto-sync from Settings once a server token is configured (PROXMOX_TOKEN_ID / PROXMOX_TOKEN_SECRET).
Full documentation: docs/proxmox-import.md
Live View lets you share a read-only snapshot of your canvas with anyone on your network — no login required. It is disabled by default.
Add LIVEVIEW_KEY to your .env:
LIVEVIEW_KEY=your-secret-key
Then restart the backend:
docker compose restart backend
Use this URL to view your canvas:
http:///view?key=your-secret-key
The page shows your canvas in pan/zoom-only mode — no editing, no credentials needed. Clicking a node that has an IP opens it in a new tab.
Homelable can expose a small JSON stats endpoint that gethomepage consumes through its built-in customapi widget. Disabled by default.
Add HOMEPAGE_API_KEY to your .env:
HOMEPAGE_API_KEY=your-secret-key
Restart the backend (docker compose restart backend).
GET /api/v1/stats/summary — requires header X-API-Key: your-secret-key. Returns:
{
  "nodes": 12,
  "online": 9,
  "offline": 2,
  "unknown": 1,
  "pending_devices": 3,
  "zigbee_devices": 5,
  "last_scan_at": "2026-05-14T10:00:00+00:00"
}
services.yaml snippet- Homelab:
- Homelable:
icon: mdi-lan
href: http://homelable.local:3000
widget:
type: customapi
url: http://homelable.local:8000/api/v1/stats/summary
method: GET
headers:
X-API-Key: your-secret-key
mappings:
- field: nodes ; label: Nodes
- field: online ; label: Online
- field: offline ; label: Offline
- field: pending_devices ; label: Pending
- field: zigbee_devices ; label: Zigbee
- field: last_scan_at ; label: Last scan
The backend port (8000) must be reachable from your gethomepage container.
Everything the UI does goes through a documented JSON API under /api/v1 —
nodes, links, designs, racks, documents, the scanner. Script it to create nodes
for new machines, attach properties, and wire links between them.
Interactive documentation ships with the app, generated from the code so it never drifts:
| URL | What |
|---|---|
http://<your-homelab-ip>:3000/docs | Swagger UI — browse and call every endpoint |
http://<your-homelab-ip>:3000/redoc | ReDoc — the same schema, reference layout |
http://<your-homelab-ip>:3000/openapi.json | OpenAPI schema, for client generators |
Authenticate with a bearer token from POST /api/v1/auth/login, then send it as
Authorization: Bearer <token>:
TOKEN=$(curl -s http://<your-homelab-ip>:3000/api/v1/auth/login \
  -H 'Content-Type: application/json' \
  -d '{"username":"admin","password":"your-password"}' | jq -r .access_token)

curl -s http://<your-homelab-ip>:3000/api/v1/nodes -H "Authorization: Bearer $TOKEN"
Full documentation: docs/api.md
[!WARNING] The docs endpoints are not behind authentication — anyone who can reach the app can read the API shape (not your data). Keep Homelable on your LAN.
Homelable can exposes a Model Context Protocol server so any MCP-compatible AI client (Claude Code, Claude Desktop, Open WebUI…) can read your homelab topology and act on it.
| Action | |
|---|---|
| Read | List all nodes, edges, full canvas, zones, designs, the device inventory and scan history — and the rack canvases: racks, mounted gear, patched cables |
| Write | Add / update / delete nodes, edges and zones, trigger a network scan, approve / hide / restore discovered devices, create and edit inventory entries, build racks and mount, move and patch the gear in them |
1. Add the keys to your .env:
# Authenticates AI clients (Claude Code, etc.) → MCP server
MCP_API_KEY=mcp_sk_changeme

# Authenticates MCP server → backend (internal Docker network only, never exposed)
MCP_SERVICE_KEY=svc_changeme

# Generate both with:
# python3 -c "import secrets; print(secrets.token_hex(32))"
No plain-text passwords involved — AUTH_PASSWORD_HASH is only used for the web UI login.
2. Start the MCP service:
docker compose up -d mcp
# MCP server is now listening on http://<your-homelab-ip>:8001
Proxmox LXC / bare-metal (no Docker): create the LXC via community-scripts/ProxmoxVE (or any Debian/Ubuntu LXC), then inside it run
sudo bash scripts/lxc-mcp-install.sh. Installs ahomelable-mcpsystemd service, prompts forMCP_API_KEY/MCP_SERVICE_KEY(auto-generated if you press Enter), and skips prompts ifmcp/.envalready exists.
3. Configure your AI client:
Claude Code — run this command in your terminal:
claude mcp add --transport http homelable http://<your-homelab-ip>:8001/mcp/ \
  --header "X-API-Key: mcp_sk_yourkey"
Or add it manually to ~/.claude.json:
{
  "mcpServers": {
    "homelable": {
      "type": "http",
      "url": "http://<your-homelab-ip>:8001/mcp/",
      "headers": {
        "X-API-Key": "mcp_sk_yourkey"
      }
    }
  }
}
Claude Desktop — edit ~/Library/Application Support/Claude/claude_desktop_config.json (macOS) or %APPDATA%\Claude\claude_desktop_config.json (Windows):
{
  "mcpServers": {
    "homelable": {
      "type": "http",
      "url": "http://<your-homelab-ip>:8001/mcp/",
      "headers": {
        "X-API-Key": "mcp_sk_yourkey"
      }
    }
  }
}
pihole at 192.168.1.5, connected to my switch."MCP_API_KEY in .env and restarting: docker compose restart mcp.(top 24 of 25)
2,592 followers · starred Aug 2026
269 followers · starred Mar 2026
1,337 followers · starred Mar 2026
255 followers · starred May 2026
Self-hosted homelab infrastructure visualizer — interactive network diagram with live status monitoring
See the code HomelableSelf-hosted homelab infrastructure visualization, documentation, scanning & live monitoring
Screenshots · Features · Installation · Documentation · Rack Canvas · Network Scanner · Zigbee / Z-Wave · Proxmox · Live View · REST API · MCP Server
Homelable is a self-hosted infrastructure visualization solution. It provides a network/zigbee/zwave scanning feature to accelerate the identification of machines, devices and services deployed on your local infrastructure.
Homelable also offers a healthcheck system through multiple methods (ping/TCP, /health API, etc.) to get a global overview of online/offline services.
Every device also gets a document — written for you from what the scan found, and yours to maintain from there — next to a Library of pages you write yourself: runbooks, incidents, a network overview. Your homelab stops being documented in a wiki somewhere else.
You can also select some pre-built design styles, or personalize each device in your diagram.
If you just like the design, you can only run the frontend and export your design as PNG.
If you are running Homeassistant, check the Homelable HA version (via HACS)
From one-click network scans and Proxmox / Zigbee / Z-Wave imports to live status monitoring, floor plans, rack canvases with port-to-port patching, a markdown documentation space for the whole lab, multi-canvas layouts and an MCP server for AI assistants — Homelable maps, documents and watches your whole homelab.
Every feature, with how to turn it on and use it, is described in FEATURES.md.
Docker (from the pre-built GHCR images), Proxmox LXC, bare metal without Docker (sudo bash scripts/install-baremetal.sh — systemd unit plus nginx on a Debian/Ubuntu host), build from source, configuration, and development setup are all covered in INSTALLATION.md.
Next to the network diagram, Homelable draws the physical side of your lab: racks, the gear mounted in them, and the patch cables between their ports. It is a canvas kind of its own — create it from the canvas switcher, New Canvas → Kind → Rack.
Gear sits in a U range and part of a 12-column width grid, so half- and third-width machines share a U; a drop snaps to the nearest free slot. A mount can follow the status check of its matching diagram node, and Import links derives patches from the links already drawn on your diagrams.
Full documentation: docs/rack-canvas.md
Homelable keeps its own markdown documentation space, so the lab is described where it is drawn. Sidebar → Documentation.
Every device has a document, generated once from what the scan actually found — identity, hardware, one section per service, network, operations, troubleshooting — and never rewritten behind you. Beside it, a Library of pages you write: runbooks, incidents, decisions, a network overview, from a template or blank.
/ inserts a freshly generated block (services, hardware, network, rack) from the device's current data[[VLAN plan]], [[device:nas-01]]. Each document lists Linked from at the bottom, so you can see what points at itreview_every: 6m on the ones that rot; a document past its interval is badged as dueA device that changes after its document was written raises a device data changed banner, and Regenerate rebuilds the document from scratch when you want that. Old per-device Notes migrate into documents from a banner, non-destructively.
Full mode only — documents need the backend to store, index and search them.
Full documentation: docs/documentation.md
Documentation View shares your documentation space — the tree, the pages and their version history — with anyone on your network, no login required. It is disabled by default, and uses its own key: enabling Live View does not enable this.
Add DOCS_VIEW_KEY to your .env:
DOCS_VIEW_KEY=your-secret-key
Generate one with python3 -c "import secrets; print(secrets.token_urlsafe(32))", then
restart the backend:
docker compose restart backend
Use this URL to read your documentation:
http://<your-homelab-ip>/docs?key=your-secret-key
The page shows the document tree, the filter box and any page you pick, plus its earlier versions. Nothing can be written: no editing, no restoring, no deleting. Your device inventory and your canvases are not reachable through it.
Anyone holding that URL reads every document, and every image a document embeds — uploaded media is served without authentication. There is no per-document opt-in: the key is all or nothing. Keep documentation you would not share out of Homelable, or leave this off.
The scanner runs nmap -sV --open on your configured CIDR ranges and populates a Pending Devices queue. From the sidebar you can then approve (adds a node to the canvas), hide, or ignore each discovered device.
To save you time when mapping your infrastructure, Homlable can scan your network and report all the services it detects. It can also identify them, saving you even more time. Click Scan Network in the sidebar. The Scan History tab opens automatically and refreshes every 3 seconds until the scan completes.
By default the scanner only probes nmap's standard port set. To fingerprint services on non-standard ports, enable the deep scan via .env (all options are overridable per-scan from the scan dialog):
# JSON array of port specs — each entry is a single port "N" or an inclusive
# range "N-M" (1–65535, N <= M). These are ports, not CIDRs or bare integers.
SCANNER_HTTP_RANGES=["8080","9000-9100"]
SCANNER_HTTP_PROBE_ENABLED=true   # send an HTTP probe to those ports for service ID
SCANNER_HTTP_VERIFY_TLS=false     # verify TLS certs on the HTTP probe
The listed ports are appended to nmap's -p spec. Invalid entries (out-of-range, malformed, or reversed ranges) are silently skipped.
The scan reports no MAC address when the backend runs on a Docker bridge network — ARP is layer 2, and from a bridge every LAN host sits behind the Docker gateway. It also means a DHCP device that changes IP comes back as a new inventory entry, since matching prefers the MAC. Fix and caveats: INSTALLATION.md.
Some nmap scan types (SYN scan, OS detection) require root. If the scan fails with a permissions error, run it manually with sudo using the included script:
cd backend
sudo python ../scripts/run_scan.py 192.168.1.0/24

# Multiple ranges:
sudo python ../scripts/run_scan.py 192.168.1.0/24 10.0.0.0/24
Results are written directly to the database and appear as Pending Devices in the UI without restarting the backend.
On Linux the backend process itself can be given the
NET_RAWcapability instead of running as root:sudo setcap cap_net_raw+ep $(which nmap)
Homelable continuously monitors your nodes and displays their live status (online / offline / unknown) directly on the canvas. Each node can be configured with an independent check method suited to the service it runs.
| Method | Description |
|---|---|
ping | ICMP ping |
http | GET request, success if status < 500 |
https | GET with TLS verify |
tcp | TCP connect (target: host:port) |
ssh | TCP connect to port 22 |
prometheus | GET /metrics |
health | GET /health |
Homelable can connect directly to your MQTT broker and import your Zigbee network topology from Zigbee2MQTT, placing each device on the canvas as a typed node.
1883), optional credentials, and base topic (default zigbee2mqtt)| Type | Z2M Device | Icon |
|---|---|---|
zigbee_coordinator | Coordinator | Network hub |
zigbee_router | Router (mains-powered) | Radio |
zigbee_enddevice | End Device (battery) | Antenna |
Hierarchy is set automatically: coordinator → routers → end devices (parent_id).
LQI (Link Quality Indicator) is stored as a node property.
Full documentation: docs/zigbee-import.md
Homelable can also import your Z-Wave network from Z-Wave JS UI (formerly zwavejs2mqtt) over the same MQTT broker, dropping each node on the canvas as a typed node.
1883), optional credentials, MQTT prefix (default zwave), and gateway name (default zwavejs2mqtt)| Type | Z-Wave Role | Icon |
|---|---|---|
zwave_coordinator | Controller | Network hub |
zwave_router | Routing (mains-powered) node | Radio |
zwave_enddevice | End Device (battery) | Antenna |
Hierarchy is set automatically: controller → routers → end devices (parent_id), derived from each node's neighbor list. Z-Wave has no LQI, so that property is omitted.
Full documentation: docs/zwave-import.md
Homelable can import your Proxmox VE inventory over the Proxmox REST API — hosts, VMs and LXC containers arrive as typed, named nodes with run state and hardware specs, and can auto-sync on a schedule. Guest IPs that were already found by a network scan are merged in place (no duplicates).
8006)PVEAuditor role (Datacenter → Permissions → API Tokens)8006), and API token (user@realm!tokenid + secret) — or leave the token blank to use the server-configured one| Type | Proxmox object | Icon |
|---|---|---|
proxmox | Host / cluster member | Layers |
vm | QEMU virtual machine | Box |
lxc | LXC container | Container |
Each host is linked to its guests with a virtual edge. vCPU / RAM / disk are imported as node properties (hidden by default). Enable auto-sync from Settings once a server token is configured (PROXMOX_TOKEN_ID / PROXMOX_TOKEN_SECRET).
Full documentation: docs/proxmox-import.md
Live View lets you share a read-only snapshot of your canvas with anyone on your network — no login required. It is disabled by default.
Add LIVEVIEW_KEY to your .env:
LIVEVIEW_KEY=your-secret-key
Then restart the backend:
docker compose restart backend
Use this URL to view your canvas:
http:///view?key=your-secret-key
The page shows your canvas in pan/zoom-only mode — no editing, no credentials needed. Clicking a node that has an IP opens it in a new tab.
Homelable can expose a small JSON stats endpoint that gethomepage consumes through its built-in customapi widget. Disabled by default.
Add HOMEPAGE_API_KEY to your .env:
HOMEPAGE_API_KEY=your-secret-key
Restart the backend (docker compose restart backend).
GET /api/v1/stats/summary — requires header X-API-Key: your-secret-key. Returns:
{
  "nodes": 12,
  "online": 9,
  "offline": 2,
  "unknown": 1,
  "pending_devices": 3,
  "zigbee_devices": 5,
  "last_scan_at": "2026-05-14T10:00:00+00:00"
}
services.yaml snippet- Homelab:
- Homelable:
icon: mdi-lan
href: http://homelable.local:3000
widget:
type: customapi
url: http://homelable.local:8000/api/v1/stats/summary
method: GET
headers:
X-API-Key: your-secret-key
mappings:
- field: nodes ; label: Nodes
- field: online ; label: Online
- field: offline ; label: Offline
- field: pending_devices ; label: Pending
- field: zigbee_devices ; label: Zigbee
- field: last_scan_at ; label: Last scan
The backend port (8000) must be reachable from your gethomepage container.
Everything the UI does goes through a documented JSON API under /api/v1 —
nodes, links, designs, racks, documents, the scanner. Script it to create nodes
for new machines, attach properties, and wire links between them.
Interactive documentation ships with the app, generated from the code so it never drifts:
| URL | What |
|---|---|
http://<your-homelab-ip>:3000/docs | Swagger UI — browse and call every endpoint |
http://<your-homelab-ip>:3000/redoc | ReDoc — the same schema, reference layout |
http://<your-homelab-ip>:3000/openapi.json | OpenAPI schema, for client generators |
Authenticate with a bearer token from POST /api/v1/auth/login, then send it as
Authorization: Bearer <token>:
TOKEN=$(curl -s http://<your-homelab-ip>:3000/api/v1/auth/login \
  -H 'Content-Type: application/json' \
  -d '{"username":"admin","password":"your-password"}' | jq -r .access_token)

curl -s http://<your-homelab-ip>:3000/api/v1/nodes -H "Authorization: Bearer $TOKEN"
Full documentation: docs/api.md
[!WARNING] The docs endpoints are not behind authentication — anyone who can reach the app can read the API shape (not your data). Keep Homelable on your LAN.
Homelable can exposes a Model Context Protocol server so any MCP-compatible AI client (Claude Code, Claude Desktop, Open WebUI…) can read your homelab topology and act on it.
| Action | |
|---|---|
| Read | List all nodes, edges, full canvas, zones, designs, the device inventory and scan history — and the rack canvases: racks, mounted gear, patched cables |
| Write | Add / update / delete nodes, edges and zones, trigger a network scan, approve / hide / restore discovered devices, create and edit inventory entries, build racks and mount, move and patch the gear in them |
1. Add the keys to your .env:
# Authenticates AI clients (Claude Code, etc.) → MCP server
MCP_API_KEY=mcp_sk_changeme

# Authenticates MCP server → backend (internal Docker network only, never exposed)
MCP_SERVICE_KEY=svc_changeme

# Generate both with:
# python3 -c "import secrets; print(secrets.token_hex(32))"
No plain-text passwords involved — AUTH_PASSWORD_HASH is only used for the web UI login.
2. Start the MCP service:
docker compose up -d mcp
# MCP server is now listening on http://<your-homelab-ip>:8001
Proxmox LXC / bare-metal (no Docker): create the LXC via community-scripts/ProxmoxVE (or any Debian/Ubuntu LXC), then inside it run
sudo bash scripts/lxc-mcp-install.sh. Installs ahomelable-mcpsystemd service, prompts forMCP_API_KEY/MCP_SERVICE_KEY(auto-generated if you press Enter), and skips prompts ifmcp/.envalready exists.
3. Configure your AI client:
Claude Code — run this command in your terminal:
claude mcp add --transport http homelable http://<your-homelab-ip>:8001/mcp/ \
  --header "X-API-Key: mcp_sk_yourkey"
Or add it manually to ~/.claude.json:
{
  "mcpServers": {
    "homelable": {
      "type": "http",
      "url": "http://<your-homelab-ip>:8001/mcp/",
      "headers": {
        "X-API-Key": "mcp_sk_yourkey"
      }
    }
  }
}
Claude Desktop — edit ~/Library/Application Support/Claude/claude_desktop_config.json (macOS) or %APPDATA%\Claude\claude_desktop_config.json (Windows):
{
  "mcpServers": {
    "homelable": {
      "type": "http",
      "url": "http://<your-homelab-ip>:8001/mcp/",
      "headers": {
        "X-API-Key": "mcp_sk_yourkey"
      }
    }
  }
}
pihole at 192.168.1.5, connected to my switch."MCP_API_KEY in .env and restarting: docker compose restart mcp.(top 24 of 25)
2,592 followers · starred Aug 2026
269 followers · starred Mar 2026
1,337 followers · starred Mar 2026
255 followers · starred May 2026