
Windows desktop HTTP/HTTPS traffic monitor (MITM proxy, WPF) with an MCP server so AI assistants can inspect, filter, replay, and mock traffic
C#
13
66 commits
updated Oct 4, 2026
See what people are saying
README
HTTP Traffic Monitor
A free, open-source HTTP/HTTPS debugging proxy for Windows with a built-in MCP server — so Claude and other AI assistants can inspect, filter, replay and mock the traffic you capture.
For developers and testers on Windows who need to see what an app, a service or a browser really sends and receives: a Fiddler/Charles-style traffic inspector, MIT-licensed, that your AI assistant can drive too.
⬇ Download for Windows · ▶ Watch the demo · How it compares · MCP setup
Why pick it
- AI-ready out of the box — 42 MCP tools let an assistant start a capture, find the failing requests, replay them and set up mocks; no paid tier.
- Every app on the machine, not one browser tab — it captures system-wide as the Windows proxy and shows which process sent each request.
- Free and open source — MIT license, Fluent UI with light and dark themes.
From download to the first captured request
- Download the app zip from Releases and unzip it (or build from source).
- Run
HttpTrafficMonitor.exe, accept the administrator prompt and read the security notice. - Click Start — the app installs its local root CA (confirm if Windows asks) and becomes the system proxy.
- Open any website or call an API: the requests appear in the grid. Click one to see its headers, body, timing and certificate.
See it in action

How it compares
| HTTP Traffic Monitor | Fiddler Everywhere | Charles | mitmproxy | Browser DevTools | |
|---|---|---|---|---|---|
| Price | Free, open source (MIT) | Paid subscription | Paid license | Free, open source | Free, part of the browser |
| Platforms | Windows 10/11 | Windows, macOS, Linux | Windows, macOS, Linux | Windows, macOS, Linux | Wherever the browser runs |
| Captures traffic of other apps, not just the browser | Yes, system-wide, with the process name | Yes | Yes | Yes | No — only the page it is attached to |
| Interface | Desktop app | Desktop app | Desktop app | Terminal and web UI | Panel in the browser |
| MCP server for AI assistants | Built in, free | Built in, Pro tier and up | Not built in | Not built in | Not built in |
Choose this tool when you are on Windows and want a free graphical inspector that an AI assistant can work with. If you need macOS or Linux, or to script the proxy itself, mitmproxy, Charles or Fiddler Everywhere fit better. (Details of the other tools as of October 2026 — corrections welcome.)
Download
Get the latest build from Releases — Windows 10/11 x64, nothing else to install (the .NET runtime is included):
HttpTrafficMonitor-<version>-win-x64.zip— the desktop app. Unzip it and runHttpTrafficMonitor\HttpTrafficMonitor.exe(it asks for administrator rights).HttpTrafficMonitor.McpServer-<version>-win-x64.zip— the MCP server as a singleHttpTrafficMonitor.McpServer.exe; see Configuring the MCP server.
The builds are not code-signed, so Windows SmartScreen may warn on first start: choose More info, then Run anyway.
What it does
HttpTrafficMonitor sits between your machine and the internet as a local proxy (via Titanium.Web.Proxy), decrypts HTTPS on the fly with a locally-generated root CA, and shows every request/response as it happens — searchable, filterable, and exportable.
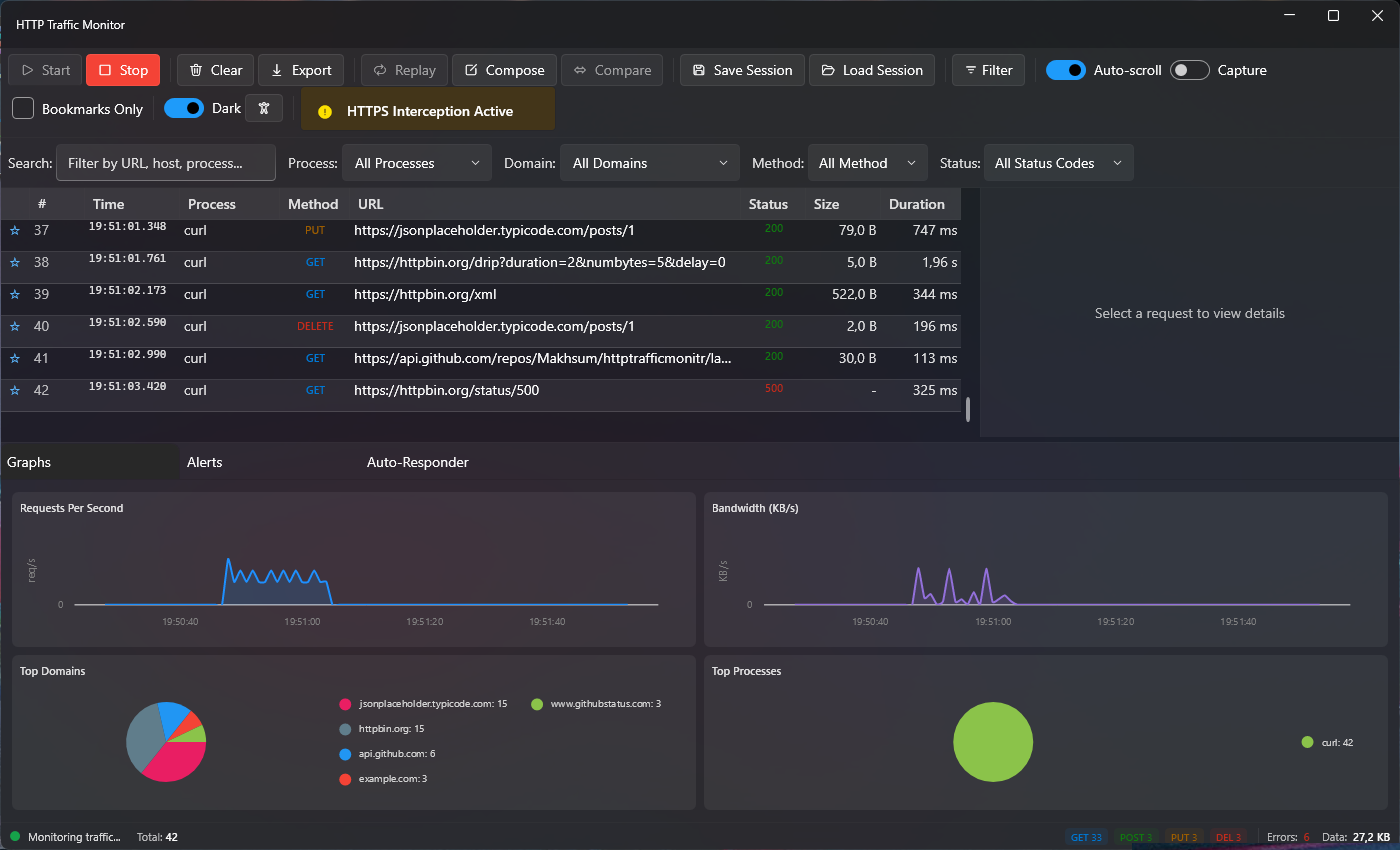
The screenshots show demo traffic only: curl calls to public sample APIs (JSONPlaceholder, httpbin, example.com, GitHub). The 404 and 500 responses among them are requested on purpose, to show how failed requests stand out.
Features
Capture & inspect
- Start/Stop system-wide HTTP/HTTPS capture with one click (installs a root CA for TLS interception, restored automatically on Stop)
- Live request grid: method, URL, status, size, duration, colored badges, and a red highlight for slow requests
- Quick search plus dedicated Process / Domain / Method / Status filters
- Per-request detail tabs: Request, Response, Timing (DNS lookup, TCP connect, TLS handshake, time to first byte and download, measured for each request), Certificate (chain, issuer, validity, thumbprint), Decoded (gzip/brotli/base64 aware), and Exclusions


Filtering
Build multi-condition filters (field / operator / value, AND-ed or OR-ed) and save them as named presets for reuse.

Replay & compose
Edit and resend any captured request, or compose a brand-new one from scratch, with side-by-side original vs. new response.

Compare
Pick two requests and get a line-by-line diff (via DiffPlex) across headers and bodies.
Alerts
Rule-based alerting on status codes, response time thresholds, or custom patterns, with a live event feed. Below, the built-in Server Errors (5xx) rule has caught the demo request to httpbin.org/status/500.

Auto-Responder (mocking)
Intercept matching requests (by URL/regex + method) and return a canned status code, headers, and body — or serve a file — with an optional artificial delay. Great for mocking flaky or unavailable backends during development.
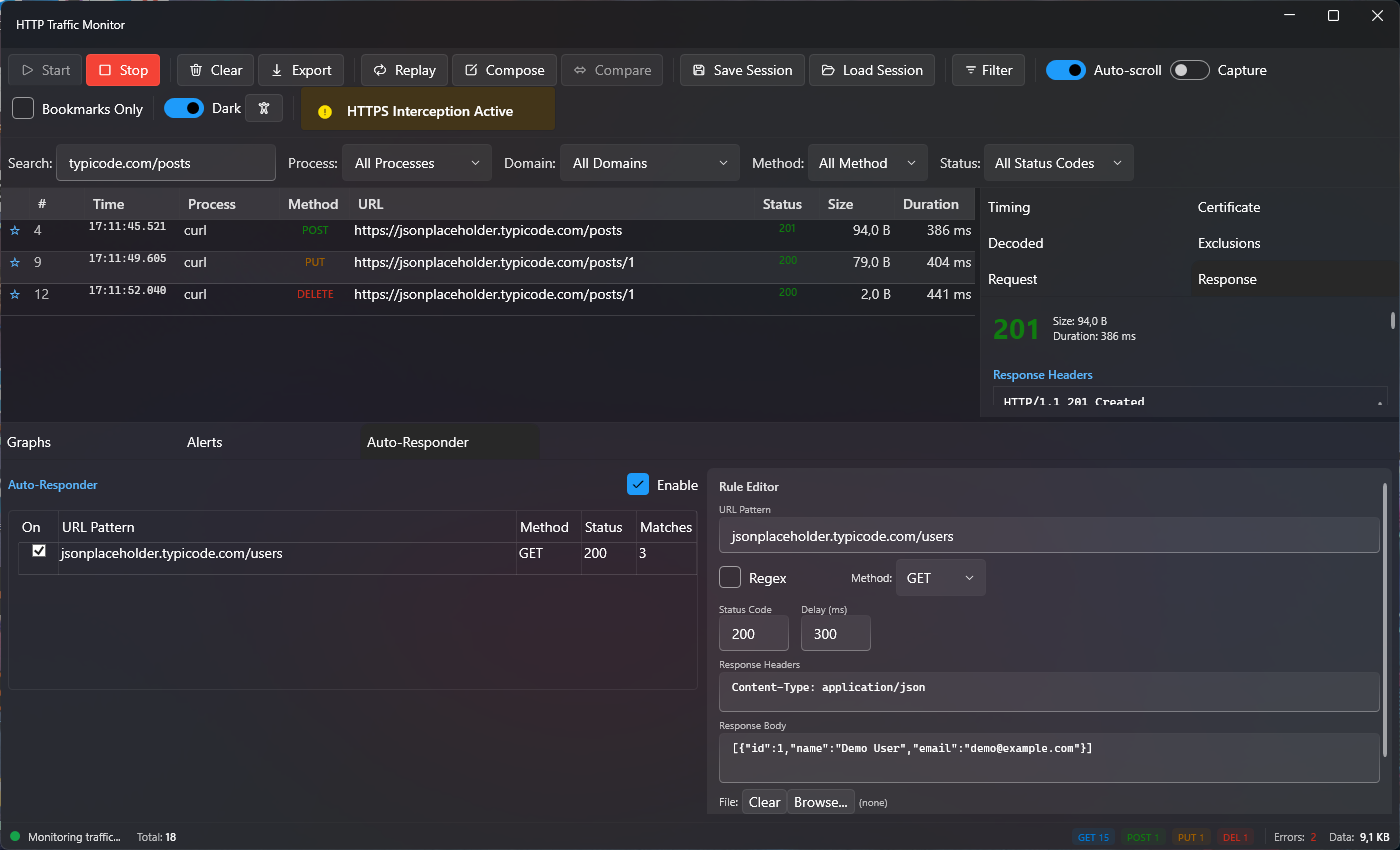
Graphs
Live requests-per-second and bandwidth charts, plus top-domains and top-processes breakdowns (via LiveCharts2).
Sessions & export
Save/load full capture sessions, bookmark interesting requests, and export selections as CSV, HAR, JSON, cURL, or Postman collection.
Light & dark themes
Full Fluent Design theming via WPF-UI.
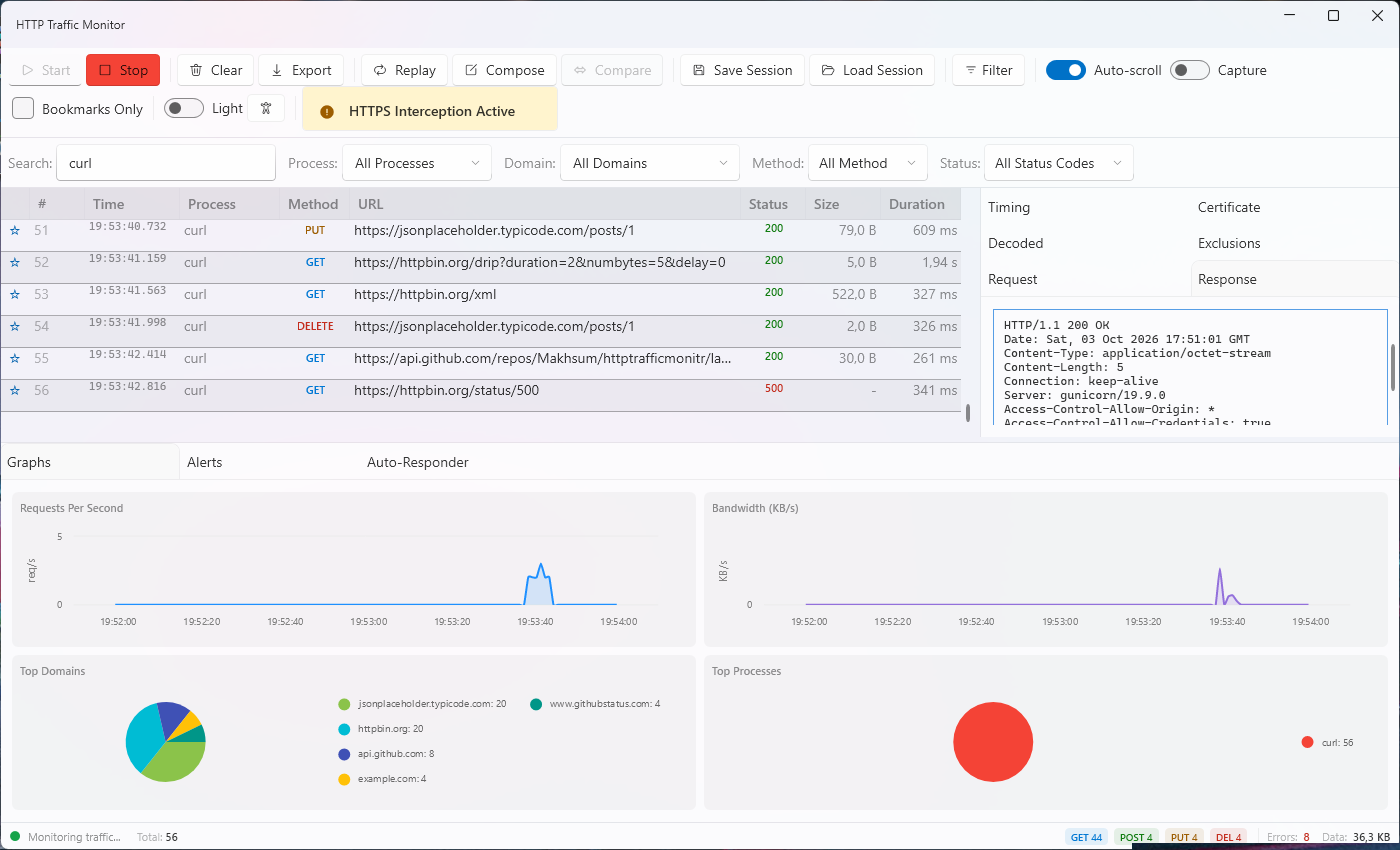
MCP Server
HttpTrafficMonitor.McpServer exposes the running app to AI assistants over the Model Context Protocol (stdio transport). The main app hosts a small local REST API (http://localhost:18081/api/...) via IpcApiService; the MCP server is a thin process that talks to that API and surfaces it as MCP tools — so an assistant can start/stop capture, inspect and filter requests, manage alerts and auto-responder rules, replay/compose requests, and export data, all without touching the UI.
Here an assistant answers a question about the captured traffic through the MCP server (the tool replies are from a real session, shortened to the lines that matter):

Tool groups (see HttpTrafficMonitor.McpServer/Tools/):
| File | Covers |
|---|---|
ProxyTools | Start/stop capture, proxy status, pause/resume |
TrafficTools | List/get requests, domains, traffic stats |
FilterTools | Filter requests, save/load/delete filter presets |
AlertTools | Manage alert rules, read alert events, toggle sound |
AutoResponderTools | Manage mock/auto-responder rules and status |
ReplayTools | Replay a captured request |
SessionTools | Save/load capture sessions |
ExportTools | Export as CSV / HAR / JSON / cURL / Postman |
BookmarkTools | Toggle/list bookmarks |
ContentTools | Encode/decode request or response bodies |
StatsTools | Traffic statistics, TLS info |
Add it to an MCP-capable client (e.g. Claude Code / Claude Desktop) pointing at the built HttpTrafficMonitor.McpServer.exe; the main HttpTrafficMonitor.exe must already be running and capturing for most tools to return data.
Configuring the MCP server
From a release download — unzip HttpTrafficMonitor.McpServer-<version>-win-x64.zip anywhere (e.g. C:\Tools) and point your client at the exe; no build and no .NET install needed:
claude mcp add httptrafficmonitor -- "C:\Tools\HttpTrafficMonitor.McpServer\HttpTrafficMonitor.McpServer.exe"
For Claude Desktop, add this to %APPDATA%\Claude\claude_desktop_config.json:
{
  "mcpServers": {
    "httptrafficmonitor": {
      "command": "C:\\Tools\\HttpTrafficMonitor.McpServer\\HttpTrafficMonitor.McpServer.exe",
      "args": []
    }
  }
}
From source — build it first:
dotnet build HttpTrafficMonitor.McpServer/HttpTrafficMonitor.McpServer.csproj -c Debug
This produces HttpTrafficMonitor.McpServer/bin/Debug/net8.0/HttpTrafficMonitor.McpServer.exe. Adjust paths below if you build in Release or from a different clone location.
Claude Code — the repo ships a project-scoped .mcp.json in its root that starts the server with dotnet run --project HttpTrafficMonitor.McpServer, so opening the clone in Claude Code is enough (approve the httptrafficmonitor server when prompted) — no absolute paths to adjust. To register a built exe instead, use the CLI:
claude mcp add httptrafficmonitor -- "C:\Projects\httptrafficmonitr\HttpTrafficMonitor.McpServer\bin\Debug\net8.0\HttpTrafficMonitor.McpServer.exe"
which writes (or edit .mcp.json directly):
{
  "mcpServers": {
    "httptrafficmonitor": {
      "command": "C:\\Projects\\httptrafficmonitr\\HttpTrafficMonitor.McpServer\\bin\\Debug\\net8.0\\HttpTrafficMonitor.McpServer.exe",
      "args": []
    }
  }
}
Claude Desktop — add the same block to claude_desktop_config.json (%APPDATA%\Claude\claude_desktop_config.json):
{
  "mcpServers": {
    "httptrafficmonitor": {
      "command": "C:\\Projects\\httptrafficmonitr\\HttpTrafficMonitor.McpServer\\bin\\Debug\\net8.0\\HttpTrafficMonitor.McpServer.exe",
      "args": []
    }
  }
}
Running via dotnet instead of the exe (e.g. cross-platform host, or you'd rather not hardcode a self-contained exe path) — point command at dotnet and pass the DLL as the first arg:
{
  "mcpServers": {
    "httptrafficmonitor": {
      "command": "dotnet",
      "args": [
        "C:\\Projects\\httptrafficmonitr\\HttpTrafficMonitor.McpServer\\bin\\Debug\\net8.0\\HttpTrafficMonitor.McpServer.dll"
      ]
    }
  }
}
Optional environment variable (only needed if the main app's IPC API isn't on its default port):
{
  "mcpServers": {
    "httptrafficmonitor": {
      "command": "C:\\Projects\\httptrafficmonitr\\HttpTrafficMonitor.McpServer\\bin\\Debug\\net8.0\\HttpTrafficMonitor.McpServer.exe",
      "args": [],
      "env": {
        "HTM_API_URL": "http://localhost:18081"
      }
    }
  }
}
After editing the config, restart Claude Code / Claude Desktop, launch HttpTrafficMonitor.exe (as Administrator) and click Start, then the httptrafficmonitor tools become available to the assistant.
Requirements
- Windows 10/11
- .NET 8 SDK (
net8.0-windows, WPF) — only to build from source; the release downloads bring their own runtime - Administrator privileges — the app requests elevation via its manifest (
app.manifest,requireAdministrator), needed to register itself as the system proxy and install the local root CA
⚠️ HTTPS interception installs a root CA into your system trust store and lets the app read HTTPS traffic in plaintext. Use it only for development/debugging on machines you control — the app shows a warning dialog on first launch and restores your original proxy settings when you stop monitoring or close it.
Build & run
dotnet build HttpTrafficMonitor.csproj -c Debug
Run bin/Debug/net8.0-windows/HttpTrafficMonitor.exe (elevation prompt expected), or open HttpTrafficMonitor.sln in Visual Studio and hit F5.
To build the MCP server:
dotnet build HttpTrafficMonitor.McpServer/HttpTrafficMonitor.McpServer.csproj
Tech stack
- WPF on .NET 8, WPF-UI for Fluent Design
- Titanium.Web.Proxy for MITM proxying
- LiveChartsCore (SkiaSharp) for charts
- DiffPlex for the Compare view
ModelContextProtocol.NET SDK for the MCP server
Project structure
Models/          Request/session/alert/auto-responder/TLS data models
Services/        Proxy, alerts, export, replay, session, content decoding, IPC API, theming
ViewModels/      MVVM view models per view/panel
Views/           MainWindow + dialogs (Advanced Filter, Replay/Compose, Comparison)
HttpTrafficMonitor.McpServer/   Standalone MCP server (stdio) bridging to the running app's IPC API
UI automation
Interactive controls across the main window and dialogs carry AutomationProperties.AutomationId (e.g. Toolbar.StartButton, FilterBar.SearchTextBox, MainWindow.RequestsGrid, AdvancedFilter.ApplyFilterButton, AutoResponder.AddRuleButton) so the app can be driven and tested via UI Automation / test tooling without relying on fragile name- or coordinate-based lookups.
Contributing
Bug reports, feature ideas and pull requests are welcome. Open an issue with the bug-report or feature-request form, and read CONTRIBUTING.md for how to build and run the app and the MCP server from a fresh clone. Please report security problems privately as described in SECURITY.md, and follow the Code of Conduct. Changes are listed in CHANGELOG.md.
Similar repos


Languages
C#
99.9%
Windows desktop HTTP/HTTPS traffic monitor (MITM proxy, WPF) with an MCP server so AI assistants can inspect, filter, replay, and mock traffic
C#
13
66 commits
updated Oct 4, 2026
See what people are saying
README
HTTP Traffic Monitor
A free, open-source HTTP/HTTPS debugging proxy for Windows with a built-in MCP server — so Claude and other AI assistants can inspect, filter, replay and mock the traffic you capture.
For developers and testers on Windows who need to see what an app, a service or a browser really sends and receives: a Fiddler/Charles-style traffic inspector, MIT-licensed, that your AI assistant can drive too.
⬇ Download for Windows · ▶ Watch the demo · How it compares · MCP setup
Why pick it
- AI-ready out of the box — 42 MCP tools let an assistant start a capture, find the failing requests, replay them and set up mocks; no paid tier.
- Every app on the machine, not one browser tab — it captures system-wide as the Windows proxy and shows which process sent each request.
- Free and open source — MIT license, Fluent UI with light and dark themes.
From download to the first captured request
- Download the app zip from Releases and unzip it (or build from source).
- Run
HttpTrafficMonitor.exe, accept the administrator prompt and read the security notice. - Click Start — the app installs its local root CA (confirm if Windows asks) and becomes the system proxy.
- Open any website or call an API: the requests appear in the grid. Click one to see its headers, body, timing and certificate.
See it in action
How it compares
| HTTP Traffic Monitor | Fiddler Everywhere | Charles | mitmproxy | Browser DevTools | |
|---|---|---|---|---|---|
| Price | Free, open source (MIT) | Paid subscription | Paid license | Free, open source | Free, part of the browser |
| Platforms | Windows 10/11 | Windows, macOS, Linux | Windows, macOS, Linux | Windows, macOS, Linux | Wherever the browser runs |
| Captures traffic of other apps, not just the browser | Yes, system-wide, with the process name | Yes | Yes | Yes | No — only the page it is attached to |
| Interface | Desktop app | Desktop app | Desktop app | Terminal and web UI | Panel in the browser |
| MCP server for AI assistants | Built in, free | Built in, Pro tier and up | Not built in | Not built in | Not built in |
Choose this tool when you are on Windows and want a free graphical inspector that an AI assistant can work with. If you need macOS or Linux, or to script the proxy itself, mitmproxy, Charles or Fiddler Everywhere fit better. (Details of the other tools as of October 2026 — corrections welcome.)
Download
Get the latest build from Releases — Windows 10/11 x64, nothing else to install (the .NET runtime is included):
HttpTrafficMonitor-<version>-win-x64.zip— the desktop app. Unzip it and runHttpTrafficMonitor\HttpTrafficMonitor.exe(it asks for administrator rights).HttpTrafficMonitor.McpServer-<version>-win-x64.zip— the MCP server as a singleHttpTrafficMonitor.McpServer.exe; see Configuring the MCP server.
The builds are not code-signed, so Windows SmartScreen may warn on first start: choose More info, then Run anyway.
What it does
HttpTrafficMonitor sits between your machine and the internet as a local proxy (via Titanium.Web.Proxy), decrypts HTTPS on the fly with a locally-generated root CA, and shows every request/response as it happens — searchable, filterable, and exportable.
The screenshots show demo traffic only: curl calls to public sample APIs (JSONPlaceholder, httpbin, example.com, GitHub). The 404 and 500 responses among them are requested on purpose, to show how failed requests stand out.
Features
Capture & inspect
- Start/Stop system-wide HTTP/HTTPS capture with one click (installs a root CA for TLS interception, restored automatically on Stop)
- Live request grid: method, URL, status, size, duration, colored badges, and a red highlight for slow requests
- Quick search plus dedicated Process / Domain / Method / Status filters
- Per-request detail tabs: Request, Response, Timing (DNS lookup, TCP connect, TLS handshake, time to first byte and download, measured for each request), Certificate (chain, issuer, validity, thumbprint), Decoded (gzip/brotli/base64 aware), and Exclusions
Filtering
Build multi-condition filters (field / operator / value, AND-ed or OR-ed) and save them as named presets for reuse.
Replay & compose
Edit and resend any captured request, or compose a brand-new one from scratch, with side-by-side original vs. new response.
Compare
Pick two requests and get a line-by-line diff (via DiffPlex) across headers and bodies.
Alerts
Rule-based alerting on status codes, response time thresholds, or custom patterns, with a live event feed. Below, the built-in Server Errors (5xx) rule has caught the demo request to httpbin.org/status/500.
Auto-Responder (mocking)
Intercept matching requests (by URL/regex + method) and return a canned status code, headers, and body — or serve a file — with an optional artificial delay. Great for mocking flaky or unavailable backends during development.
Graphs
Live requests-per-second and bandwidth charts, plus top-domains and top-processes breakdowns (via LiveCharts2).
Sessions & export
Save/load full capture sessions, bookmark interesting requests, and export selections as CSV, HAR, JSON, cURL, or Postman collection.
Light & dark themes
Full Fluent Design theming via WPF-UI.
MCP Server
HttpTrafficMonitor.McpServer exposes the running app to AI assistants over the Model Context Protocol (stdio transport). The main app hosts a small local REST API (http://localhost:18081/api/...) via IpcApiService; the MCP server is a thin process that talks to that API and surfaces it as MCP tools — so an assistant can start/stop capture, inspect and filter requests, manage alerts and auto-responder rules, replay/compose requests, and export data, all without touching the UI.
Here an assistant answers a question about the captured traffic through the MCP server (the tool replies are from a real session, shortened to the lines that matter):
Tool groups (see HttpTrafficMonitor.McpServer/Tools/):
| File | Covers |
|---|---|
ProxyTools | Start/stop capture, proxy status, pause/resume |
TrafficTools | List/get requests, domains, traffic stats |
FilterTools | Filter requests, save/load/delete filter presets |
AlertTools | Manage alert rules, read alert events, toggle sound |
AutoResponderTools | Manage mock/auto-responder rules and status |
ReplayTools | Replay a captured request |
SessionTools | Save/load capture sessions |
ExportTools | Export as CSV / HAR / JSON / cURL / Postman |
BookmarkTools | Toggle/list bookmarks |
ContentTools | Encode/decode request or response bodies |
StatsTools | Traffic statistics, TLS info |
Add it to an MCP-capable client (e.g. Claude Code / Claude Desktop) pointing at the built HttpTrafficMonitor.McpServer.exe; the main HttpTrafficMonitor.exe must already be running and capturing for most tools to return data.
Configuring the MCP server
From a release download — unzip HttpTrafficMonitor.McpServer-<version>-win-x64.zip anywhere (e.g. C:\Tools) and point your client at the exe; no build and no .NET install needed:
claude mcp add httptrafficmonitor -- "C:\Tools\HttpTrafficMonitor.McpServer\HttpTrafficMonitor.McpServer.exe"
For Claude Desktop, add this to %APPDATA%\Claude\claude_desktop_config.json:
{
  "mcpServers": {
    "httptrafficmonitor": {
      "command": "C:\\Tools\\HttpTrafficMonitor.McpServer\\HttpTrafficMonitor.McpServer.exe",
      "args": []
    }
  }
}
From source — build it first:
dotnet build HttpTrafficMonitor.McpServer/HttpTrafficMonitor.McpServer.csproj -c Debug
This produces HttpTrafficMonitor.McpServer/bin/Debug/net8.0/HttpTrafficMonitor.McpServer.exe. Adjust paths below if you build in Release or from a different clone location.
Claude Code — the repo ships a project-scoped .mcp.json in its root that starts the server with dotnet run --project HttpTrafficMonitor.McpServer, so opening the clone in Claude Code is enough (approve the httptrafficmonitor server when prompted) — no absolute paths to adjust. To register a built exe instead, use the CLI:
claude mcp add httptrafficmonitor -- "C:\Projects\httptrafficmonitr\HttpTrafficMonitor.McpServer\bin\Debug\net8.0\HttpTrafficMonitor.McpServer.exe"
which writes (or edit .mcp.json directly):
{
  "mcpServers": {
    "httptrafficmonitor": {
      "command": "C:\\Projects\\httptrafficmonitr\\HttpTrafficMonitor.McpServer\\bin\\Debug\\net8.0\\HttpTrafficMonitor.McpServer.exe",
      "args": []
    }
  }
}
Claude Desktop — add the same block to claude_desktop_config.json (%APPDATA%\Claude\claude_desktop_config.json):
{
  "mcpServers": {
    "httptrafficmonitor": {
      "command": "C:\\Projects\\httptrafficmonitr\\HttpTrafficMonitor.McpServer\\bin\\Debug\\net8.0\\HttpTrafficMonitor.McpServer.exe",
      "args": []
    }
  }
}
Running via dotnet instead of the exe (e.g. cross-platform host, or you'd rather not hardcode a self-contained exe path) — point command at dotnet and pass the DLL as the first arg:
{
  "mcpServers": {
    "httptrafficmonitor": {
      "command": "dotnet",
      "args": [
        "C:\\Projects\\httptrafficmonitr\\HttpTrafficMonitor.McpServer\\bin\\Debug\\net8.0\\HttpTrafficMonitor.McpServer.dll"
      ]
    }
  }
}
Optional environment variable (only needed if the main app's IPC API isn't on its default port):
{
  "mcpServers": {
    "httptrafficmonitor": {
      "command": "C:\\Projects\\httptrafficmonitr\\HttpTrafficMonitor.McpServer\\bin\\Debug\\net8.0\\HttpTrafficMonitor.McpServer.exe",
      "args": [],
      "env": {
        "HTM_API_URL": "http://localhost:18081"
      }
    }
  }
}
After editing the config, restart Claude Code / Claude Desktop, launch HttpTrafficMonitor.exe (as Administrator) and click Start, then the httptrafficmonitor tools become available to the assistant.
Requirements
- Windows 10/11
- .NET 8 SDK (
net8.0-windows, WPF) — only to build from source; the release downloads bring their own runtime - Administrator privileges — the app requests elevation via its manifest (
app.manifest,requireAdministrator), needed to register itself as the system proxy and install the local root CA
⚠️ HTTPS interception installs a root CA into your system trust store and lets the app read HTTPS traffic in plaintext. Use it only for development/debugging on machines you control — the app shows a warning dialog on first launch and restores your original proxy settings when you stop monitoring or close it.
Build & run
dotnet build HttpTrafficMonitor.csproj -c Debug
Run bin/Debug/net8.0-windows/HttpTrafficMonitor.exe (elevation prompt expected), or open HttpTrafficMonitor.sln in Visual Studio and hit F5.
To build the MCP server:
dotnet build HttpTrafficMonitor.McpServer/HttpTrafficMonitor.McpServer.csproj
Tech stack
- WPF on .NET 8, WPF-UI for Fluent Design
- Titanium.Web.Proxy for MITM proxying
- LiveChartsCore (SkiaSharp) for charts
- DiffPlex for the Compare view
ModelContextProtocol.NET SDK for the MCP server
Project structure
Models/          Request/session/alert/auto-responder/TLS data models
Services/        Proxy, alerts, export, replay, session, content decoding, IPC API, theming
ViewModels/      MVVM view models per view/panel
Views/           MainWindow + dialogs (Advanced Filter, Replay/Compose, Comparison)
HttpTrafficMonitor.McpServer/   Standalone MCP server (stdio) bridging to the running app's IPC API
UI automation
Interactive controls across the main window and dialogs carry AutomationProperties.AutomationId (e.g. Toolbar.StartButton, FilterBar.SearchTextBox, MainWindow.RequestsGrid, AdvancedFilter.ApplyFilterButton, AutoResponder.AddRuleButton) so the app can be driven and tested via UI Automation / test tooling without relying on fragile name- or coordinate-based lookups.
Contributing
Bug reports, feature ideas and pull requests are welcome. Open an issue with the bug-report or feature-request form, and read CONTRIBUTING.md for how to build and run the app and the MCP server from a fresh clone. Please report security problems privately as described in SECURITY.md, and follow the Code of Conduct. Changes are listed in CHANGELOG.md.
Similar repos
Languages
C#
99.9%