Autonomous ADS-B Flight Anomaly Detection Engine built with Claude
HTML
13
4 commits
updated Oct 14, 2026




"I fed live ADS-B flight trajectories into Claude to map unexplained flight patterns. Here are the bizarre anomalies we found."
SkyWatch is an open-source flight telemetry analysis engine. It connects directly to OpenSky Network satellites, ingests thousands of live ADS-B transponder broadcasts across US airspace, and applies 7 aeronautical kinematic heuristics to automatically detect holding patterns, rapid emergency descents, aerial survey grids, and high-deviation diversions, backed by full mathematical proof.
flight_map.html)The primary output is a live, clickable web application featuring an on-screen tactical HUD header, classification legend, and detailed telemetry popups for every aircraft. Users can toggle between standard map and tactical dark canvas modes:
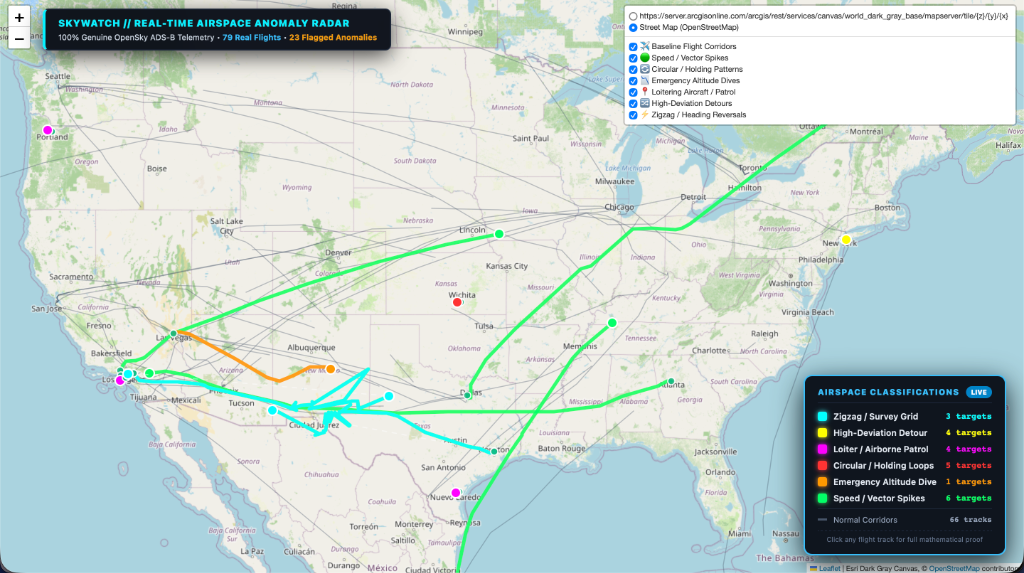
High-contrast anomaly trajectories plotted over geographical reference points with live HUD header and on-screen classification legend.
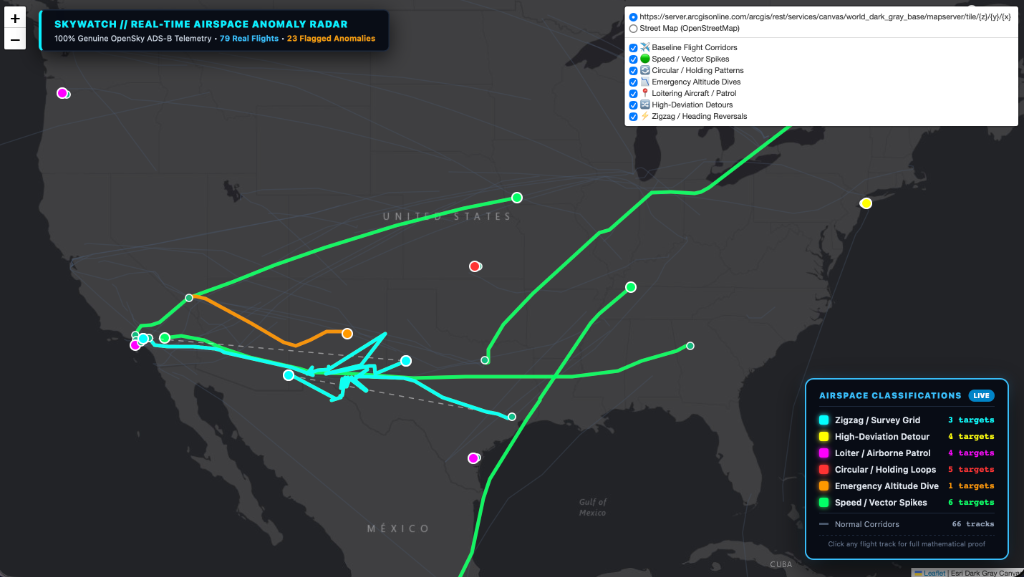
Night-vision tactical radar view on Dark Gray canvas, isolating neon vectors, holding stacks, and detour comparison lines.
anomaly_map.png)A high-resolution 300 DPI analytical map with target zoom insets and vertical profile graphs:
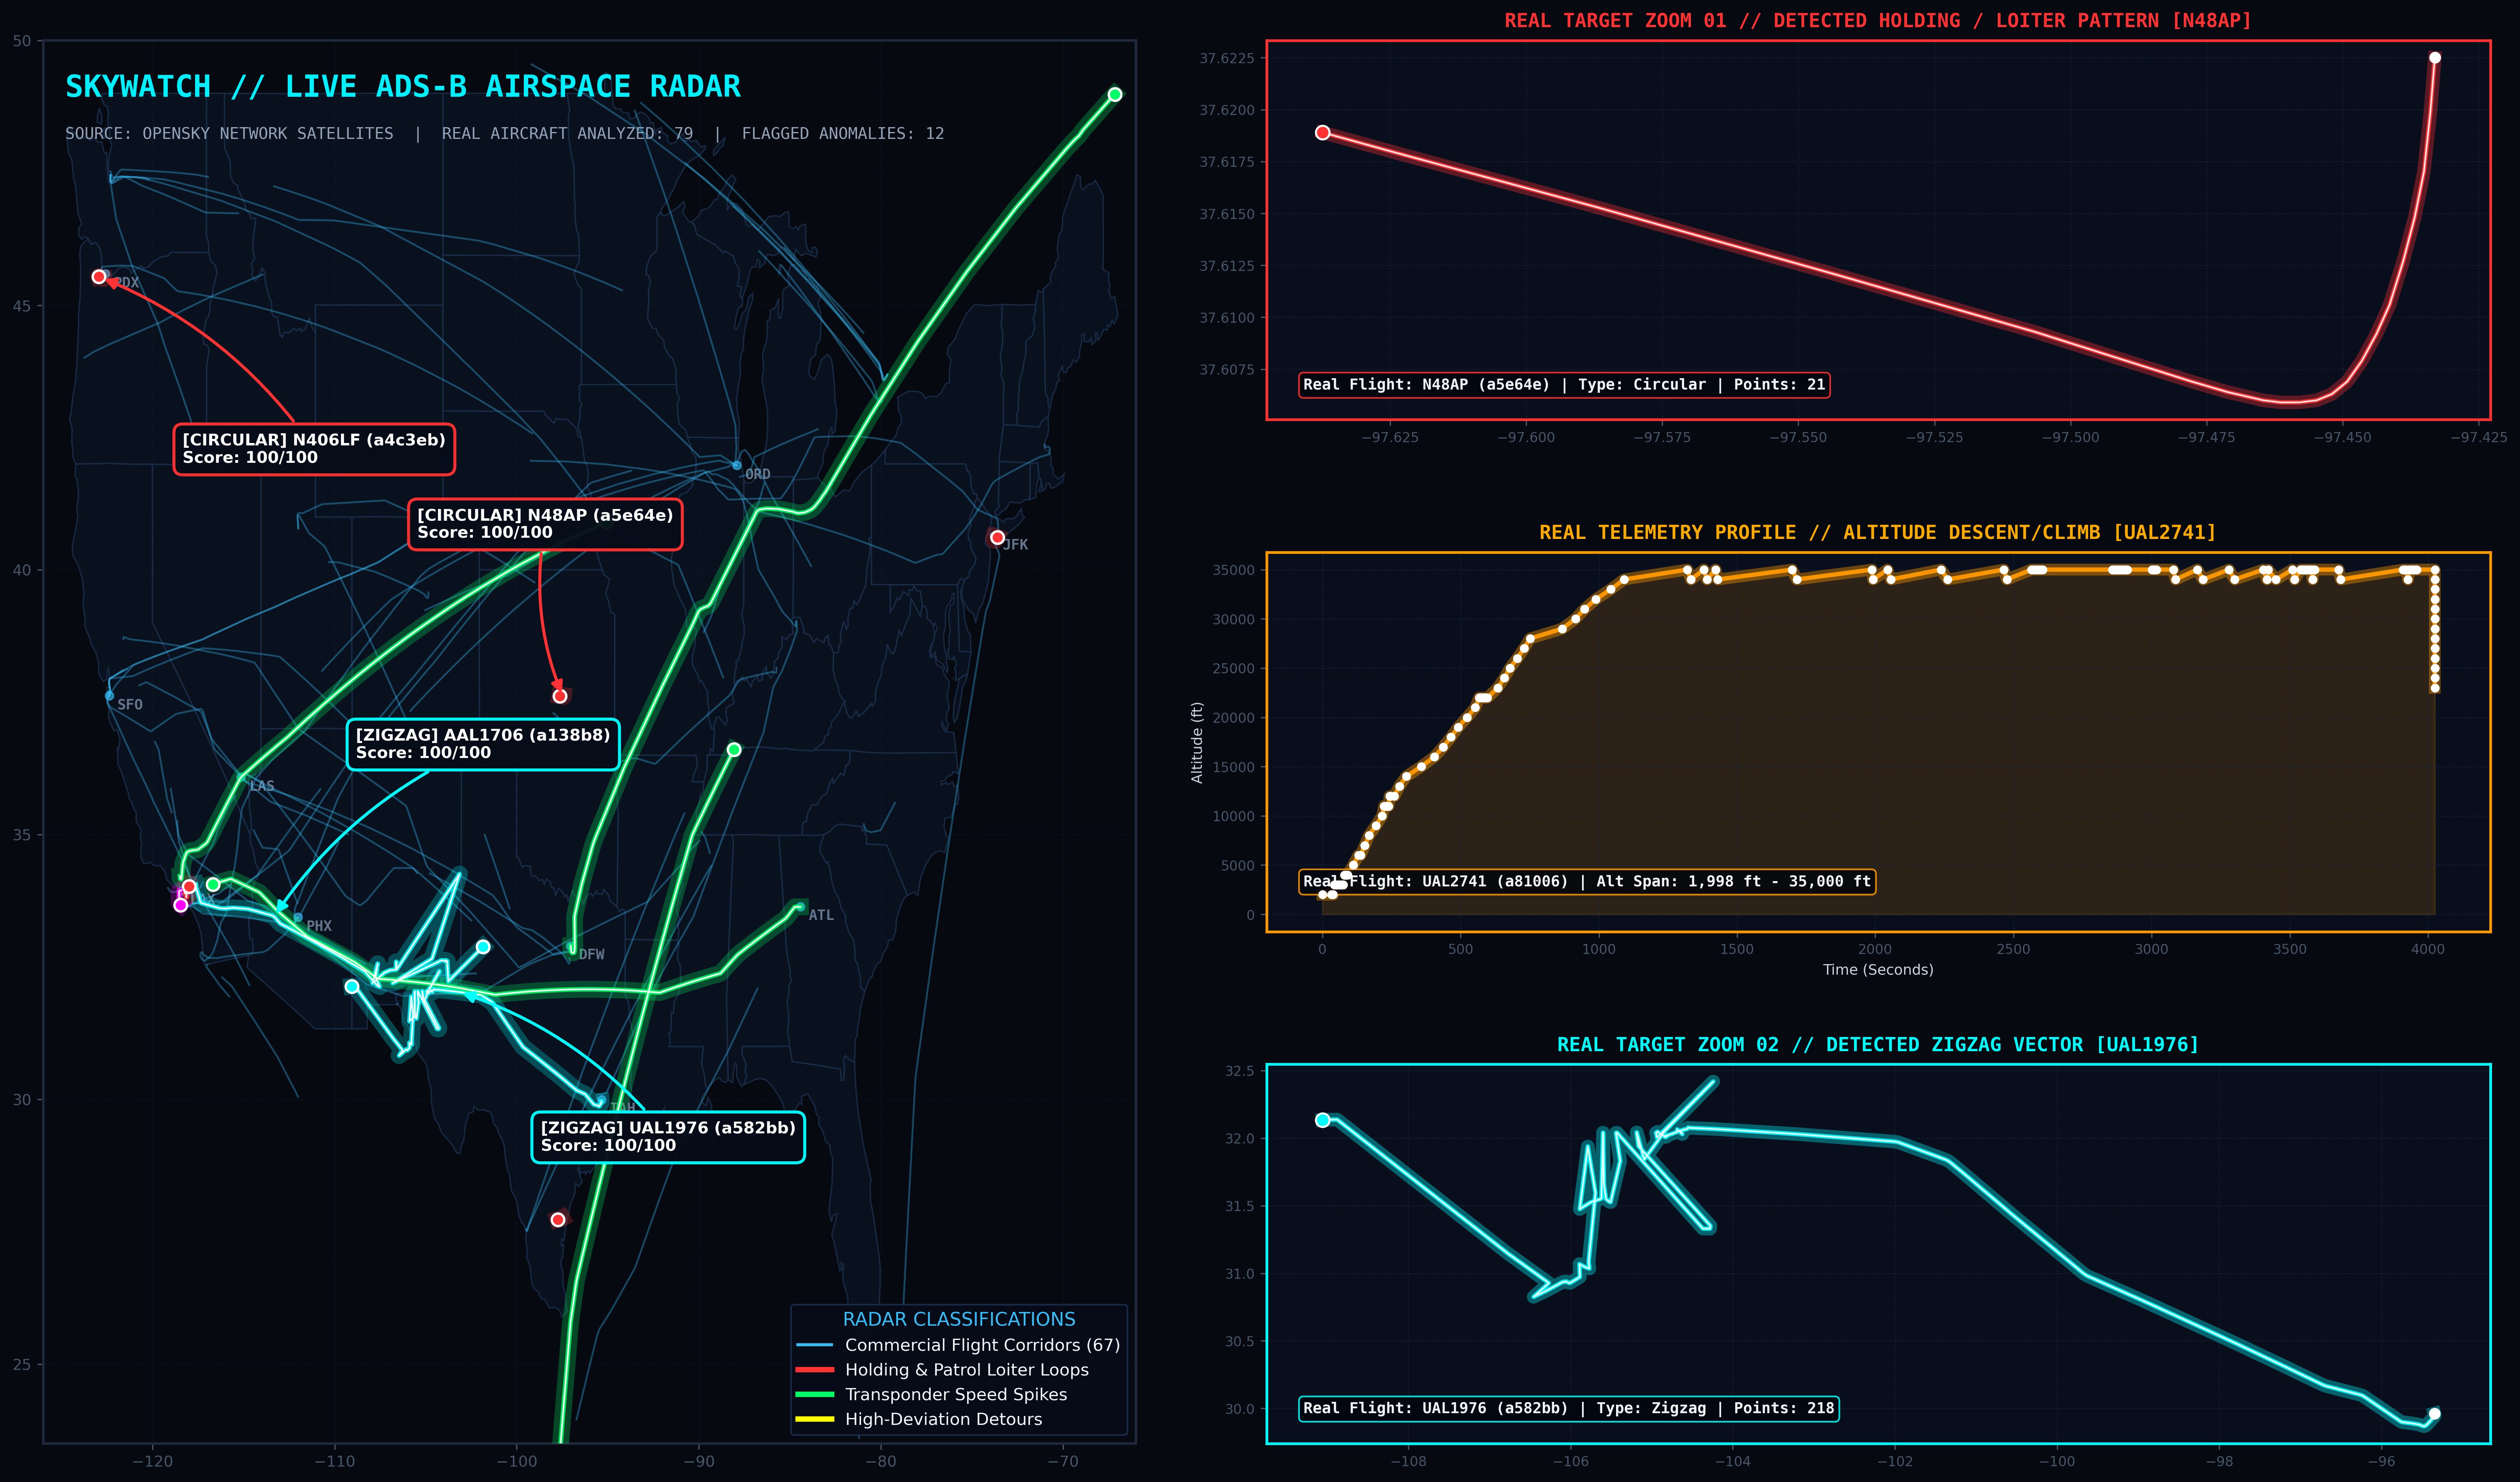
High-contrast tactical briefing showing continental trajectories alongside target inspection zoom cards and real altitude dive profiles.
Every trajectory is evaluated against seven independent aeronautical algorithms:
| # | Detector | Color Code | What It Isolates | Heuristic Logic |
|---|---|---|---|---|
| 1 | Circular / Holding Loops | 🟥 Red (#ff3333) | Holding stacks, VIP staging, reconnaissance | Evaluates spatial return frequency: loops >= 2 returning within <= 12 km over dt >= 120s inside a <= 60 km perimeter. |
| 2 | Emergency Altitude Dives | 🟧 Orange (#ff9900) | Rapid descents, emergency drops, cabin depressurization | Plunge detector: flags descents >= 3,500 ft in <= 90s at >= 3,500 ft/min (filters out routine takeoff climbs). |
| 3 | Airborne Loitering / Patrol | 🟪 Magenta (#ff00ff) | Police/medical helicopters, surveillance, border patrol | Perimeter containment: bounding box diagonal <= 45 km across airborne duration >= 5.0 min with center coordinate calculation. |
| 4 | Zigzag / Survey Grids | 💎 Cyan (#00ffff) | Precision LIDAR grids, photogrammetry, aerial search | Flight-leg course vector segmentation (>= 0.8 km / dt >= 30s): isolates sharp reciprocal heading reversals >= 70 deg. |
| 5 | High-Deviation Detours | 🟨 Yellow (#ffff00) | Severe ATC route diversions, holding delays, area scans | Computes ratio of cumulative path distance against great-circle Haversine displacement: Ratio >= 1.50x, rendering dashed direct comparison vectors. |
| 6 | Speed / Vector Spikes | 🟩 Green (#00ff66) | Mach-speed anomalies, sensor telemetry jumps | Ground speed derived from ADS-B coordinate differentials: flags speeds > 680 kt or extreme velocity spikes. |
| 7 | Sustained Low-Altitude Flight | 🟠 Deep Orange (#ff6600) | Low-level terrain flights, pipeline inspections | Excludes takeoff/landing phases; flags sustained cruising < 800 ft AGL for > 5 minutes. |
Anyone can clone and run SkyWatch locally in under 2 minutes.
If you just want to interact with the map immediately without running any Python scripts:
data/results/flight_map.html by double-clicking it in your file manager (or opening it in Chrome/Safari/Edge).Open Terminal on your computer and run:
git clone https://github.com/Aashvath/skywatch.git
cd skywatch
Install the required lightweight Python libraries:
pip install -r requirements.txt
(Dependencies: requests, folium, matplotlib, numpy, tqdm).
Download live ADS-B state vectors and trajectories directly from OpenSky Network satellites:
python collect_data.py
(Note: SkyWatch comes pre-packaged with genuine flight tracks in data/tracks.json, so you can proceed directly to Step 4 even without internet access).
Execute the 7 algorithms to mathematically isolate abnormal flights:
python detect_anomalies.py
Terminal Output:
============================================================
  🔍 ANOMALY DETECTION RESULTS
============================================================
   Tracks analyzed : 79
   Anomalies found : 23

   Breakdown:
     💨 Speed: 6
     🔄 Circular: 5
     📍 Loiter: 4
     🔀 Path Inefficiency: 4
     ⚡ Zigzag: 3
     📉 Altitude: 1
Generate the interactive HTML map and static radar briefing:
python visualize.py
To open the web map directly in your browser:
open data/results/flight_map.html
start data/results/flight_map.html
xdg-open data/results/flight_map.html
skywatch/
├── config.py             # Thresholds, bounding boxes, colors, and API settings
├── collect_data.py       # OpenSky ADS-B REST harvester with auto-retry and stratification
├── detect_anomalies.py   # 7 mathematical detection algorithms & kinematic scoring
├── visualize.py          # Map generator (interactive Folium HTML + 300 DPI radar map)
├── requirements.txt      # Python dependencies
└── data/
    ├── us_states.json    # US state geographic boundary polygons
    └── results/
        ├── web_map.png           # Actual screenshot: Street map view
        ├── web_map_dark.png      # Actual screenshot: Tactical dark canvas view
        ├── anomaly_map.png       # 300 DPI tactical HUD briefing
        ├── flight_map.html       # Self-contained interactive web map
        ├── anomalies_summary.json# Clean JSON export of all flagged targets
        └── report.txt            # Human-readable incident briefing
This entire pipeline was architected, written, and debugged using Claude by Anthropic.
The algorithmic prompts, XML constraint frameworks, and prompt-chaining techniques used to build SkyWatch's mathematical heuristics are documented in:
📘 Mastering Claude: The Practical Playbook for High-Output Work, Coding, and Automation
Under 100 pages • No academic fluff • Production agentic workflows, CLI mastery, and 100+ MCP integration maps.
Distributed under the MIT License. Real-world flight telemetry provided via the OpenSky Network open API.
Autonomous ADS-B Flight Anomaly Detection Engine built with Claude
HTML
13
4 commits
updated Oct 14, 2026
"I fed live ADS-B flight trajectories into Claude to map unexplained flight patterns. Here are the bizarre anomalies we found."
SkyWatch is an open-source flight telemetry analysis engine. It connects directly to OpenSky Network satellites, ingests thousands of live ADS-B transponder broadcasts across US airspace, and applies 7 aeronautical kinematic heuristics to automatically detect holding patterns, rapid emergency descents, aerial survey grids, and high-deviation diversions, backed by full mathematical proof.
flight_map.html)The primary output is a live, clickable web application featuring an on-screen tactical HUD header, classification legend, and detailed telemetry popups for every aircraft. Users can toggle between standard map and tactical dark canvas modes:
High-contrast anomaly trajectories plotted over geographical reference points with live HUD header and on-screen classification legend.
Night-vision tactical radar view on Dark Gray canvas, isolating neon vectors, holding stacks, and detour comparison lines.
anomaly_map.png)A high-resolution 300 DPI analytical map with target zoom insets and vertical profile graphs:
High-contrast tactical briefing showing continental trajectories alongside target inspection zoom cards and real altitude dive profiles.
Every trajectory is evaluated against seven independent aeronautical algorithms:
| # | Detector | Color Code | What It Isolates | Heuristic Logic |
|---|---|---|---|---|
| 1 | Circular / Holding Loops | 🟥 Red (#ff3333) | Holding stacks, VIP staging, reconnaissance | Evaluates spatial return frequency: loops >= 2 returning within <= 12 km over dt >= 120s inside a <= 60 km perimeter. |
| 2 | Emergency Altitude Dives | 🟧 Orange (#ff9900) | Rapid descents, emergency drops, cabin depressurization | Plunge detector: flags descents >= 3,500 ft in <= 90s at >= 3,500 ft/min (filters out routine takeoff climbs). |
| 3 | Airborne Loitering / Patrol | 🟪 Magenta (#ff00ff) | Police/medical helicopters, surveillance, border patrol | Perimeter containment: bounding box diagonal <= 45 km across airborne duration >= 5.0 min with center coordinate calculation. |
| 4 | Zigzag / Survey Grids | 💎 Cyan (#00ffff) | Precision LIDAR grids, photogrammetry, aerial search | Flight-leg course vector segmentation (>= 0.8 km / dt >= 30s): isolates sharp reciprocal heading reversals >= 70 deg. |
| 5 | High-Deviation Detours | 🟨 Yellow (#ffff00) | Severe ATC route diversions, holding delays, area scans | Computes ratio of cumulative path distance against great-circle Haversine displacement: Ratio >= 1.50x, rendering dashed direct comparison vectors. |
| 6 | Speed / Vector Spikes | 🟩 Green (#00ff66) | Mach-speed anomalies, sensor telemetry jumps | Ground speed derived from ADS-B coordinate differentials: flags speeds > 680 kt or extreme velocity spikes. |
| 7 | Sustained Low-Altitude Flight | 🟠 Deep Orange (#ff6600) | Low-level terrain flights, pipeline inspections | Excludes takeoff/landing phases; flags sustained cruising < 800 ft AGL for > 5 minutes. |
Anyone can clone and run SkyWatch locally in under 2 minutes.
If you just want to interact with the map immediately without running any Python scripts:
data/results/flight_map.html by double-clicking it in your file manager (or opening it in Chrome/Safari/Edge).Open Terminal on your computer and run:
git clone https://github.com/Aashvath/skywatch.git
cd skywatch
Install the required lightweight Python libraries:
pip install -r requirements.txt
(Dependencies: requests, folium, matplotlib, numpy, tqdm).
Download live ADS-B state vectors and trajectories directly from OpenSky Network satellites:
python collect_data.py
(Note: SkyWatch comes pre-packaged with genuine flight tracks in data/tracks.json, so you can proceed directly to Step 4 even without internet access).
Execute the 7 algorithms to mathematically isolate abnormal flights:
python detect_anomalies.py
Terminal Output:
============================================================
  🔍 ANOMALY DETECTION RESULTS
============================================================
   Tracks analyzed : 79
   Anomalies found : 23

   Breakdown:
     💨 Speed: 6
     🔄 Circular: 5
     📍 Loiter: 4
     🔀 Path Inefficiency: 4
     ⚡ Zigzag: 3
     📉 Altitude: 1
Generate the interactive HTML map and static radar briefing:
python visualize.py
To open the web map directly in your browser:
open data/results/flight_map.html
start data/results/flight_map.html
xdg-open data/results/flight_map.html
skywatch/
├── config.py             # Thresholds, bounding boxes, colors, and API settings
├── collect_data.py       # OpenSky ADS-B REST harvester with auto-retry and stratification
├── detect_anomalies.py   # 7 mathematical detection algorithms & kinematic scoring
├── visualize.py          # Map generator (interactive Folium HTML + 300 DPI radar map)
├── requirements.txt      # Python dependencies
└── data/
    ├── us_states.json    # US state geographic boundary polygons
    └── results/
        ├── web_map.png           # Actual screenshot: Street map view
        ├── web_map_dark.png      # Actual screenshot: Tactical dark canvas view
        ├── anomaly_map.png       # 300 DPI tactical HUD briefing
        ├── flight_map.html       # Self-contained interactive web map
        ├── anomalies_summary.json# Clean JSON export of all flagged targets
        └── report.txt            # Human-readable incident briefing
This entire pipeline was architected, written, and debugged using Claude by Anthropic.
The algorithmic prompts, XML constraint frameworks, and prompt-chaining techniques used to build SkyWatch's mathematical heuristics are documented in:
📘 Mastering Claude: The Practical Playbook for High-Output Work, Coding, and Automation
Under 100 pages • No academic fluff • Production agentic workflows, CLI mastery, and 100+ MCP integration maps.
Distributed under the MIT License. Real-world flight telemetry provided via the OpenSky Network open API.



