ggplot port for python
See the code
ggplot is a Python implementation of the grammar of graphics. It is not intended
to be a feature-for-feature port of ggplot2 for R--though
there is much greatness in ggplot2, the Python world could stand to benefit
from it. So there will be feature overlap, but not neccessarily mimicry
(after all, R is a little weird).
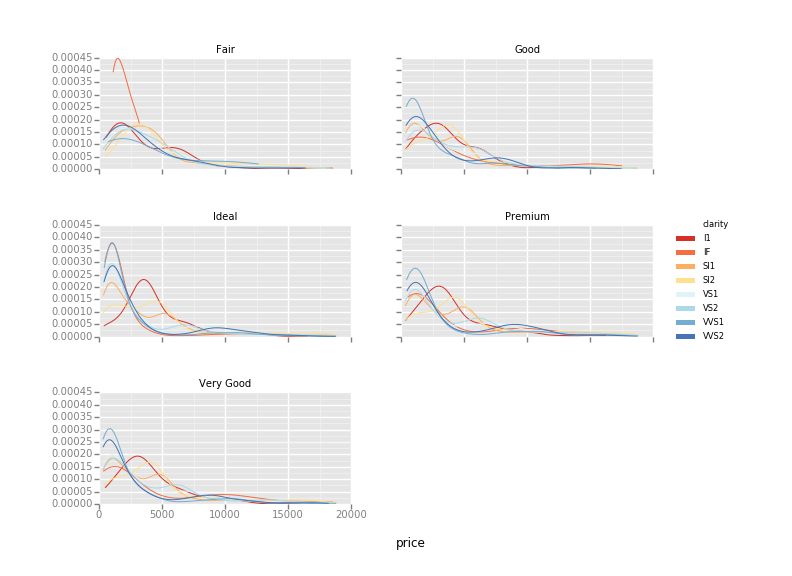
You can do cool things like this:
ggplot(diamonds, aes(x='price', color='clarity')) + \
    geom_density() + \
    scale_color_brewer(type='div', palette=7) + \
    facet_wrap('cut')
$ pip install -U ggplot
# or
$ conda install -c conda-forge ggplot
# or
pip install git+https://github.com/yhat/ggplot.git
Examples are the best way to learn. There is a Jupyter Notebook full of them. There are also notebooks that show how to do particular things with ggplot (i.e. make a scatter plot or make a histogram).
It's gone--the windows, the doors, everything. Just kidding, you can find it here, though I'm not sure why you'd want to look at it. The data grouping and manipulation bits were re-written (so they actually worked) with things like facets in mind.
Thanks to all of the ggplot contributors! See contributing.md.
(top 24 of 36)
128 followers · starred Jul 2014
686 followers · starred Feb 2018
712 followers · starred Nov 2013
460 followers · starred Oct 2013
ggplot port for python
See the code
ggplot is a Python implementation of the grammar of graphics. It is not intended
to be a feature-for-feature port of ggplot2 for R--though
there is much greatness in ggplot2, the Python world could stand to benefit
from it. So there will be feature overlap, but not neccessarily mimicry
(after all, R is a little weird).
You can do cool things like this:
ggplot(diamonds, aes(x='price', color='clarity')) + \
    geom_density() + \
    scale_color_brewer(type='div', palette=7) + \
    facet_wrap('cut')
$ pip install -U ggplot
# or
$ conda install -c conda-forge ggplot
# or
pip install git+https://github.com/yhat/ggplot.git
Examples are the best way to learn. There is a Jupyter Notebook full of them. There are also notebooks that show how to do particular things with ggplot (i.e. make a scatter plot or make a histogram).
It's gone--the windows, the doors, everything. Just kidding, you can find it here, though I'm not sure why you'd want to look at it. The data grouping and manipulation bits were re-written (so they actually worked) with things like facets in mind.
Thanks to all of the ggplot contributors! See contributing.md.
(top 24 of 36)
128 followers · starred Jul 2014
686 followers · starred Feb 2018
712 followers · starred Nov 2013
460 followers · starred Oct 2013



