An open toolkit and public dataset hub for collecting, sanitizing, analyzing, and visualizing coding agent traces.
See the codeA real-world Claude / Codex trace & open toolkit for coding-agent workload analysis.
Collect · sanitize · analyze · visualize the LLM-invocation traces that coding agents actually produce in the wild — then explore them in your browser.
🌐 Live demo · Quickstart · Dataset · Experiments · Web app · Data format





Coding agents like Claude Code and Codex quietly emit a rich event log every time they run: each LLM invocation, every tool call, the prompt-cache splits, and the timing in between. TraceLab turns those scattered local session files into a clean, sanitized, analyzable dataset — and ships the tooling to reproduce every figure, plus a web app to explore traces (yours or ours) without writing any code.
collect → sanitize → analyze → validate, each stage a single command.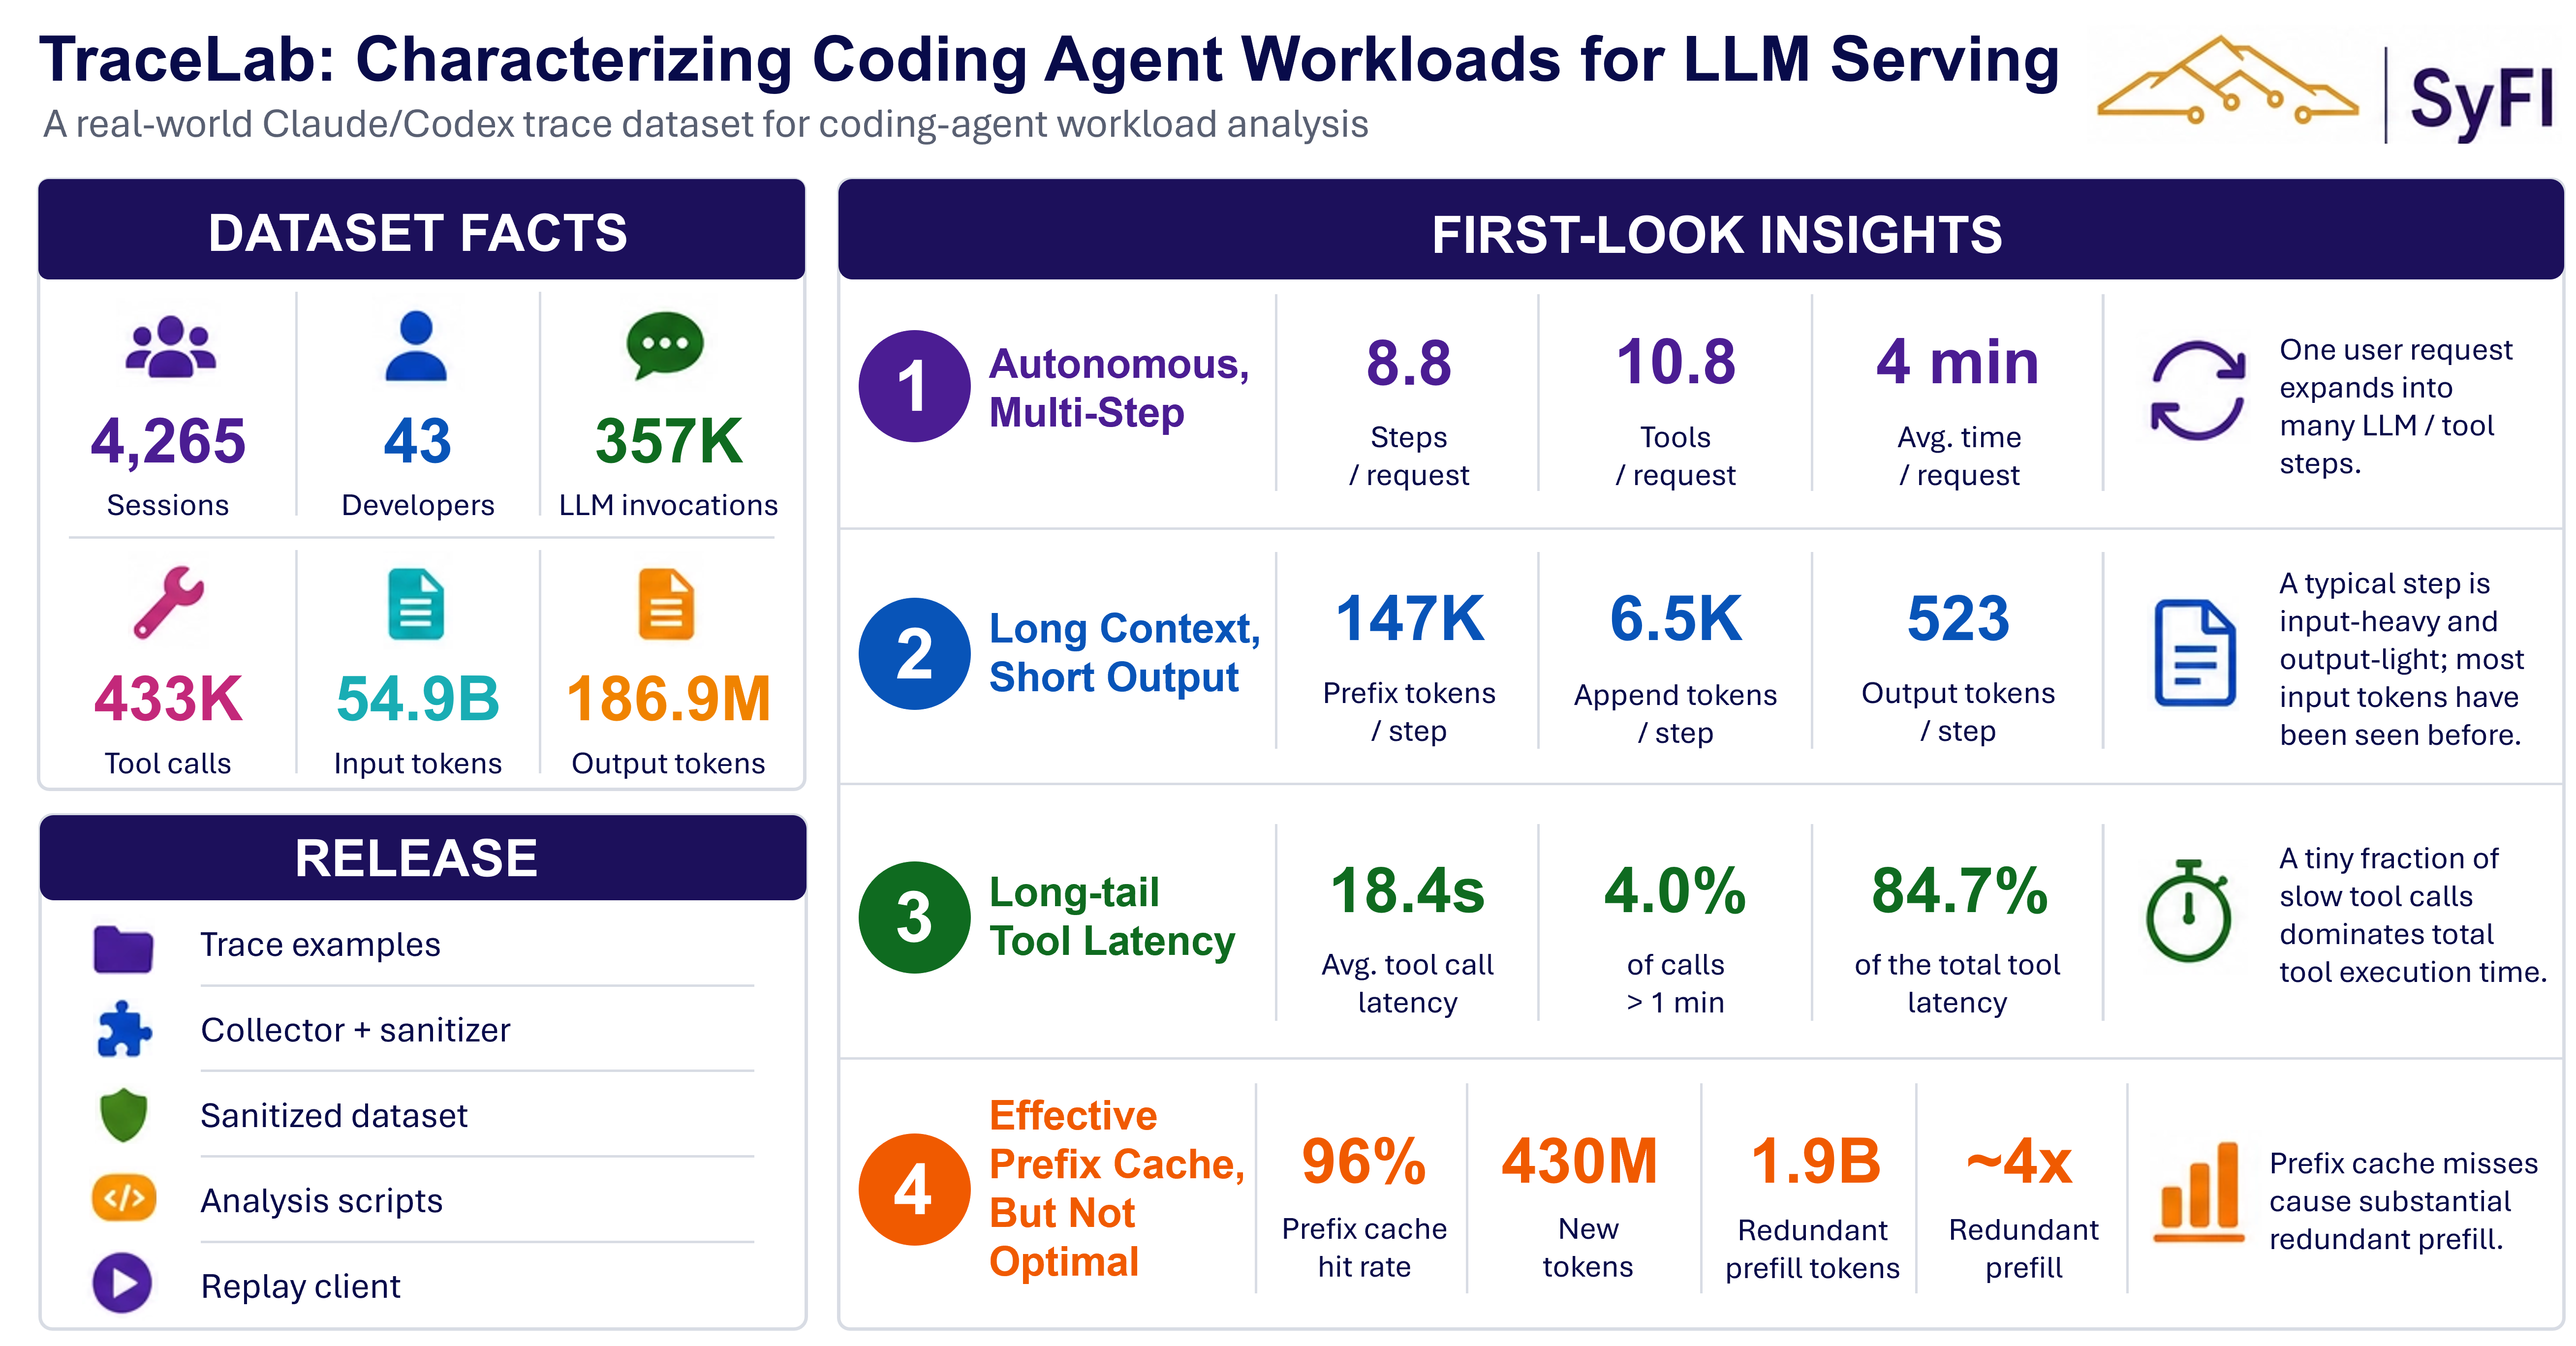
Install dependencies with uv:
uv sync
Download the pinned release assets, then run any experiment against them:
mkdir -p trace
curl -L --fail -o trace/syfi_coding_trace.duckdb \
  https://github.com/uw-syfi/TraceLab/releases/latest/download/syfi_coding_trace.duckdb

# Headline aggregate facts (add --json for machine-readable output)
uv run python artifacts/trace_facts/overview_summary/analyze.py \
  --db trace/syfi_coding_trace.duckdb

# Regenerate all analysis artifacts from the released DuckDB
uv run python artifacts/run_all.py
See The dataset for the full download + checksum recipe.
Turn your local Claude/Codex history into a shareable, sanitized trace and regenerate every figure:
collection_id="20260724-100b"
collection_directory="trace/collections/${collection_id}"

# 1. Collect a private normalized trace (existing history is retained)
uv run python scripts/collect_llm_traces.py \
  --extract-rounds "${collection_directory}/merged.private.jsonl"

# 2. Sanitize it (pseudonymize ids, strip local paths & tool inputs)
uv run python scripts/sanitize_round_trace.py \
  "${collection_directory}/merged.private.jsonl" \
  -o "${collection_directory}/merged.public.jsonl"

# 3. Materialize the sanitized trace once
uv run python artifacts/utils/trace_db.py \
  "${collection_directory}/merged.public.jsonl" \
  "${collection_directory}/merged.public.duckdb"

# 4. Regenerate every analysis from DuckDB
uv run python artifacts/run_all.py \
  --db "${collection_directory}/merged.public.duckdb"

# 5. Run validator analyses from the same DuckDB
uv run python validators/run_all.py --db "${collection_directory}/merged.public.duckdb"
Prefer a UI? Drag a trace export into the web app and get the same analytics in your browser — nothing leaves your machine.
The sanitized all-user trace and a prebuilt DuckDB database are distributed as GitHub Release assets (not committed to Git history).
|
Assets
SHA256
|
mkdir -p trace
curl -L --fail \
  -o trace/syfi_coding_trace.jsonl.gz \
  https://github.com/uw-syfi/TraceLab/releases/download/v0.0.1/syfi_coding_trace.jsonl.gz
curl -L --fail \
  -o trace/syfi_coding_trace.duckdb \
  https://github.com/uw-syfi/TraceLab/releases/download/v0.0.1/syfi_coding_trace.duckdb

echo "9d265eae69a31cae203848bea936f018148eed7ca8bf56050c5abe96da0b4e6b  trace/syfi_coding_trace.jsonl.gz" | sha256sum -c -
echo "97715265367cc72376475f5d444c8e1900b88cab1482aa7b9a742894d9f15619  trace/syfi_coding_trace.duckdb"   | sha256sum -c -
gzip -t trace/syfi_coding_trace.jsonl.gz
Always fetch the newest published assets with the latest redirect:
curl -L --fail -o trace/syfi_coding_trace.jsonl.gz \
  https://github.com/uw-syfi/TraceLab/releases/latest/download/syfi_coding_trace.jsonl.gz
curl -L --fail -o trace/syfi_coding_trace.duckdb \
  https://github.com/uw-syfi/TraceLab/releases/latest/download/syfi_coding_trace.duckdb
Use DuckDB for analysis. If another tool specifically requires JSONL, decompress into $TMPDIR
instead of creating a loose file at the trace/ root:
uv run python artifacts/trace_facts/overview_summary/analyze.py \
  --db trace/syfi_coding_trace.duckdb
gzip -cd trace/syfi_coding_trace.jsonl.gz > "$TMPDIR/syfi_coding_trace.jsonl"
🔒 The dataset is licensed under CC BY 4.0 and is fully sanitized — ids are pseudonymized and local context (paths,
cwd, tool inputs) is stripped before release. Please use it responsibly and don't attempt re-identification.
TraceLab/
├── scripts/      # data pipeline — collection, extraction, sanitizing
├── artifacts/    # analysis & plotting experiments, by category, + shared utils/
├── validators/   # integrity / denominator / formula audits (kept out of the plot tree)
├── trace/        # generated normalized JSONL traces (gitignored outputs)
├── docs/         # cross-cutting methodology notes shared by experiments
├── web/          # the TraceLab web app (Astro UI + AI / contribute / local sidecars)
└── example_sessions/  # small public expanded trace examples with human explanations
Each experiment lives in artifacts/<category>/<experiment>/ with one analyze/plot
script, a README.md documenting its question and metric definitions, and (when run) its
generated outputs. Only scripts and README.md files are tracked — generated
*.png/*.csv/*.json outputs are gitignored.
trace_facts, llm_generation, tool_calls, prefix_cache,
human_in_the_loop, session, plus shared utils.human_in_the_loop, trace_facts.The end-to-end flow is four single-command stages: collect → sanitize → analyze → validate (see Quickstart Track B for the full run).
artifacts/run_all.py also derives the timing-fit CSV locally before timing analyses run,
so a normal full run needs no separate timing-preprocessing step.
# Extract a normalized combined Claude/Codex round trace from the launching user's home
uv run python scripts/collect_llm_traces.py --extract-rounds

# Scan every user home under /home instead
uv run python scripts/collect_llm_traces.py --all-user --extract-rounds

# Sudo-backed all-user collection that keeps outputs owned by the launching user
collection_id="20260724-100b"
scripts/collect_all_users_sudo.sh \
  --collection-id "$collection_id" \
  --fresh-extract
For a multi-host corpus refresh, write each host's fresh extraction into one shared collection ID,
such as 20260724-100b, under trace/collections/<collection_id>/. Then merge the historical private archive first and
the fresh host snapshots afterward with scripts/merge_round_traces.py. The newest copy of
(provider, session_id, round_id) wins, so rounds are re-normalized without losing history whose
original local session files have been deleted.
sanitize_round_trace.py rewrites session, round, turn, tool-call, process-session, project, and
user identifiers with stable pseudorandom replacements. Continuation-to-root relationships remain
joinable through the pseudonymous ids. It removes local context fields such as home, cwd,
workdir, session_file, and path-like keys, and drops tools[].input entirely while preserving
input_chars. Before dropping command inputs, it extracts an ordered executable list, parse
status/reason, and structural command skeleton. Explicitly reviewed public/common names remain
visible; all other executable names become stable custom_N labels within the sanitized trace.
Distinct-user counts remain available through pseudonymous user values.
collect_llm_traces.py — scan Claude/Codex local history, count sessions, optionally write normalized round traces.collect_all_users_sudo.sh — sudo-friendly wrapper for all-user extraction.merge_round_traces.py — union historical private traces by stable round identity; newer inputs win.extract_claude_rounds.py / extract_codex_rounds.py — convert provider JSONL sessions into normalized round rows.sanitize_round_trace.py — remove public-release-sensitive fields.find_representative_session_segments.py — find compact raw-session windows for examples.Every analysis is a self-contained experiment under artifacts/<category>/<experiment>/.
Read that folder's README.md for the question it answers and exactly how it computes its
metric; shared metric definitions live in
artifacts/utils/README.md. Most experiments accept the
released DuckDB at trace/syfi_coding_trace.duckdb; JSONL inputs are still supported for
scripts that expose -i / --input. Outputs are written into each experiment folder:
# Headline aggregate facts (text or --json)
uv run python artifacts/trace_facts/overview_summary/analyze.py \
  --db trace/syfi_coding_trace.duckdb
# Input-token composition; tool latency; generation-time CDFs
uv run python artifacts/llm_generation/prefix_append_distribution/plot.py \
  --db trace/syfi_coding_trace.duckdb
uv run python artifacts/tool_calls/tool_latency_distribution/plot.py \
  --db trace/syfi_coding_trace.duckdb
uv run python artifacts/llm_generation/generation_time_cdf/plot.py \
  --db trace/syfi_coding_trace.duckdb
# Multi-round CSV export
uv run python artifacts/trace_facts/csv_export/convert.py \
  --db trace/syfi_coding_trace.duckdb \
  -o artifacts/trace_facts/csv_export/coding_trace.csv
Each figure driver owns its plotting/CSV payload and imports shared primitives from the
artifacts/utils/ modules (trace_loader, style, accumulators, formatters,
tool_stats, cdf). Common loader options: --group-by, --sample-size,
--per-tool-sample-size, --min-tool-calls-for-plot, --seed.
As the final step of each plotting experiment, every PNG embeds its README, the source CSV data, and the plotting code as compressed PNG text chunks (CSVs are still written normally). Inspect or unpack any figure with the helper:
uv run python artifacts/utils/png_sidecar.py list    <figure>.png
uv run python artifacts/utils/png_sidecar.py extract <figure>.png -o "$TMPDIR/unpacked"
The timing-fit family owns its derived timing-segment CSV locally. artifacts/run_all.py
builds artifacts/llm_generation/timing_fit/timing_fit_trace.csv from the selected DuckDB
trace before running timing analyses. Use --timing-input only when you intentionally want
to consume an existing external timing CSV instead of deriving one from --db. To build
the local timing CSV directly:
uv run python artifacts/llm_generation/timing_fit/collect_timing_fit_trace.py \
  --db trace/syfi_coding_trace.duckdb
Validators are integrity checks and denominator/formula audits. They write Markdown/CSV
reports next to the validator, under validators/, and are intentionally kept out of the
plotting artifact tree.
uv run python validators/run_all.py
uv run python validators/run_all.py --list
uv run python validators/run_all.py --only human_in_the_loop
uv run python validators/run_all.py --only trace_facts/tool_duplicate_audit
uv run python validators/run_all.py --db trace/syfi_coding_trace.duckdb
Explore traces without writing any code at tracelab.cs.washington.edu:
The whole stack runs locally. From the repo root:
./launch.sh                 # frontend + local sidecar; auto-analyzes your ~/.claude + ~/.codex
./launch.sh --master-server # full stack: AI backend + contribute backend + site
The dev workflow (ports, individual services, status checks) is documented in
web/README.md. Ports and the LLM backend live in
config/services.json.
Each extracted JSONL row is one LLM invocation, keeping token-accounting fields, an ordered timing list, and nested tool metadata.
timing_events, and trace_key.timing_events[] is the ordered trace-observed event list for the round. It may include
user_message, tool_result, reasoning, text, tool_call, and Codex
usage_report entries.input; sanitized public traces remove
tools[].input and keep only input_chars.tools[] includes tool_name, tool_call_id, emitted_at, input_chars,
result_chars, tool_wall_latency_ms, tool_internal_latency_ms, is_error, and
result_at. Codex exec_command / write_stdin results may additionally carry
command_status and command_exit_code; write_stdin carries
continuation_of_tool_call_id when it can be linked to the initial exec_command. Sanitized
command-launch calls also carry executables, executable_parse_status,
executable_parse_reason, and command_skeleton. Full tool
outputs are not stored — content is summarized by result_chars.input_tokens_total = prefix_tokens + newly_append_tokens
claude_cache_creation_input_tokens is emitted after newly_append_tokens. For Claude
rows it is copied from usage.cache_creation_input_tokens; for Codex rows it is null.
newly_append_tokens still includes both Claude uncached input_tokens and Claude
cache-write tokens.
See docs/prompt_cache_accounting.md for the full
prompt-cache accounting derivation.
Tool latency is split into two fields:
tool_wall_latency_ms — trace-observed wall latency, computed as result_at - emitted_at.tool_internal_latency_ms — tool/runner-reported duration when available (Codex wrapper
Wall time or Claude durationMs / durationSeconds); otherwise null.
Analyses use tool_internal_latency_ms when present, then fall back to
tool_wall_latency_ms. The CSV exporter uses tool_wall_latency_ms for
tool_wait_after_ms by default.Codex command lifecycle values are derived, not stored. The shared
artifacts/utils/command_chains.py utility links continuations and computes both elapsed wall time
through the first finished result and summed per-call tool time. Those quantities are not equal:
the per-call sum excludes gaps between polls and may overlap when calls run in parallel.
For LLM-side latency, use timing_events[] rather than a first/last timestamp pair. The
usual proxy for "input ready → next tool input" is the latest user_message or
tool_result event before the first tool_call, subtracted from that tool_call
timestamp.
The single-source-of-truth metric definitions (effective tool latency, observable
generation time, human input wait, user-turn response time, prefix hit ratio, adjusted
append, KV active ratio, growth buckets) are collected in
artifacts/utils/README.md.
Contributions are welcome — whether it's a new analysis experiment, a validator, a fix, or
a donated sanitized trace. A good experiment is self-contained: one script, a
README.md stating the question and metric, and outputs that regenerate from the public
trace. By submitting a contribution you agree to license it under the project's
Apache 2.0 (code) / CC BY 4.0 (data) terms.
If you use TraceLab — the dataset, the toolkit, or the figures — please cite:
@misc{zhu2026tracelabcharacterizingcodingagent,
      title={TraceLab: Characterizing Coding Agent Workloads for LLM Serving},
      author={Kan Zhu and Mathew Jacob and Chenxi Ma and Yi Pan and Stephanie Wang and Arvind Krishnamurthy and Baris Kasikci},
      year={2026},
      eprint={2606.30560},
      archivePrefix={arXiv},
      primaryClass={cs.LG},
      url={https://arxiv.org/abs/2606.30560},
}
45 followers · starred Jun 2026
1,052 followers · starred Jul 2026
55 followers · starred Aug 2026
480 followers · starred Jul 2026
An open toolkit and public dataset hub for collecting, sanitizing, analyzing, and visualizing coding agent traces.
See the codeA real-world Claude / Codex trace & open toolkit for coding-agent workload analysis.
Collect · sanitize · analyze · visualize the LLM-invocation traces that coding agents actually produce in the wild — then explore them in your browser.
🌐 Live demo · Quickstart · Dataset · Experiments · Web app · Data format
Coding agents like Claude Code and Codex quietly emit a rich event log every time they run: each LLM invocation, every tool call, the prompt-cache splits, and the timing in between. TraceLab turns those scattered local session files into a clean, sanitized, analyzable dataset — and ships the tooling to reproduce every figure, plus a web app to explore traces (yours or ours) without writing any code.
collect → sanitize → analyze → validate, each stage a single command.
Install dependencies with uv:
uv sync
Download the pinned release assets, then run any experiment against them:
mkdir -p trace
curl -L --fail -o trace/syfi_coding_trace.duckdb \
  https://github.com/uw-syfi/TraceLab/releases/latest/download/syfi_coding_trace.duckdb

# Headline aggregate facts (add --json for machine-readable output)
uv run python artifacts/trace_facts/overview_summary/analyze.py \
  --db trace/syfi_coding_trace.duckdb

# Regenerate all analysis artifacts from the released DuckDB
uv run python artifacts/run_all.py
See The dataset for the full download + checksum recipe.
Turn your local Claude/Codex history into a shareable, sanitized trace and regenerate every figure:
collection_id="20260724-100b"
collection_directory="trace/collections/${collection_id}"

# 1. Collect a private normalized trace (existing history is retained)
uv run python scripts/collect_llm_traces.py \
  --extract-rounds "${collection_directory}/merged.private.jsonl"

# 2. Sanitize it (pseudonymize ids, strip local paths & tool inputs)
uv run python scripts/sanitize_round_trace.py \
  "${collection_directory}/merged.private.jsonl" \
  -o "${collection_directory}/merged.public.jsonl"

# 3. Materialize the sanitized trace once
uv run python artifacts/utils/trace_db.py \
  "${collection_directory}/merged.public.jsonl" \
  "${collection_directory}/merged.public.duckdb"

# 4. Regenerate every analysis from DuckDB
uv run python artifacts/run_all.py \
  --db "${collection_directory}/merged.public.duckdb"

# 5. Run validator analyses from the same DuckDB
uv run python validators/run_all.py --db "${collection_directory}/merged.public.duckdb"
Prefer a UI? Drag a trace export into the web app and get the same analytics in your browser — nothing leaves your machine.
The sanitized all-user trace and a prebuilt DuckDB database are distributed as GitHub Release assets (not committed to Git history).
|
Assets
SHA256
|
mkdir -p trace
curl -L --fail \
  -o trace/syfi_coding_trace.jsonl.gz \
  https://github.com/uw-syfi/TraceLab/releases/download/v0.0.1/syfi_coding_trace.jsonl.gz
curl -L --fail \
  -o trace/syfi_coding_trace.duckdb \
  https://github.com/uw-syfi/TraceLab/releases/download/v0.0.1/syfi_coding_trace.duckdb

echo "9d265eae69a31cae203848bea936f018148eed7ca8bf56050c5abe96da0b4e6b  trace/syfi_coding_trace.jsonl.gz" | sha256sum -c -
echo "97715265367cc72376475f5d444c8e1900b88cab1482aa7b9a742894d9f15619  trace/syfi_coding_trace.duckdb"   | sha256sum -c -
gzip -t trace/syfi_coding_trace.jsonl.gz
Always fetch the newest published assets with the latest redirect:
curl -L --fail -o trace/syfi_coding_trace.jsonl.gz \
  https://github.com/uw-syfi/TraceLab/releases/latest/download/syfi_coding_trace.jsonl.gz
curl -L --fail -o trace/syfi_coding_trace.duckdb \
  https://github.com/uw-syfi/TraceLab/releases/latest/download/syfi_coding_trace.duckdb
Use DuckDB for analysis. If another tool specifically requires JSONL, decompress into $TMPDIR
instead of creating a loose file at the trace/ root:
uv run python artifacts/trace_facts/overview_summary/analyze.py \
  --db trace/syfi_coding_trace.duckdb
gzip -cd trace/syfi_coding_trace.jsonl.gz > "$TMPDIR/syfi_coding_trace.jsonl"
🔒 The dataset is licensed under CC BY 4.0 and is fully sanitized — ids are pseudonymized and local context (paths,
cwd, tool inputs) is stripped before release. Please use it responsibly and don't attempt re-identification.
TraceLab/
├── scripts/      # data pipeline — collection, extraction, sanitizing
├── artifacts/    # analysis & plotting experiments, by category, + shared utils/
├── validators/   # integrity / denominator / formula audits (kept out of the plot tree)
├── trace/        # generated normalized JSONL traces (gitignored outputs)
├── docs/         # cross-cutting methodology notes shared by experiments
├── web/          # the TraceLab web app (Astro UI + AI / contribute / local sidecars)
└── example_sessions/  # small public expanded trace examples with human explanations
Each experiment lives in artifacts/<category>/<experiment>/ with one analyze/plot
script, a README.md documenting its question and metric definitions, and (when run) its
generated outputs. Only scripts and README.md files are tracked — generated
*.png/*.csv/*.json outputs are gitignored.
trace_facts, llm_generation, tool_calls, prefix_cache,
human_in_the_loop, session, plus shared utils.human_in_the_loop, trace_facts.The end-to-end flow is four single-command stages: collect → sanitize → analyze → validate (see Quickstart Track B for the full run).
artifacts/run_all.py also derives the timing-fit CSV locally before timing analyses run,
so a normal full run needs no separate timing-preprocessing step.
# Extract a normalized combined Claude/Codex round trace from the launching user's home
uv run python scripts/collect_llm_traces.py --extract-rounds

# Scan every user home under /home instead
uv run python scripts/collect_llm_traces.py --all-user --extract-rounds

# Sudo-backed all-user collection that keeps outputs owned by the launching user
collection_id="20260724-100b"
scripts/collect_all_users_sudo.sh \
  --collection-id "$collection_id" \
  --fresh-extract
For a multi-host corpus refresh, write each host's fresh extraction into one shared collection ID,
such as 20260724-100b, under trace/collections/<collection_id>/. Then merge the historical private archive first and
the fresh host snapshots afterward with scripts/merge_round_traces.py. The newest copy of
(provider, session_id, round_id) wins, so rounds are re-normalized without losing history whose
original local session files have been deleted.
sanitize_round_trace.py rewrites session, round, turn, tool-call, process-session, project, and
user identifiers with stable pseudorandom replacements. Continuation-to-root relationships remain
joinable through the pseudonymous ids. It removes local context fields such as home, cwd,
workdir, session_file, and path-like keys, and drops tools[].input entirely while preserving
input_chars. Before dropping command inputs, it extracts an ordered executable list, parse
status/reason, and structural command skeleton. Explicitly reviewed public/common names remain
visible; all other executable names become stable custom_N labels within the sanitized trace.
Distinct-user counts remain available through pseudonymous user values.
collect_llm_traces.py — scan Claude/Codex local history, count sessions, optionally write normalized round traces.collect_all_users_sudo.sh — sudo-friendly wrapper for all-user extraction.merge_round_traces.py — union historical private traces by stable round identity; newer inputs win.extract_claude_rounds.py / extract_codex_rounds.py — convert provider JSONL sessions into normalized round rows.sanitize_round_trace.py — remove public-release-sensitive fields.find_representative_session_segments.py — find compact raw-session windows for examples.Every analysis is a self-contained experiment under artifacts/<category>/<experiment>/.
Read that folder's README.md for the question it answers and exactly how it computes its
metric; shared metric definitions live in
artifacts/utils/README.md. Most experiments accept the
released DuckDB at trace/syfi_coding_trace.duckdb; JSONL inputs are still supported for
scripts that expose -i / --input. Outputs are written into each experiment folder:
# Headline aggregate facts (text or --json)
uv run python artifacts/trace_facts/overview_summary/analyze.py \
  --db trace/syfi_coding_trace.duckdb
# Input-token composition; tool latency; generation-time CDFs
uv run python artifacts/llm_generation/prefix_append_distribution/plot.py \
  --db trace/syfi_coding_trace.duckdb
uv run python artifacts/tool_calls/tool_latency_distribution/plot.py \
  --db trace/syfi_coding_trace.duckdb
uv run python artifacts/llm_generation/generation_time_cdf/plot.py \
  --db trace/syfi_coding_trace.duckdb
# Multi-round CSV export
uv run python artifacts/trace_facts/csv_export/convert.py \
  --db trace/syfi_coding_trace.duckdb \
  -o artifacts/trace_facts/csv_export/coding_trace.csv
Each figure driver owns its plotting/CSV payload and imports shared primitives from the
artifacts/utils/ modules (trace_loader, style, accumulators, formatters,
tool_stats, cdf). Common loader options: --group-by, --sample-size,
--per-tool-sample-size, --min-tool-calls-for-plot, --seed.
As the final step of each plotting experiment, every PNG embeds its README, the source CSV data, and the plotting code as compressed PNG text chunks (CSVs are still written normally). Inspect or unpack any figure with the helper:
uv run python artifacts/utils/png_sidecar.py list    <figure>.png
uv run python artifacts/utils/png_sidecar.py extract <figure>.png -o "$TMPDIR/unpacked"
The timing-fit family owns its derived timing-segment CSV locally. artifacts/run_all.py
builds artifacts/llm_generation/timing_fit/timing_fit_trace.csv from the selected DuckDB
trace before running timing analyses. Use --timing-input only when you intentionally want
to consume an existing external timing CSV instead of deriving one from --db. To build
the local timing CSV directly:
uv run python artifacts/llm_generation/timing_fit/collect_timing_fit_trace.py \
  --db trace/syfi_coding_trace.duckdb
Validators are integrity checks and denominator/formula audits. They write Markdown/CSV
reports next to the validator, under validators/, and are intentionally kept out of the
plotting artifact tree.
uv run python validators/run_all.py
uv run python validators/run_all.py --list
uv run python validators/run_all.py --only human_in_the_loop
uv run python validators/run_all.py --only trace_facts/tool_duplicate_audit
uv run python validators/run_all.py --db trace/syfi_coding_trace.duckdb
Explore traces without writing any code at tracelab.cs.washington.edu:
The whole stack runs locally. From the repo root:
./launch.sh                 # frontend + local sidecar; auto-analyzes your ~/.claude + ~/.codex
./launch.sh --master-server # full stack: AI backend + contribute backend + site
The dev workflow (ports, individual services, status checks) is documented in
web/README.md. Ports and the LLM backend live in
config/services.json.
Each extracted JSONL row is one LLM invocation, keeping token-accounting fields, an ordered timing list, and nested tool metadata.
timing_events, and trace_key.timing_events[] is the ordered trace-observed event list for the round. It may include
user_message, tool_result, reasoning, text, tool_call, and Codex
usage_report entries.input; sanitized public traces remove
tools[].input and keep only input_chars.tools[] includes tool_name, tool_call_id, emitted_at, input_chars,
result_chars, tool_wall_latency_ms, tool_internal_latency_ms, is_error, and
result_at. Codex exec_command / write_stdin results may additionally carry
command_status and command_exit_code; write_stdin carries
continuation_of_tool_call_id when it can be linked to the initial exec_command. Sanitized
command-launch calls also carry executables, executable_parse_status,
executable_parse_reason, and command_skeleton. Full tool
outputs are not stored — content is summarized by result_chars.input_tokens_total = prefix_tokens + newly_append_tokens
claude_cache_creation_input_tokens is emitted after newly_append_tokens. For Claude
rows it is copied from usage.cache_creation_input_tokens; for Codex rows it is null.
newly_append_tokens still includes both Claude uncached input_tokens and Claude
cache-write tokens.
See docs/prompt_cache_accounting.md for the full
prompt-cache accounting derivation.
Tool latency is split into two fields:
tool_wall_latency_ms — trace-observed wall latency, computed as result_at - emitted_at.tool_internal_latency_ms — tool/runner-reported duration when available (Codex wrapper
Wall time or Claude durationMs / durationSeconds); otherwise null.
Analyses use tool_internal_latency_ms when present, then fall back to
tool_wall_latency_ms. The CSV exporter uses tool_wall_latency_ms for
tool_wait_after_ms by default.Codex command lifecycle values are derived, not stored. The shared
artifacts/utils/command_chains.py utility links continuations and computes both elapsed wall time
through the first finished result and summed per-call tool time. Those quantities are not equal:
the per-call sum excludes gaps between polls and may overlap when calls run in parallel.
For LLM-side latency, use timing_events[] rather than a first/last timestamp pair. The
usual proxy for "input ready → next tool input" is the latest user_message or
tool_result event before the first tool_call, subtracted from that tool_call
timestamp.
The single-source-of-truth metric definitions (effective tool latency, observable
generation time, human input wait, user-turn response time, prefix hit ratio, adjusted
append, KV active ratio, growth buckets) are collected in
artifacts/utils/README.md.
Contributions are welcome — whether it's a new analysis experiment, a validator, a fix, or
a donated sanitized trace. A good experiment is self-contained: one script, a
README.md stating the question and metric, and outputs that regenerate from the public
trace. By submitting a contribution you agree to license it under the project's
Apache 2.0 (code) / CC BY 4.0 (data) terms.
If you use TraceLab — the dataset, the toolkit, or the figures — please cite:
@misc{zhu2026tracelabcharacterizingcodingagent,
      title={TraceLab: Characterizing Coding Agent Workloads for LLM Serving},
      author={Kan Zhu and Mathew Jacob and Chenxi Ma and Yi Pan and Stephanie Wang and Arvind Krishnamurthy and Baris Kasikci},
      year={2026},
      eprint={2606.30560},
      archivePrefix={arXiv},
      primaryClass={cs.LG},
      url={https://arxiv.org/abs/2606.30560},
}
45 followers · starred Jun 2026
1,052 followers · starred Jul 2026
55 followers · starred Aug 2026
480 followers · starred Jul 2026