🦥 Easy and simple Prometheus SLO (service level objectives) generator
See the code





Sloth is actively maintained and in continuous development.
We’re currently working on internal improvements to make Sloth even more extensible and adaptable to real-world use cases. While Sloth already supports custom SLI plugins, upcoming changes will bring more flexibility to how SLOs are generated, making it easier to adapt Sloth to your custom needs. Stay tuned for updates!
Meet the easiest way to generate SLOs for Prometheus.
Sloth generates understandable, uniform and reliable Prometheus SLOs for any kind of service. Using a simple SLO spec that results in multiple metrics and multi window multi burn alerts.
validate command for Gitops and CI).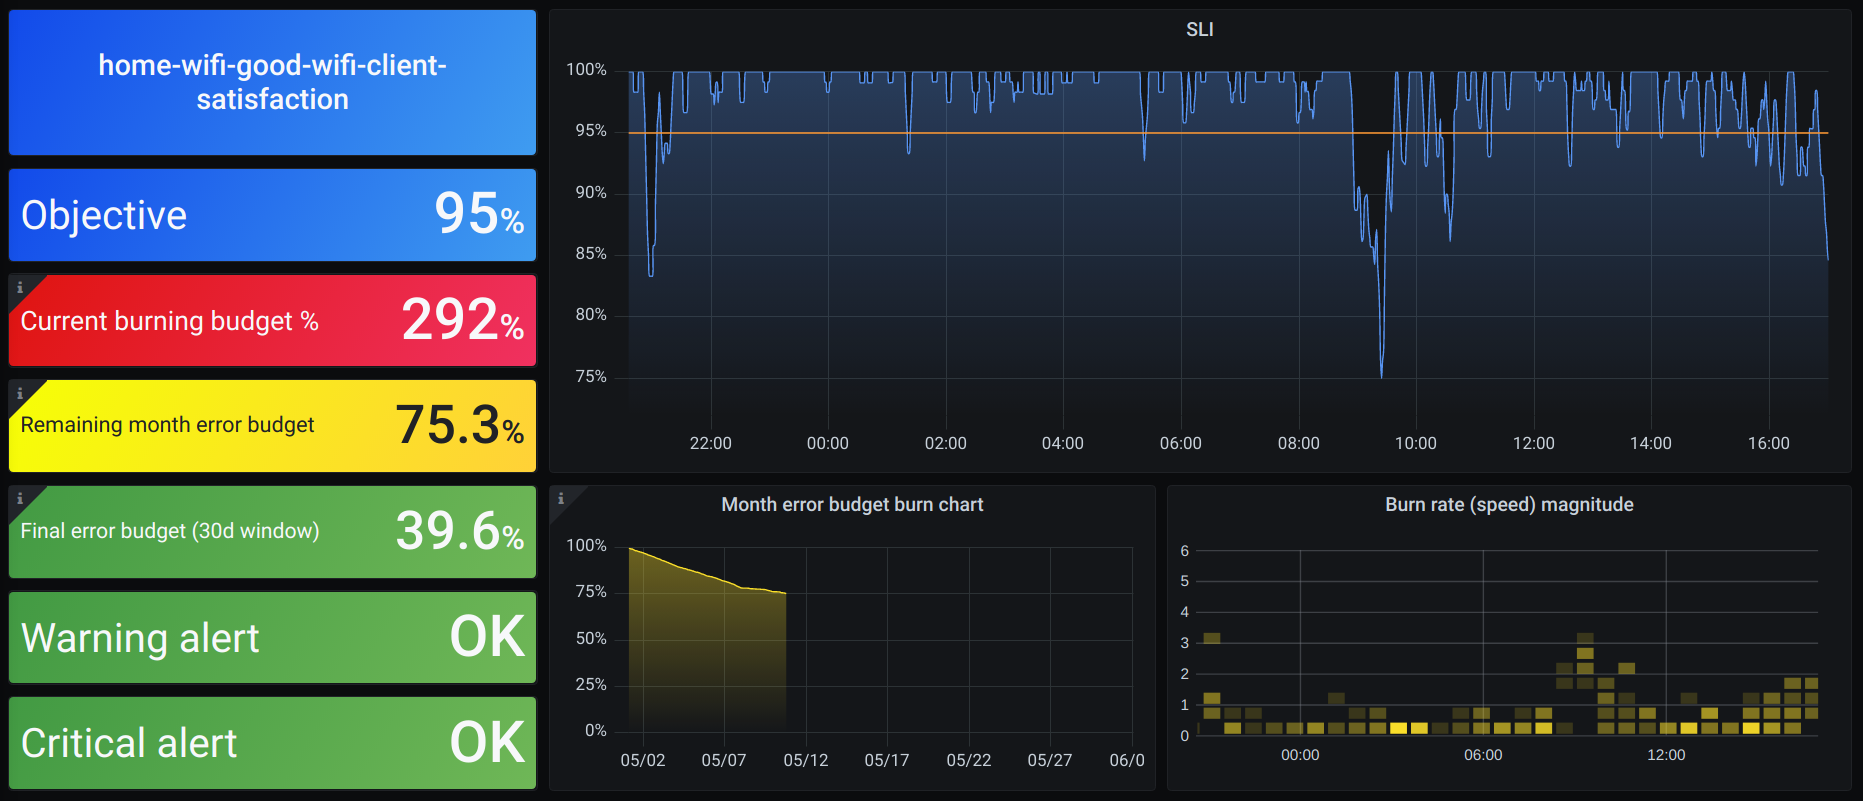
Release the Sloth!
sloth generate -i ./examples/getting-started.yml
version: "prometheus/v1"
service: "myservice"
labels:
  owner: "myteam"
  repo: "myorg/myservice"
  tier: "2"
slos:
  # We allow failing (5xx and 429) 1 request every 1000 requests (99.9%).
  - name: "requests-availability"
    objective: 99.9
    description: "Common SLO based on availability for HTTP request responses."
    labels:
      category: availability
    sli:
      events:
        error_query: sum(rate(http_request_duration_seconds_count{job="myservice",code=~"(5..|429)"}[{{.window}}]))
        total_query: sum(rate(http_request_duration_seconds_count{job="myservice"}[{{.window}}]))
    alerting:
      name: "MyServiceHighErrorRate"
      labels:
        category: "availability"
      annotations:
        # Overwrite default Sloth SLO alert summmary on ticket and page alerts.
        summary: "High error rate on 'myservice' requests responses"
      page_alert:
        labels:
          severity: "pageteam"
          routing_key: "myteam"
      ticket_alert:
        labels:
          severity: "slack"
          slack_channel: "#alerts-myteam"
This would be the result you would obtain from the above spec example.
Check the docs to know more about the usage, examples, and other handy features!
Looking for common SLI plugins? Check this repository, if you are looking for the sli plugins docs, check this instead.
Check CONTRIBUTING.md.
Overall
Maintained
Code review
Go module
Latest release
Releases this year
(top 24 of 52)
374 followers · starred Oct 2024
243 followers · starred Sep 2022
515 followers · starred Nov 2022
118 followers · starred Aug 2024
🦥 Easy and simple Prometheus SLO (service level objectives) generator
See the code
Sloth is actively maintained and in continuous development.
We’re currently working on internal improvements to make Sloth even more extensible and adaptable to real-world use cases. While Sloth already supports custom SLI plugins, upcoming changes will bring more flexibility to how SLOs are generated, making it easier to adapt Sloth to your custom needs. Stay tuned for updates!
Meet the easiest way to generate SLOs for Prometheus.
Sloth generates understandable, uniform and reliable Prometheus SLOs for any kind of service. Using a simple SLO spec that results in multiple metrics and multi window multi burn alerts.
validate command for Gitops and CI).
Release the Sloth!
sloth generate -i ./examples/getting-started.yml
version: "prometheus/v1"
service: "myservice"
labels:
  owner: "myteam"
  repo: "myorg/myservice"
  tier: "2"
slos:
  # We allow failing (5xx and 429) 1 request every 1000 requests (99.9%).
  - name: "requests-availability"
    objective: 99.9
    description: "Common SLO based on availability for HTTP request responses."
    labels:
      category: availability
    sli:
      events:
        error_query: sum(rate(http_request_duration_seconds_count{job="myservice",code=~"(5..|429)"}[{{.window}}]))
        total_query: sum(rate(http_request_duration_seconds_count{job="myservice"}[{{.window}}]))
    alerting:
      name: "MyServiceHighErrorRate"
      labels:
        category: "availability"
      annotations:
        # Overwrite default Sloth SLO alert summmary on ticket and page alerts.
        summary: "High error rate on 'myservice' requests responses"
      page_alert:
        labels:
          severity: "pageteam"
          routing_key: "myteam"
      ticket_alert:
        labels:
          severity: "slack"
          slack_channel: "#alerts-myteam"
This would be the result you would obtain from the above spec example.
Check the docs to know more about the usage, examples, and other handy features!
Looking for common SLI plugins? Check this repository, if you are looking for the sli plugins docs, check this instead.
Check CONTRIBUTING.md.
Overall
Maintained
Code review
Go module
Latest release
Releases this year
(top 24 of 52)
374 followers · starred Oct 2024
243 followers · starred Sep 2022
515 followers · starred Nov 2022
118 followers · starred Aug 2024