Do frozen image encoders transfer to SAR? Glacier calving fronts on CaFFe with frozen DINOv3 (satellite and photo), C-RADIO, TerraMind and SARATR-X and small heads, against a U-Net from scratch; pixel size vs radar band; frozen-feature views.
Jupyter Notebook
0
4 commits
updated Oct 5, 2026
Do frozen encoders pretrained on optical satellite images transfer to SAR images? And does that hold across radar bands?
The test case is glacier calving-front delineation on the CaFFe benchmark. The pretrained encoders stay frozen. We train only small probes and heads on top of them. A U-Net trained from scratch is the reference.
Next to the satellite-pretrained DINOv3 (SAT-493M) we test encoders pretrained on ordinary photos (DINOv3 LVD-1689M and C-RADIOv4-H) and two SAR-pretrained encoders (TerraMind S1, SARATR-X). In most comparisons the photo-pretrained encoders score as well as or better than the satellite one, but not in all (see Results).
Full tables, methods, per-sensor and per-seed numbers and the long caveats are in docs/results.md.
A follow-up that applies the same frozen pipeline to other SAR domains (glacial lakes, snow, forests, alpine glaciers) is in preparation.
per_tile normalisation, SI), a line through the two C-band points (12 m and
20 m) predicted the L-band score within 0.0005. Redone with each model's final SI run, it still roughly
holds for C-RADIO (0.006 off) and less well for the photo DINOv3 (0.021 off). The satellite DINOv3, both SAR
encoders and the U-Net score 0.08–0.24 below their own line on L-band (7
PALSAR images). TEST cannot separate band, resolution and glacier.| head | C-RADIOv4-H, SI | C-RADIOv4-H, TEST | DINOv3 SAT, SI | DINOv3 SAT, TEST |
|---|---|---|---|---|
| 1 linear probe on the 16 px grid | 1,791 (6) | 2,115 (38) | 1,853 (2) | 2,660 (42) |
| 2 AnyUp + linear probe | 1,534 (5) | 1,915 (21) | 1,849 (0) | 2,083 (36) |
| 3 decoder, 3 seeds | 1,244 ± 56 (0) | 979 ± 31 (7–9) | 1,329 ± 25 (0) | 1,171 ± 292 (2–11) |
| 4 AnyUp at full resolution + light head | 1,445 (0) | 1,316 (17) | 1,402 (0) | 1,226 (7) |
| 5 decoder on 4 layers | 1,345 (0) | 1,005 (2) | 1,465 (0) | 1,249 (7) |
| 6 AnyUp to 1/4 + decoder | 1,375 (0) | 1,225 (12) | 1,384 (0) | 1,076 (1) |
| U-Net from scratch, one run | 1,732 (0) | 979 (3) |
| model | 3-class patch mIoU | paper-style IoU | MDE (m) | no front / 122 |
|---|---|---|---|---|
| U-Net from scratch | 0.594 | 0.677 | 979 | 3 |
| DINOv3 photo (LVD-1689M) | 0.610 | 0.613 | 2,199 | 48 |
| C-RADIOv4-H | 0.602 | 0.636 | 2,089 | 37 |
| DINOv3 SAT (SAT-493M) | 0.586 | 0.595 | 2,805 | 60 |
| TerraMind 1.0 base, S1 | 0.385 | 0.389 | 2,414 | 55 |
| SARATR-X v1 | 0.363 | 0.438 | 2,796 | 70 |
| published CaFFe baseline | 0.79 | 753 (COL 840, Mapple 150) | 1 ± 1 |
The U-Net column uses two separate U-Nets: a 3-class one for the patch mIoU and a 4-class one for the paper-style IoU and the fronts.
Taken from the papers, not re-run. MDE on all 122 TEST images.
| model | zone IoU, 4 classes incl. NA | MDE (m) | no front / 122 | source |
|---|---|---|---|---|
| CaFFe baseline | 0.79 ± 0.02 | 753 ± 76 (COL 840 ± 84, Mapple 150 ± 24) | 1 ± 1 | CaFFe paper, Table 5 (IoU, per glacier); AMD-HookNet paper, Table III (all images) |
| AMD-HookNet | 0.744 ± 0.010 | 438 ± 22 | 0 ± 1 | AMD-HookNet paper, Table III; IoU from AMD-HookNet++, Table III |
| HookFormer (TGRS 2024) | 0.755 ± 0.003 | 353 ± 16 | 0 | AMD-HookNet++ paper, Table III |
| AMD-HookNet++ | 0.782 ± 0.004 | 367 ± 30 | 0 | AMD-HookNet++ paper, Table III |
Related work: Cryo-Bench (Hugging Face dataset Sk-21/Cryo-Bench, checked
2026-09-27) also runs frozen geospatial foundation models (among them Prithvi,
TerraMind, DOFA and CROMA) with a UPerNet decoder on CaFFe, and references the
PANGAEA benchmark (Marsocci et al.). Its paper was in review when checked, so its
numbers are not compared here. Its encoders differ from ours (no DINOv3, no
C-RADIO).
Two TEST images, never seen in training. Each GIF steps through the radar image, the true zones and front, the predictions of the U-Net, the C-RADIO probe, the C-RADIO decoder and the satellite DINOv3 decoder, and all fronts together.
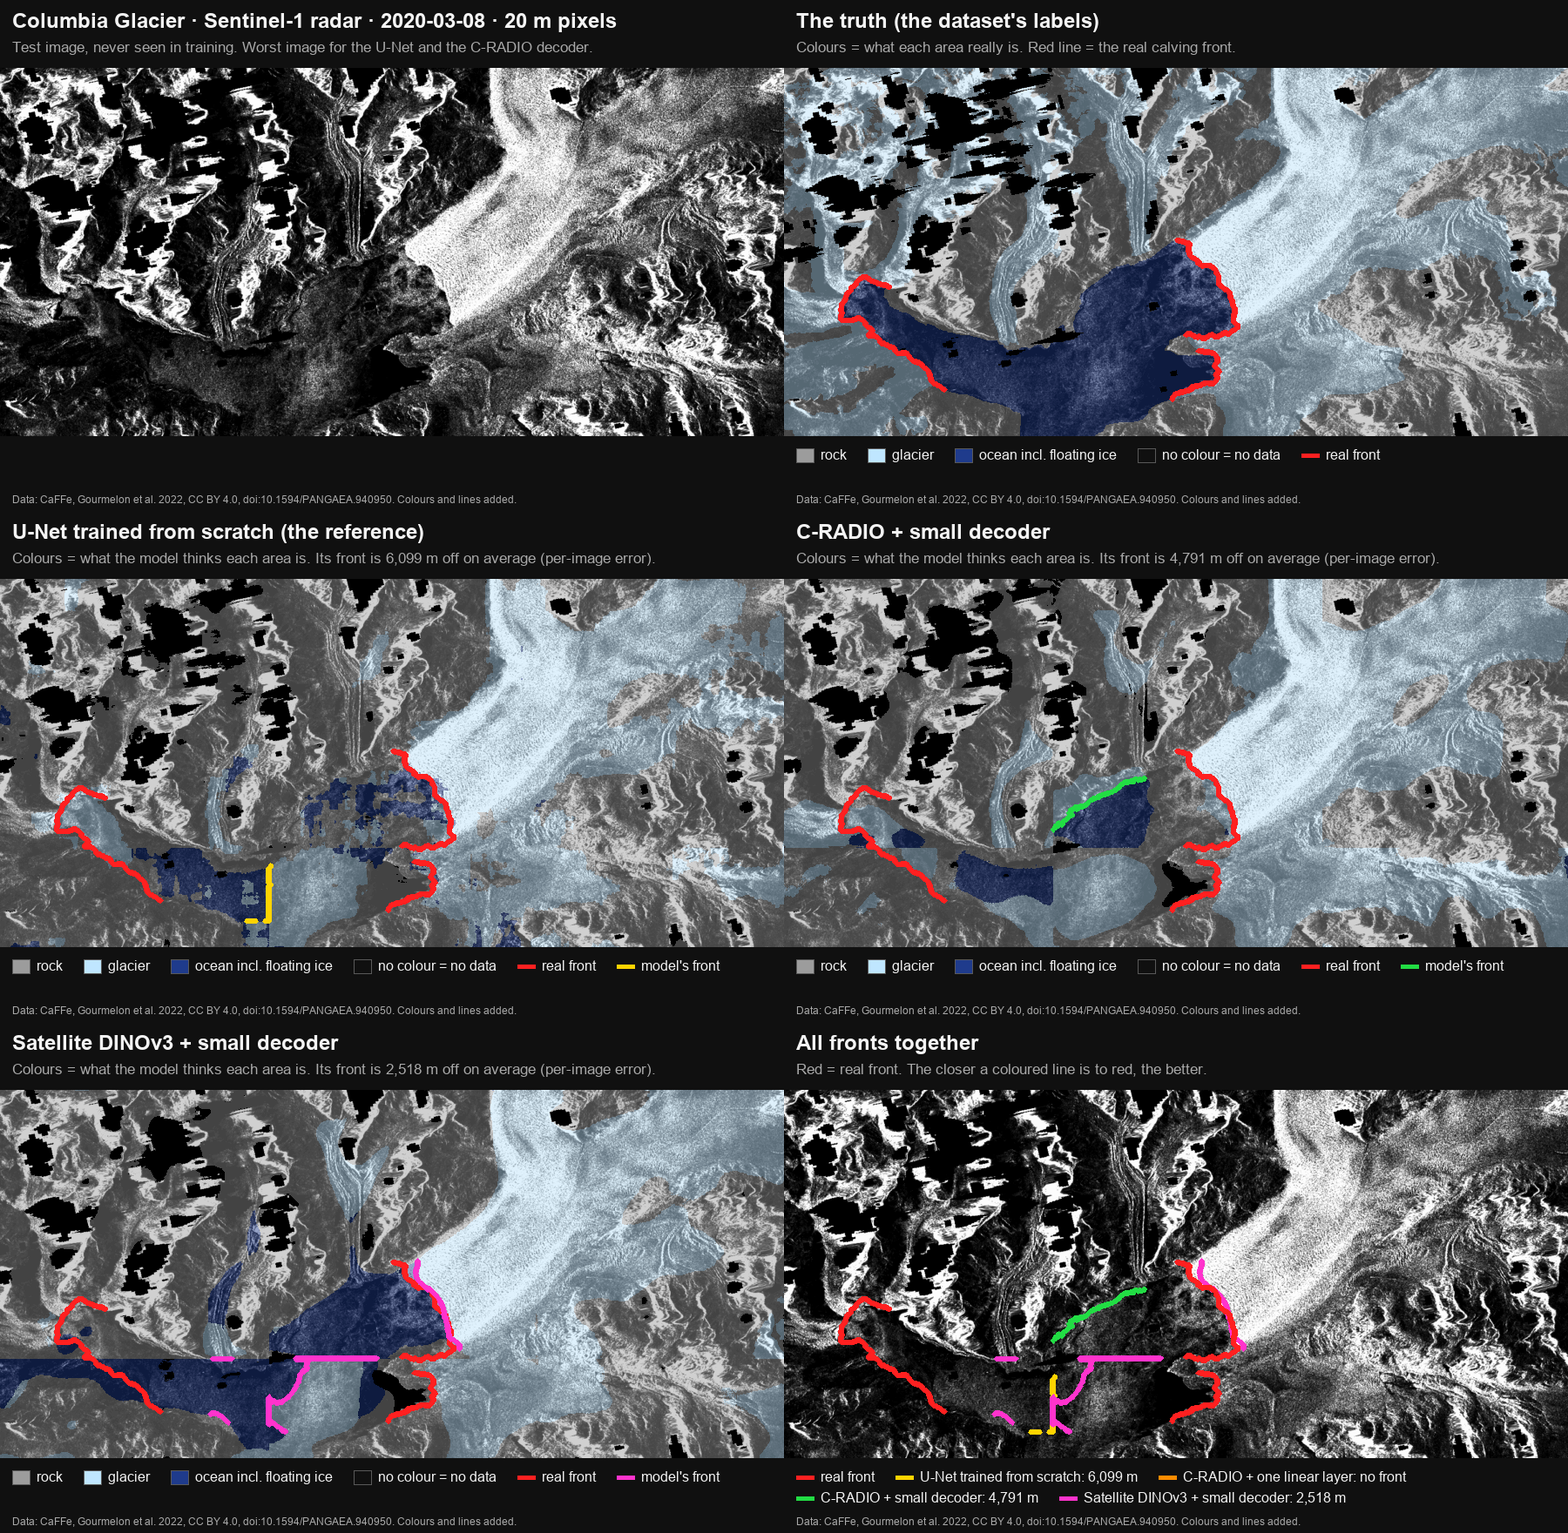
Hard case: Columbia Glacier, Sentinel-1, 2020-03-08, one of the 18 images of the next section.
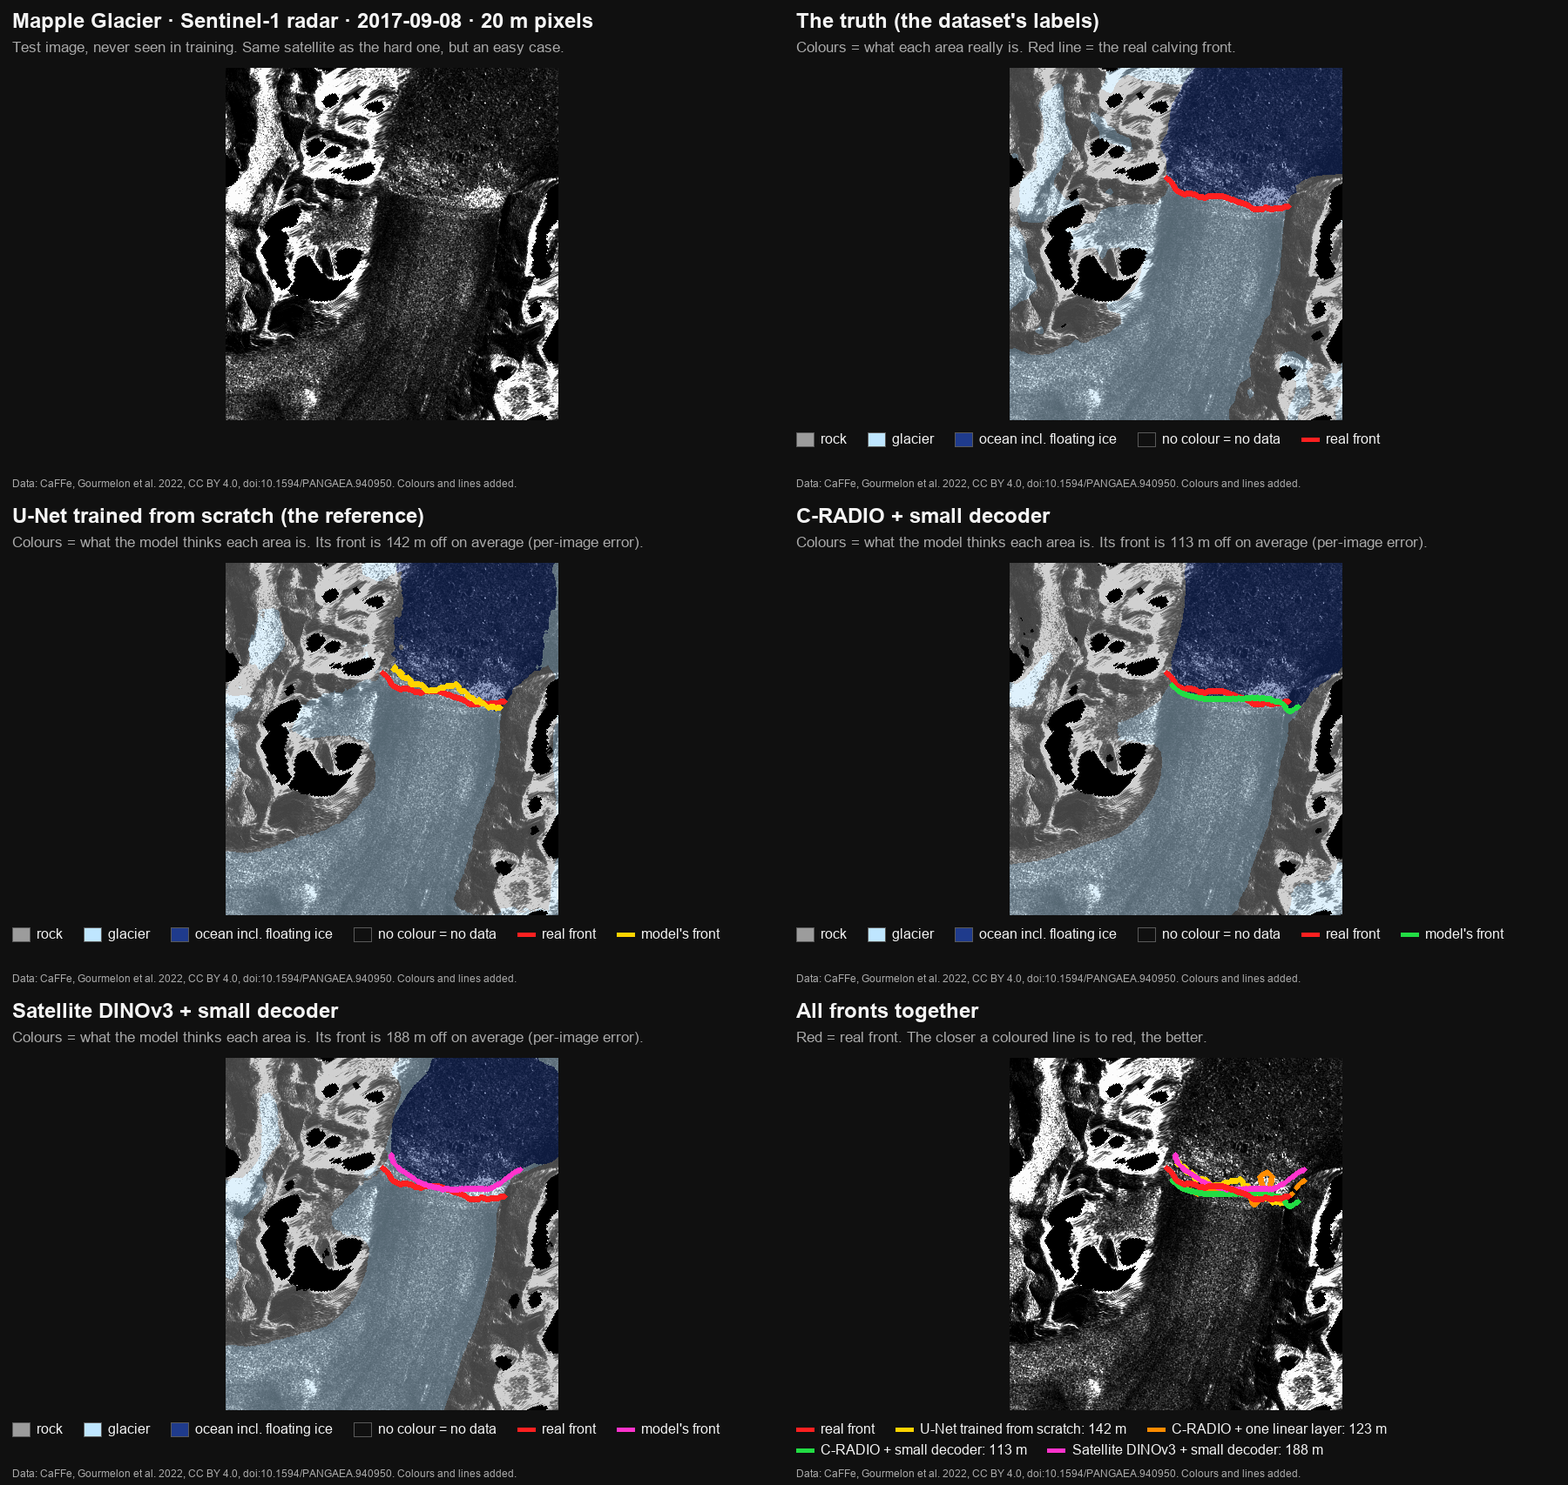
Easy case: Mapple Glacier, Sentinel-1, 2017-09-08.
Radar images and labels: CaFFe (Gourmelon et al. 2022), CC BY 4.0, https://doi.org/10.1594/PANGAEA.940950. Colours and lines added.
Notebook 10 collects the 243 scored SI and TEST images with every run's
per-image results, notebook 11 redraws the saved TEST predictions of these four
models (identical to the saved results on 122 of 122 images each),
notebooks 12 and 13 are the pixel-size checks below, and notebook 14 looks at
the frozen features of these two images without training (below).
scripts/view_results.py opens the results in the FiftyOne viewer on your own
PC (nothing is uploaded), and scripts/make_gifs.py makes the GIFs from the
same files.
Added after every TEST run, from the saved per-image results (notebook 11). It describes the test set after the fact and changes no choice. Every model, the U-Net included, does far worse on the 18 Sentinel-1 images of Columbia (15 % of the 122 TEST images) than on the rest. Over all 22 saved TEST runs these images hold 7–14 % of the pooled front distances but 15–38 % of the summed error.
| TEST MDE (m) | all 122 images | without the 18 | the 18 only |
|---|---|---|---|
| U-Net, 4-class | 979 | 730 | 3,447 |
| C-RADIO decoder, seeds 0 / 1 / 2 | 945 / 1,003 / 990 | 671 / 735 / 732 | 2,914 / 2,808 / 2,816 |
| satellite DINOv3 decoder, seeds 0 / 1 / 2 | 1,021 / 1,508 / 985 | 809 / 1,270 / 773 | 2,447 / 3,294 / 2,339 |
| C-RADIO probe (arm 1) | 2,089 | 1,809 | 4,808 |
The key result holds with and without these images: the C-RADIO decoder matches the U-Net and does not beat it. Shares of the error and no-front counts per run are in docs/results.md.
Exploratory, SI only, after every TEST run; the rules were written down before any number (notebooks 12 and 13). In CaFFe each band comes with its own pixel sizes, so we shrank SI images to coarser pixels and ran the saved models on them, unchanged. On the original images every head first reproduced its saved SI result exactly. The U-Net's saved SI file cannot be reproduced bit for bit, so all its numbers here were rerun on one path.
| SI pooled MDE (m) | X@7 | X@20, shrunk | C@20, real | r | C 12 m → 20 m, shrunk |
|---|---|---|---|---|---|
| C-RADIO probe | 1,821 | 2,497 | 2,060 | 2.83 | 1,446 → 1,771 |
| C-RADIO decoder, seeds 0 / 1 / 2 | 1,158 / 1,092 / 1,233 | 1,710 / 1,289 / 1,373 | 1,497 / 1,302 / 1,409 | 1.63 / 0.94 / 0.79 | 1,309 → 1,523; 1,330 → 1,385; 1,153 → 1,223 |
| satellite DINOv3 probe | 1,901 | 5,367 (5 no front) | 1,893 | – | 1,514 → 1,870 |
| satellite DINOv3 decoder, seeds 0 / 1 / 2 | 1,247 / 1,313 / 1,282 | 2,138 / 1,875 / 1,842 | 1,422 / 1,386 / 1,495 | 5.08 / – / 2.63 | 1,069 → 1,377; 1,168 → 1,525; 1,125 → 1,430 |
| U-Net, 4-class, all rerun | 1,864 | 2,450 (1 no front) | 1,223 | −0.91 | 1,741 → 1,755 |
Full tables, the per-band table and all caveats are in docs/results.md.
Descriptive, after every TEST run: it looks at the two TEST images of the GIFs above, trains nothing and changes no result. Notebook 14 shows the frozen features directly, with no probe or decoder, raw and after AnyUp at 1/4 resolution. The AUC says how well the distance to the image's ocean and glacier centres tells ocean from glacier patches (1 = fully apart, 0.5 = not at all); the shares are the classes of the 100 patches most similar to the ocean patch next to the front.
| Columbia, Sentinel-1 (hard) | AUC ocean vs glacier, raw / AnyUp 1/4 | ocean query, top 100: ocean / glacier |
|---|---|---|
| C-RADIO | 0.935 / 0.947 | 0.86 / 0.04 |
| satellite DINOv3 | 0.872 / 0.922 | 0.77 / 0.09 |
| photo DINOv3 | 0.737 / 0.738 | 0.66 / 0.09 |
Mapple (easy), same order: AUC raw 0.999 / 0.990 / 0.975, AnyUp 1/4 0.999 / 0.999 / 0.977.
Every encoder separates ocean from glacier much worse on the Columbia image than on Mapple. Looking at Columbia's Sentinel-1 images, whose large errors are described in Where the test error comes from, had led to a hypothesis: ice mélange in front of the glacier that looks like glacier to the encoders. Notebook 14 does not support it at the tested spot: the ocean patch next to the front looks like ocean to every encoder. Caveats: descriptive, one image per glacier and one query patch per class; the centres come from each image's own labels, so the AUCs are optimistic. Details in docs/results.md.
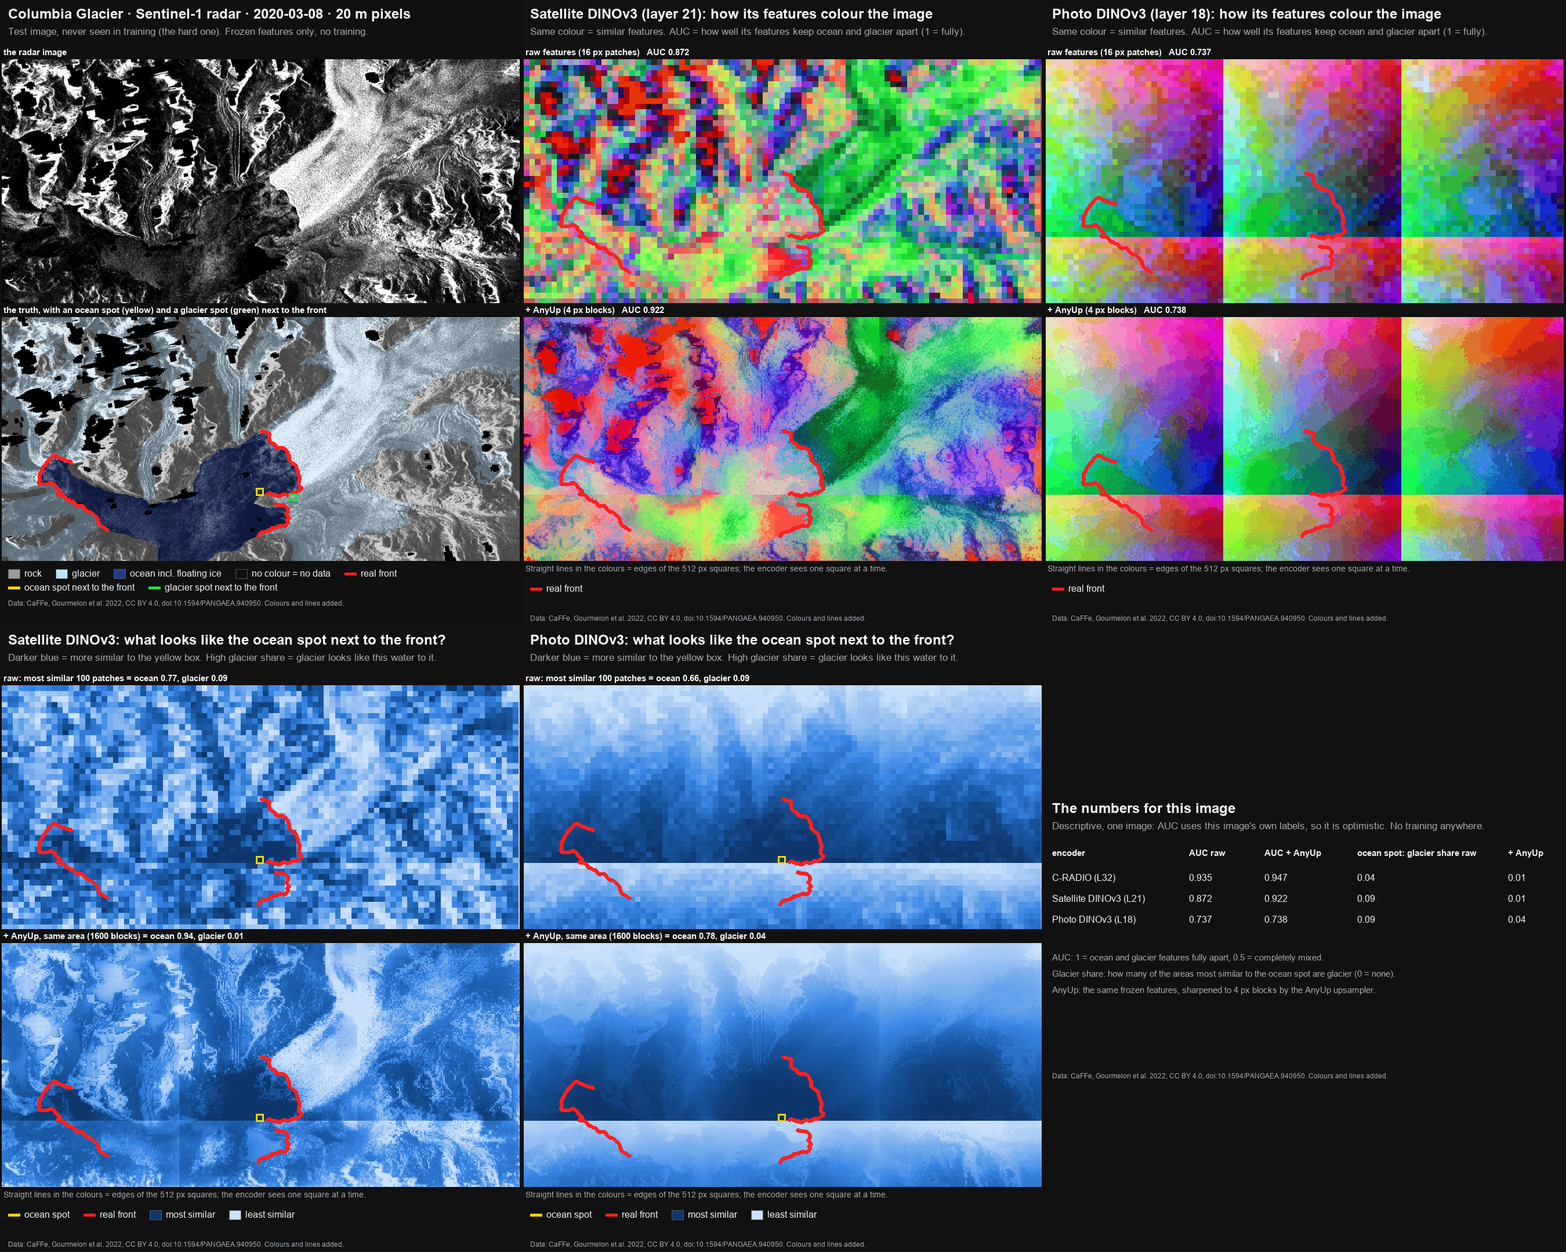
Hard case: Columbia Glacier, Sentinel-1, 2020-03-08. The GIF steps through the radar image and the truth with the two query spots, then per encoder the feature colours and what looks like the ocean spot (raw, then AnyUp 1/4), a zoom at the front and the numbers.
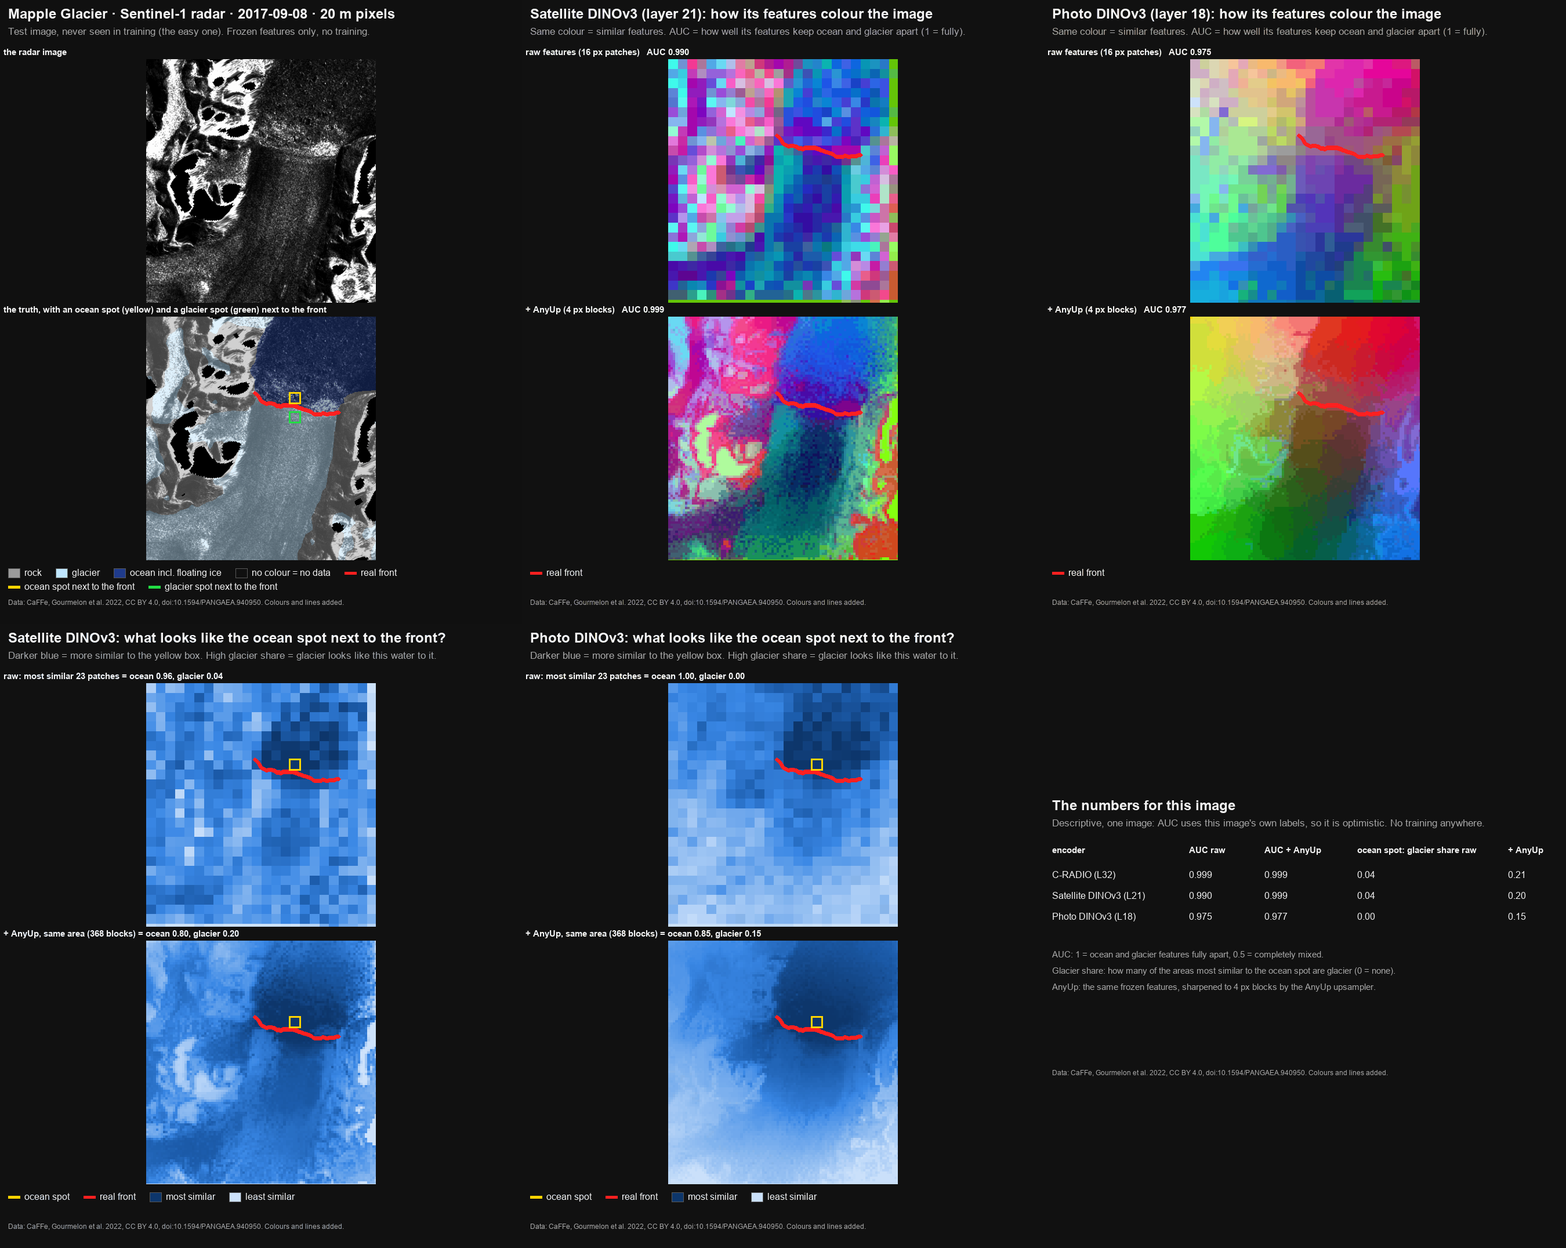
Easy case: Mapple Glacier, Sentinel-1, 2017-09-08.
Radar images and labels: CaFFe (Gourmelon et al. 2022), CC BY 4.0,
https://doi.org/10.1594/PANGAEA.940950. Colours and lines added.
scripts/make_embedding_gifs.py makes these two GIFs from the files notebook
14 saves on Drive.
notebooks/09_conditioning.ipynb, band and resolution conditioning of the
row-3 decoder). It is exploratory and SI only; results in
docs/results.md.681 SAR images, 8-bit, single channel, from 7 glaciers, at 6–20 m ground resolution, taken 1995–2020 by seven SAR missions. Zone labels: NA, rock, glacier, ocean with ice mélange. Front labels are 1 px lines. Licence CC BY 4.0.
| split | glaciers (images) | images |
|---|---|---|
| train | Crane 69, DBE 133, JAC 159, Jorum 77 | 438 |
| validation | SI 121 | 121 |
| TEST | COL 65, Mapple 57 | 122 |
| band | sensors | all images | SI | TEST |
|---|---|---|---|---|
| X | TerraSAR-X, TanDEM-X | 395 | 32 | 69 |
| C | ENVISAT, ERS-1/2, RADARSAT-1, Sentinel-1 | 238 | 82 | 45 |
| L | ALOS PALSAR | 48 | 7 | 8 |
| key | model | pretraining data | parameters |
|---|---|---|---|
cradio-v4-h | nvidia/C-RADIOv4-H, revision 0057b339059c | photos; agglomerative, distilled from several teachers: SigLIP2-g, DINOv3-7B, SAM3 (model card: NV-CC-Img-Text-Dataset, 700 M images) | 651.6 M as loaded |
dinov3-l-sat | facebook/dinov3-vitl16-pretrain-sat493m | SAT-493M: 493 M Maxar RGB images at 0.6 m (model card) | 303.1 M as loaded |
dinov3-l-photo | facebook/dinov3-vitl16-pretrain-lvd1689m | LVD-1689M: 1,689 M curated web images (model card) | 303.1 M in the weight file |
terramind-v1-base-s1 | ibm-esa-geospatial/TerraMind-1.0-base via terratorch | TerraMesh: 9 M aligned samples of 264×264 px at 10 m, 500 B tokens; Sentinel-1 GRD or RTC, Sentinel-2, DEM, land cover, NDVI, coordinates, captions (model card and paper) | 465.0 M is the file count of the whole multimodal checkpoint; the S1 encoder was not counted; the model card and paper state no count |
saratrx-v1 | waterdisappear/SARATR-X, checkpoint-800.pth | SARDet-180K (paper): 186,600 unlabelled SAR target chips from 14 public datasets; vehicles, ships, aircraft and other targets such as oil tanks and bridges; satellite, airborne and simulated; about 0.1–25 m per dataset | 65.8 M as run (our own HiViT port) |
caffe normalisation (the official CaFFe statistics); SARATR-X gets
unit (pixel / 255), what it saw in pretraining. For the zone probes,
per_image z-scoring changed the score by less than 0.01, except TerraMind
(0.013). TerraMind expects VV and VH in dB; we copy the single CaFFe channel
into both.Trainable parameters. For rows 4 and 6 this is the count that gets gradients (the counts printed at run time are in docs/results.md).
| row | head | DINOv3, 1024-d | C-RADIOv4-H, 1280-d |
|---|---|---|---|
| 1 | linear probe on the 16 px grid, logits upsampled bilinearly | 4,100 | 5,124 |
| 2 | AnyUp → per-pixel features → linear probe | 4,100 | 5,124 |
| 3 | GridDecoder: 1×1 reduction, four ×2 upsampling stages, image skip at 5 scales | 544,388 | 568,964 |
| 4 | PixelHead: 1×1 reduction → AnyUp at full resolution → image map → 2 convs | 114,452 | 130,836 |
| 5 | row 3 on 4 concatenated layers (DINOv3 6+12+18+24, C-RADIO 8+16+24+32) | 839,300 | 937,604 |
| 6 | AnyUpDecoder: AnyUp to 1/4 resolution → the last 3 stages of row 3 | 239,652 | 264,228 |
Layers were chosen on SI by a zone proxy: C-RADIO layer 32, satellite DINOv3 layer 21, photo DINOv3 layer 18.
Rows 3–6 train for 4,000 steps with AdamW (learning rate 1e-3, weight decay 1e-4), a OneCycle schedule, batch 8 (row 4: 4), class-balanced cross-entropy and horizontal flips, on at most 4,000 training tiles (row 5: 2,000). No checkpoint was picked on SI. The linear probes, the U-Net (48,000 iterations, one run) and the exact metric definitions are in docs/results.md. In short: patch mIoU and 4-class pixel mIoU pool one confusion matrix over the split, paper-style IoU is averaged per image, and MDE pools the distances over all images, as the official code does.
nvidia/Cosmos-Reason2-8B was asked whether a calving front advanced or
retreated between two SAR images of the same glacier (56 pairs, half advances).
The two direct setups answered "retreat" for all 56. The two reasoning setups
gave a few "advance" answers (advance recall 0.11 and 0.14) and did no better
than chance. No evidence that it can judge calving-front change in SAR; the arm
was closed at 8B (details).
The code of this closed arm is not part of this repository.
The notebooks are written for VS Code with the Google Colab extension: open a notebook locally, connect it to a Colab runtime, and the cells run there. The runtime cannot see your local disk, so the code travels inside one notebook cell, the sync cell. Nothing is cloned on the runtime.
python sync.py            # pack src/sartransfer/**/*.py and pyproject.toml into every notebook
python sync.py --check    # list stale notebooks, exit 1 if any (an empty sync cell counts as stale)
python sync.py --clear    # empty the sync cells again, before committing
python sync.py in its
folder. No install is needed for this step.HF_TOKEN, get access to
three gated models. Accept the DINOv3 licence on both
facebook/dinov3-vitl16-pretrain-lvd1689m and
facebook/dinov3-vitl16-pretrain-sat493m. Access is granted per model and
approved by hand, which can take time. Accept the contact-info gate on
waterdisappear/SARATR-X. C-RADIOv4-H and TerraMind are not gated. Without
access, the download fails with error 403 and the notebooks print FAILED
for that model.
Copy .env.example to .env, fill in HF_TOKEN (a read token is
enough), and put the file where src/sartransfer/env.py looks for it (SEARCH_PATHS).
Without it, the code asks for the token with getpass.Colab: Mount Google Drive to Server…) and run notebooks 00
to 09 in order, on the runtime given in the table. Notebooks 10 to 14 are
optional. 10 to 13 use what 00 to 09 saved on Drive; 14 needs only the
CaFFe zip and the model weights, which it downloads if missing.The published notebooks have empty sync cells. An empty cell stops the
notebook with a message that says to run python sync.py, so it cannot run
old code. Run python sync.py after every code edit. Commit notebooks with
empty sync cells: the code belongs in src/ once. sync.py prints a source
fingerprint locally, and the sync cell prints it again on the runtime; if the
two differ, the runtime is running old code.
Use an A100 with High-RAM. On SI, the row-5 extraction printed "RAM used 67 of 179 GB" (satellite DINOv3) and 80 of 179 GB (C-RADIO). Earlier runs, on a runtime whose RAM was not printed, stopped three times without a Python error; memory was suspected but not confirmed.
| notebook | runtime | time recorded (A100) | what it does |
|---|---|---|---|
00_setup – 02_tiling | CPU | not recorded | runtime and secrets check; download and measure CaFFe; tiling check |
03_encoders | GPU | 43 min for the first loop | zone probe per encoder and normalisation, on SI |
04_compare | any | not recorded | compares encoders per band, sensor and resolution |
05_unet | GPU | 19.9 min (A100-40GB) | 3-class U-Net from scratch |
06_fronts | GPU, High-RAM | 22 min for the four encoders | 4-class U-Net and probe fronts on SI |
07_test | GPU, High-RAM | encoders 25 min, U-Nets about 5 min, satellite DINOv3 probe 6.5 min | arm 1 on TEST (run once) |
08_heads | GPU, High-RAM | layer sweep 13–14 min per encoder; heads on SI 51–110 min per run, about 4.8 h in total; heads on TEST about 1.5 h | arm 2: layer sweep, heads on SI, heads on TEST (run once), precision check |
09_conditioning | GPU, High-RAM | 43 min (satellite DINOv3), 49 min (C-RADIO) | approach A, exploratory, SI only |
10_fiftyone | CPU | not recorded | FiftyOne dataset of the per-image results, zipped to Drive for scripts/view_results.py |
11_predictions | GPU | redraw about 5 min; RAM used 12 of 179 GB | share of the TEST error from COL Sentinel-1; copy-back speed check; redraws four models' TEST predictions |
12_resolution | GPU, A100 only | 9.6 min | pixel size, SI only: X-band 7 m → 20 m |
13_bands | GPU, A100 only | part 2: 5.7 min | every band from the saved results; pixel size within C-band, SI only: 12 m → 20 m |
14_embeddings | GPU, A100, standard RAM | 7.2 min | frozen features of the two GIF images, no training: embedding maps, similarity search, ocean-vs-glacier AUC, raw and AnyUp |
The times come from the reported runs. Head training in 08 and 09 was sped up afterwards (identical weights in a CPU test); the new times were not measured. Per-step times are in docs/results.md.
What the notebooks keep on Google Drive:
MyDrive/sar-transfer/
  .env                              secrets, never in git
  raw/data_raw.zip                  CaFFe zip, downloaded once
  results/                          result CSVs, saved heads (heads__*.pt), U-Net weights
  weights/anyup_multi_backbone.pth  AnyUp weights, downloaded if missing
  hf_cache/                         Hugging Face model cache
  fiftyone/                         sar-transfer-results.zip, FiftyOne dataset (notebook 10)
  predictions/                      sar-transfer-predictions.zip, redrawn TEST predictions (notebook 11)
  resolution_test/                  restest_*.csv, pixel-size and band tables (notebooks 12-13)
  embeddings/                       figures, embeddings_numbers.csv, embeddings_gif_<stem>.npz (notebook 14)
The encoder output is now cast to float16 on the GPU before it is copied to the CPU. On an A100 (notebook 11, 298 tiles per encoder) the copy-back fell from 9.3 to 1.2 ms per tile for C-RADIO (layer 32; forward 10.4 ms) and from 7.8 to 1.2 ms for the satellite DINOv3 (layer 21; forward 7.8 ms). The encoder pass is 41–42 % faster, and the features are bit-identical, so no reported number changes. The reported runs, and their recorded times, used the old path.
The reported numbers come from the saved heads and the result CSVs on Drive. Neither is in git. After the reported runs the code was fixed:
legacy_tile_sampler=True recovers the
reported tile set.load_head_state loads the old heads. In an offline CPU test, heads trained
by the old code gave byte-identical test CSVs with the new code. The reported
heads themselves were not re-scored, and CUDA was not tested..env
line-break check; the remote-code check covers subfolders; U-Net log loss of
a short last window; conditioning verdict with one seed; one prediction pass
for the 3-class U-Net test; head training reuses its training data across
heads; one class-weight function; two leftovers removed.heads.summary_table takes the zones4 "all" row from the first
grouping, as the run code does (the "all" rows are equal in every grouping).Retraining gives different heads, even with legacy_tile_sampler=True,
because the initial weights are now seeded. Recorded software: Python 3.13.15,
torch 2.11.0+cu128. The versions of transformers, timm, terratorch and the
other libraries were not recorded; runtime pip installs are unpinned.
torch.load in src/ uses
weights_only=True; the DINOv3 and C-RADIO weights are safetensors; the
pickled checkpoints were scanned without running them.0057b339059c0b9e1b4ba996f975410ebbfdfcc8, and its 26 Python files are
SHA-256-checked against a reviewed copy before loading. C-RADIO runs made
before the pin was added ran unpinned remote code.weights_only rule, the C-RADIO pin and hash table, the .env parser,
the empty sync cells and a secret scan are tested in CI on every push and
pull request (.github/workflows/ci.yml), together with ruff and compileall.| component | licence | use here |
|---|---|---|
| this repository | MIT, see LICENSE (Copyright (c) 2026 Abhishek Singh) | everything except src/sartransfer/models/anyup/ |
src/sartransfer/models/anyup/ | CC BY 4.0, third-party code (LICENSE and NOTICE.md in the folder) | vendored AnyUp inference code |
| AnyUp weights | no separate licence is stated by the source; the AnyUp repository's only licence is CC BY 4.0 | downloaded at run time |
| CaFFe dataset | CC BY 4.0 | downloaded at run time |
| CaFFe official code | CC BY 4.0 | not copied; fronts.py and tiling.py reimplement its evaluation route and use its normalisation constants |
| DINOv3 ViT-L/16, LVD-1689M and SAT-493M | DINOv3 License (Meta), gated with manual approval | downloaded at run time; publications must acknowledge the use of DINOv3 |
| C-RADIOv4-H weights | NVIDIA Open Model License Agreement (the June 2024 version linked from the model card); not gated | downloaded at run time |
| C-RADIOv4-H remote code | 20 of its 26 Python files carry an NVIDIA proprietary notice, 2 an Apache-2.0 notice | not in this repository; only SHA-256 values are stored |
| TerraMind 1.0 base | Apache-2.0 (model card metadata) | downloaded at run time |
| terratorch | Apache-2.0 up to release 1.2.7; "Apache-2.0 AND MIT" from 1.2.8 (May 2026), with MIT for four dataset files. The installed version was not recorded | installed at run time |
| SARATR-X v1 | CC BY-NC 4.0, non-commercial, on both the Hugging Face model card and the GitHub repository; gated | downloaded at run time |
| Cosmos-Reason2-8B | NVIDIA Open Model License; the model card adds "Additional Information: Apache License 2.0"; gated | closed arm; code not in this repository |
No weights or data are redistributed here. This work uses DINOv3 by Meta.
Data and benchmark:
Published CaFFe models:
Models and code used:
models/hivit.py is our own implementation.LICENSE MIT
.env.example template for the Hugging Face token (HF_TOKEN)
pyproject.toml package metadata and dependencies
sync.py packs src/ into every notebook (--check, --clear)
docs/results.md full tables, methods and caveats
notebooks/ 00_setup to 09_conditioning, run in order; 10-14 viewer,
predictions, pixel size, bands and frozen features
(see "Seeing the results")
scripts/ view_results.py (FiftyOne viewer on your PC), make_gifs.py,
make_embedding_gifs.py
docs/figures/ the four explained GIFs
src/sartransfer/
data/ CaFFe download and inventory, tiling and normalisation, patch targets
models/ frozen encoders, HiViT port, U-Net, decoder heads, AnyUp loader,
C-RADIO remote-code hashes
models/anyup/ vendored AnyUp inference code (CC BY 4.0, own LICENSE and NOTICE.md)
features.py probe.py runs.py baseline.py fronts.py arm 1
heads.py checks.py arm 2 heads, AnyUp precision check
conditioning.py approach A (exploratory, notebook 09)
viz.py predmaps.py FiftyOne dataset, redrawn test predictions (notebooks 10-11)
resolution.py pixel size vs radar band (notebooks 12-13)
embeddings.py frozen features without training (notebook 14)
env.py reads HF_TOKEN from .env
sync.py the sync code behind ./sync.py
All code outside src/sartransfer/models/anyup/ was written for this project, with
the help of an AI coding assistant (Claude Code).
fronts.py and data/tiling.py re-implement the official CaFFe evaluation
route and reuse its normalisation constants, so that the numbers stay
comparable with the published ones.
Do frozen image encoders transfer to SAR? Glacier calving fronts on CaFFe with frozen DINOv3 (satellite and photo), C-RADIO, TerraMind and SARATR-X and small heads, against a U-Net from scratch; pixel size vs radar band; frozen-feature views.
Jupyter Notebook
0
4 commits
updated Oct 5, 2026
Do frozen encoders pretrained on optical satellite images transfer to SAR images? And does that hold across radar bands?
The test case is glacier calving-front delineation on the CaFFe benchmark. The pretrained encoders stay frozen. We train only small probes and heads on top of them. A U-Net trained from scratch is the reference.
Next to the satellite-pretrained DINOv3 (SAT-493M) we test encoders pretrained on ordinary photos (DINOv3 LVD-1689M and C-RADIOv4-H) and two SAR-pretrained encoders (TerraMind S1, SARATR-X). In most comparisons the photo-pretrained encoders score as well as or better than the satellite one, but not in all (see Results).
Full tables, methods, per-sensor and per-seed numbers and the long caveats are in docs/results.md.
A follow-up that applies the same frozen pipeline to other SAR domains (glacial lakes, snow, forests, alpine glaciers) is in preparation.
per_tile normalisation, SI), a line through the two C-band points (12 m and
20 m) predicted the L-band score within 0.0005. Redone with each model's final SI run, it still roughly
holds for C-RADIO (0.006 off) and less well for the photo DINOv3 (0.021 off). The satellite DINOv3, both SAR
encoders and the U-Net score 0.08–0.24 below their own line on L-band (7
PALSAR images). TEST cannot separate band, resolution and glacier.| head | C-RADIOv4-H, SI | C-RADIOv4-H, TEST | DINOv3 SAT, SI | DINOv3 SAT, TEST |
|---|---|---|---|---|
| 1 linear probe on the 16 px grid | 1,791 (6) | 2,115 (38) | 1,853 (2) | 2,660 (42) |
| 2 AnyUp + linear probe | 1,534 (5) | 1,915 (21) | 1,849 (0) | 2,083 (36) |
| 3 decoder, 3 seeds | 1,244 ± 56 (0) | 979 ± 31 (7–9) | 1,329 ± 25 (0) | 1,171 ± 292 (2–11) |
| 4 AnyUp at full resolution + light head | 1,445 (0) | 1,316 (17) | 1,402 (0) | 1,226 (7) |
| 5 decoder on 4 layers | 1,345 (0) | 1,005 (2) | 1,465 (0) | 1,249 (7) |
| 6 AnyUp to 1/4 + decoder | 1,375 (0) | 1,225 (12) | 1,384 (0) | 1,076 (1) |
| U-Net from scratch, one run | 1,732 (0) | 979 (3) |
| model | 3-class patch mIoU | paper-style IoU | MDE (m) | no front / 122 |
|---|---|---|---|---|
| U-Net from scratch | 0.594 | 0.677 | 979 | 3 |
| DINOv3 photo (LVD-1689M) | 0.610 | 0.613 | 2,199 | 48 |
| C-RADIOv4-H | 0.602 | 0.636 | 2,089 | 37 |
| DINOv3 SAT (SAT-493M) | 0.586 | 0.595 | 2,805 | 60 |
| TerraMind 1.0 base, S1 | 0.385 | 0.389 | 2,414 | 55 |
| SARATR-X v1 | 0.363 | 0.438 | 2,796 | 70 |
| published CaFFe baseline | 0.79 | 753 (COL 840, Mapple 150) | 1 ± 1 |
The U-Net column uses two separate U-Nets: a 3-class one for the patch mIoU and a 4-class one for the paper-style IoU and the fronts.
Taken from the papers, not re-run. MDE on all 122 TEST images.
| model | zone IoU, 4 classes incl. NA | MDE (m) | no front / 122 | source |
|---|---|---|---|---|
| CaFFe baseline | 0.79 ± 0.02 | 753 ± 76 (COL 840 ± 84, Mapple 150 ± 24) | 1 ± 1 | CaFFe paper, Table 5 (IoU, per glacier); AMD-HookNet paper, Table III (all images) |
| AMD-HookNet | 0.744 ± 0.010 | 438 ± 22 | 0 ± 1 | AMD-HookNet paper, Table III; IoU from AMD-HookNet++, Table III |
| HookFormer (TGRS 2024) | 0.755 ± 0.003 | 353 ± 16 | 0 | AMD-HookNet++ paper, Table III |
| AMD-HookNet++ | 0.782 ± 0.004 | 367 ± 30 | 0 | AMD-HookNet++ paper, Table III |
Related work: Cryo-Bench (Hugging Face dataset Sk-21/Cryo-Bench, checked
2026-09-27) also runs frozen geospatial foundation models (among them Prithvi,
TerraMind, DOFA and CROMA) with a UPerNet decoder on CaFFe, and references the
PANGAEA benchmark (Marsocci et al.). Its paper was in review when checked, so its
numbers are not compared here. Its encoders differ from ours (no DINOv3, no
C-RADIO).
Two TEST images, never seen in training. Each GIF steps through the radar image, the true zones and front, the predictions of the U-Net, the C-RADIO probe, the C-RADIO decoder and the satellite DINOv3 decoder, and all fronts together.
Hard case: Columbia Glacier, Sentinel-1, 2020-03-08, one of the 18 images of the next section.
Easy case: Mapple Glacier, Sentinel-1, 2017-09-08.
Radar images and labels: CaFFe (Gourmelon et al. 2022), CC BY 4.0, https://doi.org/10.1594/PANGAEA.940950. Colours and lines added.
Notebook 10 collects the 243 scored SI and TEST images with every run's
per-image results, notebook 11 redraws the saved TEST predictions of these four
models (identical to the saved results on 122 of 122 images each),
notebooks 12 and 13 are the pixel-size checks below, and notebook 14 looks at
the frozen features of these two images without training (below).
scripts/view_results.py opens the results in the FiftyOne viewer on your own
PC (nothing is uploaded), and scripts/make_gifs.py makes the GIFs from the
same files.
Added after every TEST run, from the saved per-image results (notebook 11). It describes the test set after the fact and changes no choice. Every model, the U-Net included, does far worse on the 18 Sentinel-1 images of Columbia (15 % of the 122 TEST images) than on the rest. Over all 22 saved TEST runs these images hold 7–14 % of the pooled front distances but 15–38 % of the summed error.
| TEST MDE (m) | all 122 images | without the 18 | the 18 only |
|---|---|---|---|
| U-Net, 4-class | 979 | 730 | 3,447 |
| C-RADIO decoder, seeds 0 / 1 / 2 | 945 / 1,003 / 990 | 671 / 735 / 732 | 2,914 / 2,808 / 2,816 |
| satellite DINOv3 decoder, seeds 0 / 1 / 2 | 1,021 / 1,508 / 985 | 809 / 1,270 / 773 | 2,447 / 3,294 / 2,339 |
| C-RADIO probe (arm 1) | 2,089 | 1,809 | 4,808 |
The key result holds with and without these images: the C-RADIO decoder matches the U-Net and does not beat it. Shares of the error and no-front counts per run are in docs/results.md.
Exploratory, SI only, after every TEST run; the rules were written down before any number (notebooks 12 and 13). In CaFFe each band comes with its own pixel sizes, so we shrank SI images to coarser pixels and ran the saved models on them, unchanged. On the original images every head first reproduced its saved SI result exactly. The U-Net's saved SI file cannot be reproduced bit for bit, so all its numbers here were rerun on one path.
| SI pooled MDE (m) | X@7 | X@20, shrunk | C@20, real | r | C 12 m → 20 m, shrunk |
|---|---|---|---|---|---|
| C-RADIO probe | 1,821 | 2,497 | 2,060 | 2.83 | 1,446 → 1,771 |
| C-RADIO decoder, seeds 0 / 1 / 2 | 1,158 / 1,092 / 1,233 | 1,710 / 1,289 / 1,373 | 1,497 / 1,302 / 1,409 | 1.63 / 0.94 / 0.79 | 1,309 → 1,523; 1,330 → 1,385; 1,153 → 1,223 |
| satellite DINOv3 probe | 1,901 | 5,367 (5 no front) | 1,893 | – | 1,514 → 1,870 |
| satellite DINOv3 decoder, seeds 0 / 1 / 2 | 1,247 / 1,313 / 1,282 | 2,138 / 1,875 / 1,842 | 1,422 / 1,386 / 1,495 | 5.08 / – / 2.63 | 1,069 → 1,377; 1,168 → 1,525; 1,125 → 1,430 |
| U-Net, 4-class, all rerun | 1,864 | 2,450 (1 no front) | 1,223 | −0.91 | 1,741 → 1,755 |
Full tables, the per-band table and all caveats are in docs/results.md.
Descriptive, after every TEST run: it looks at the two TEST images of the GIFs above, trains nothing and changes no result. Notebook 14 shows the frozen features directly, with no probe or decoder, raw and after AnyUp at 1/4 resolution. The AUC says how well the distance to the image's ocean and glacier centres tells ocean from glacier patches (1 = fully apart, 0.5 = not at all); the shares are the classes of the 100 patches most similar to the ocean patch next to the front.
| Columbia, Sentinel-1 (hard) | AUC ocean vs glacier, raw / AnyUp 1/4 | ocean query, top 100: ocean / glacier |
|---|---|---|
| C-RADIO | 0.935 / 0.947 | 0.86 / 0.04 |
| satellite DINOv3 | 0.872 / 0.922 | 0.77 / 0.09 |
| photo DINOv3 | 0.737 / 0.738 | 0.66 / 0.09 |
Mapple (easy), same order: AUC raw 0.999 / 0.990 / 0.975, AnyUp 1/4 0.999 / 0.999 / 0.977.
Every encoder separates ocean from glacier much worse on the Columbia image than on Mapple. Looking at Columbia's Sentinel-1 images, whose large errors are described in Where the test error comes from, had led to a hypothesis: ice mélange in front of the glacier that looks like glacier to the encoders. Notebook 14 does not support it at the tested spot: the ocean patch next to the front looks like ocean to every encoder. Caveats: descriptive, one image per glacier and one query patch per class; the centres come from each image's own labels, so the AUCs are optimistic. Details in docs/results.md.
Hard case: Columbia Glacier, Sentinel-1, 2020-03-08. The GIF steps through the radar image and the truth with the two query spots, then per encoder the feature colours and what looks like the ocean spot (raw, then AnyUp 1/4), a zoom at the front and the numbers.
Easy case: Mapple Glacier, Sentinel-1, 2017-09-08.
Radar images and labels: CaFFe (Gourmelon et al. 2022), CC BY 4.0,
https://doi.org/10.1594/PANGAEA.940950. Colours and lines added.
scripts/make_embedding_gifs.py makes these two GIFs from the files notebook
14 saves on Drive.
notebooks/09_conditioning.ipynb, band and resolution conditioning of the
row-3 decoder). It is exploratory and SI only; results in
docs/results.md.681 SAR images, 8-bit, single channel, from 7 glaciers, at 6–20 m ground resolution, taken 1995–2020 by seven SAR missions. Zone labels: NA, rock, glacier, ocean with ice mélange. Front labels are 1 px lines. Licence CC BY 4.0.
| split | glaciers (images) | images |
|---|---|---|
| train | Crane 69, DBE 133, JAC 159, Jorum 77 | 438 |
| validation | SI 121 | 121 |
| TEST | COL 65, Mapple 57 | 122 |
| band | sensors | all images | SI | TEST |
|---|---|---|---|---|
| X | TerraSAR-X, TanDEM-X | 395 | 32 | 69 |
| C | ENVISAT, ERS-1/2, RADARSAT-1, Sentinel-1 | 238 | 82 | 45 |
| L | ALOS PALSAR | 48 | 7 | 8 |
| key | model | pretraining data | parameters |
|---|---|---|---|
cradio-v4-h | nvidia/C-RADIOv4-H, revision 0057b339059c | photos; agglomerative, distilled from several teachers: SigLIP2-g, DINOv3-7B, SAM3 (model card: NV-CC-Img-Text-Dataset, 700 M images) | 651.6 M as loaded |
dinov3-l-sat | facebook/dinov3-vitl16-pretrain-sat493m | SAT-493M: 493 M Maxar RGB images at 0.6 m (model card) | 303.1 M as loaded |
dinov3-l-photo | facebook/dinov3-vitl16-pretrain-lvd1689m | LVD-1689M: 1,689 M curated web images (model card) | 303.1 M in the weight file |
terramind-v1-base-s1 | ibm-esa-geospatial/TerraMind-1.0-base via terratorch | TerraMesh: 9 M aligned samples of 264×264 px at 10 m, 500 B tokens; Sentinel-1 GRD or RTC, Sentinel-2, DEM, land cover, NDVI, coordinates, captions (model card and paper) | 465.0 M is the file count of the whole multimodal checkpoint; the S1 encoder was not counted; the model card and paper state no count |
saratrx-v1 | waterdisappear/SARATR-X, checkpoint-800.pth | SARDet-180K (paper): 186,600 unlabelled SAR target chips from 14 public datasets; vehicles, ships, aircraft and other targets such as oil tanks and bridges; satellite, airborne and simulated; about 0.1–25 m per dataset | 65.8 M as run (our own HiViT port) |
caffe normalisation (the official CaFFe statistics); SARATR-X gets
unit (pixel / 255), what it saw in pretraining. For the zone probes,
per_image z-scoring changed the score by less than 0.01, except TerraMind
(0.013). TerraMind expects VV and VH in dB; we copy the single CaFFe channel
into both.Trainable parameters. For rows 4 and 6 this is the count that gets gradients (the counts printed at run time are in docs/results.md).
| row | head | DINOv3, 1024-d | C-RADIOv4-H, 1280-d |
|---|---|---|---|
| 1 | linear probe on the 16 px grid, logits upsampled bilinearly | 4,100 | 5,124 |
| 2 | AnyUp → per-pixel features → linear probe | 4,100 | 5,124 |
| 3 | GridDecoder: 1×1 reduction, four ×2 upsampling stages, image skip at 5 scales | 544,388 | 568,964 |
| 4 | PixelHead: 1×1 reduction → AnyUp at full resolution → image map → 2 convs | 114,452 | 130,836 |
| 5 | row 3 on 4 concatenated layers (DINOv3 6+12+18+24, C-RADIO 8+16+24+32) | 839,300 | 937,604 |
| 6 | AnyUpDecoder: AnyUp to 1/4 resolution → the last 3 stages of row 3 | 239,652 | 264,228 |
Layers were chosen on SI by a zone proxy: C-RADIO layer 32, satellite DINOv3 layer 21, photo DINOv3 layer 18.
Rows 3–6 train for 4,000 steps with AdamW (learning rate 1e-3, weight decay 1e-4), a OneCycle schedule, batch 8 (row 4: 4), class-balanced cross-entropy and horizontal flips, on at most 4,000 training tiles (row 5: 2,000). No checkpoint was picked on SI. The linear probes, the U-Net (48,000 iterations, one run) and the exact metric definitions are in docs/results.md. In short: patch mIoU and 4-class pixel mIoU pool one confusion matrix over the split, paper-style IoU is averaged per image, and MDE pools the distances over all images, as the official code does.
nvidia/Cosmos-Reason2-8B was asked whether a calving front advanced or
retreated between two SAR images of the same glacier (56 pairs, half advances).
The two direct setups answered "retreat" for all 56. The two reasoning setups
gave a few "advance" answers (advance recall 0.11 and 0.14) and did no better
than chance. No evidence that it can judge calving-front change in SAR; the arm
was closed at 8B (details).
The code of this closed arm is not part of this repository.
The notebooks are written for VS Code with the Google Colab extension: open a notebook locally, connect it to a Colab runtime, and the cells run there. The runtime cannot see your local disk, so the code travels inside one notebook cell, the sync cell. Nothing is cloned on the runtime.
python sync.py            # pack src/sartransfer/**/*.py and pyproject.toml into every notebook
python sync.py --check    # list stale notebooks, exit 1 if any (an empty sync cell counts as stale)
python sync.py --clear    # empty the sync cells again, before committing
python sync.py in its
folder. No install is needed for this step.HF_TOKEN, get access to
three gated models. Accept the DINOv3 licence on both
facebook/dinov3-vitl16-pretrain-lvd1689m and
facebook/dinov3-vitl16-pretrain-sat493m. Access is granted per model and
approved by hand, which can take time. Accept the contact-info gate on
waterdisappear/SARATR-X. C-RADIOv4-H and TerraMind are not gated. Without
access, the download fails with error 403 and the notebooks print FAILED
for that model.
Copy .env.example to .env, fill in HF_TOKEN (a read token is
enough), and put the file where src/sartransfer/env.py looks for it (SEARCH_PATHS).
Without it, the code asks for the token with getpass.Colab: Mount Google Drive to Server…) and run notebooks 00
to 09 in order, on the runtime given in the table. Notebooks 10 to 14 are
optional. 10 to 13 use what 00 to 09 saved on Drive; 14 needs only the
CaFFe zip and the model weights, which it downloads if missing.The published notebooks have empty sync cells. An empty cell stops the
notebook with a message that says to run python sync.py, so it cannot run
old code. Run python sync.py after every code edit. Commit notebooks with
empty sync cells: the code belongs in src/ once. sync.py prints a source
fingerprint locally, and the sync cell prints it again on the runtime; if the
two differ, the runtime is running old code.
Use an A100 with High-RAM. On SI, the row-5 extraction printed "RAM used 67 of 179 GB" (satellite DINOv3) and 80 of 179 GB (C-RADIO). Earlier runs, on a runtime whose RAM was not printed, stopped three times without a Python error; memory was suspected but not confirmed.
| notebook | runtime | time recorded (A100) | what it does |
|---|---|---|---|
00_setup – 02_tiling | CPU | not recorded | runtime and secrets check; download and measure CaFFe; tiling check |
03_encoders | GPU | 43 min for the first loop | zone probe per encoder and normalisation, on SI |
04_compare | any | not recorded | compares encoders per band, sensor and resolution |
05_unet | GPU | 19.9 min (A100-40GB) | 3-class U-Net from scratch |
06_fronts | GPU, High-RAM | 22 min for the four encoders | 4-class U-Net and probe fronts on SI |
07_test | GPU, High-RAM | encoders 25 min, U-Nets about 5 min, satellite DINOv3 probe 6.5 min | arm 1 on TEST (run once) |
08_heads | GPU, High-RAM | layer sweep 13–14 min per encoder; heads on SI 51–110 min per run, about 4.8 h in total; heads on TEST about 1.5 h | arm 2: layer sweep, heads on SI, heads on TEST (run once), precision check |
09_conditioning | GPU, High-RAM | 43 min (satellite DINOv3), 49 min (C-RADIO) | approach A, exploratory, SI only |
10_fiftyone | CPU | not recorded | FiftyOne dataset of the per-image results, zipped to Drive for scripts/view_results.py |
11_predictions | GPU | redraw about 5 min; RAM used 12 of 179 GB | share of the TEST error from COL Sentinel-1; copy-back speed check; redraws four models' TEST predictions |
12_resolution | GPU, A100 only | 9.6 min | pixel size, SI only: X-band 7 m → 20 m |
13_bands | GPU, A100 only | part 2: 5.7 min | every band from the saved results; pixel size within C-band, SI only: 12 m → 20 m |
14_embeddings | GPU, A100, standard RAM | 7.2 min | frozen features of the two GIF images, no training: embedding maps, similarity search, ocean-vs-glacier AUC, raw and AnyUp |
The times come from the reported runs. Head training in 08 and 09 was sped up afterwards (identical weights in a CPU test); the new times were not measured. Per-step times are in docs/results.md.
What the notebooks keep on Google Drive:
MyDrive/sar-transfer/
  .env                              secrets, never in git
  raw/data_raw.zip                  CaFFe zip, downloaded once
  results/                          result CSVs, saved heads (heads__*.pt), U-Net weights
  weights/anyup_multi_backbone.pth  AnyUp weights, downloaded if missing
  hf_cache/                         Hugging Face model cache
  fiftyone/                         sar-transfer-results.zip, FiftyOne dataset (notebook 10)
  predictions/                      sar-transfer-predictions.zip, redrawn TEST predictions (notebook 11)
  resolution_test/                  restest_*.csv, pixel-size and band tables (notebooks 12-13)
  embeddings/                       figures, embeddings_numbers.csv, embeddings_gif_<stem>.npz (notebook 14)
The encoder output is now cast to float16 on the GPU before it is copied to the CPU. On an A100 (notebook 11, 298 tiles per encoder) the copy-back fell from 9.3 to 1.2 ms per tile for C-RADIO (layer 32; forward 10.4 ms) and from 7.8 to 1.2 ms for the satellite DINOv3 (layer 21; forward 7.8 ms). The encoder pass is 41–42 % faster, and the features are bit-identical, so no reported number changes. The reported runs, and their recorded times, used the old path.
The reported numbers come from the saved heads and the result CSVs on Drive. Neither is in git. After the reported runs the code was fixed:
legacy_tile_sampler=True recovers the
reported tile set.load_head_state loads the old heads. In an offline CPU test, heads trained
by the old code gave byte-identical test CSVs with the new code. The reported
heads themselves were not re-scored, and CUDA was not tested..env
line-break check; the remote-code check covers subfolders; U-Net log loss of
a short last window; conditioning verdict with one seed; one prediction pass
for the 3-class U-Net test; head training reuses its training data across
heads; one class-weight function; two leftovers removed.heads.summary_table takes the zones4 "all" row from the first
grouping, as the run code does (the "all" rows are equal in every grouping).Retraining gives different heads, even with legacy_tile_sampler=True,
because the initial weights are now seeded. Recorded software: Python 3.13.15,
torch 2.11.0+cu128. The versions of transformers, timm, terratorch and the
other libraries were not recorded; runtime pip installs are unpinned.
torch.load in src/ uses
weights_only=True; the DINOv3 and C-RADIO weights are safetensors; the
pickled checkpoints were scanned without running them.0057b339059c0b9e1b4ba996f975410ebbfdfcc8, and its 26 Python files are
SHA-256-checked against a reviewed copy before loading. C-RADIO runs made
before the pin was added ran unpinned remote code.weights_only rule, the C-RADIO pin and hash table, the .env parser,
the empty sync cells and a secret scan are tested in CI on every push and
pull request (.github/workflows/ci.yml), together with ruff and compileall.| component | licence | use here |
|---|---|---|
| this repository | MIT, see LICENSE (Copyright (c) 2026 Abhishek Singh) | everything except src/sartransfer/models/anyup/ |
src/sartransfer/models/anyup/ | CC BY 4.0, third-party code (LICENSE and NOTICE.md in the folder) | vendored AnyUp inference code |
| AnyUp weights | no separate licence is stated by the source; the AnyUp repository's only licence is CC BY 4.0 | downloaded at run time |
| CaFFe dataset | CC BY 4.0 | downloaded at run time |
| CaFFe official code | CC BY 4.0 | not copied; fronts.py and tiling.py reimplement its evaluation route and use its normalisation constants |
| DINOv3 ViT-L/16, LVD-1689M and SAT-493M | DINOv3 License (Meta), gated with manual approval | downloaded at run time; publications must acknowledge the use of DINOv3 |
| C-RADIOv4-H weights | NVIDIA Open Model License Agreement (the June 2024 version linked from the model card); not gated | downloaded at run time |
| C-RADIOv4-H remote code | 20 of its 26 Python files carry an NVIDIA proprietary notice, 2 an Apache-2.0 notice | not in this repository; only SHA-256 values are stored |
| TerraMind 1.0 base | Apache-2.0 (model card metadata) | downloaded at run time |
| terratorch | Apache-2.0 up to release 1.2.7; "Apache-2.0 AND MIT" from 1.2.8 (May 2026), with MIT for four dataset files. The installed version was not recorded | installed at run time |
| SARATR-X v1 | CC BY-NC 4.0, non-commercial, on both the Hugging Face model card and the GitHub repository; gated | downloaded at run time |
| Cosmos-Reason2-8B | NVIDIA Open Model License; the model card adds "Additional Information: Apache License 2.0"; gated | closed arm; code not in this repository |
No weights or data are redistributed here. This work uses DINOv3 by Meta.
Data and benchmark:
Published CaFFe models:
Models and code used:
models/hivit.py is our own implementation.LICENSE MIT
.env.example template for the Hugging Face token (HF_TOKEN)
pyproject.toml package metadata and dependencies
sync.py packs src/ into every notebook (--check, --clear)
docs/results.md full tables, methods and caveats
notebooks/ 00_setup to 09_conditioning, run in order; 10-14 viewer,
predictions, pixel size, bands and frozen features
(see "Seeing the results")
scripts/ view_results.py (FiftyOne viewer on your PC), make_gifs.py,
make_embedding_gifs.py
docs/figures/ the four explained GIFs
src/sartransfer/
data/ CaFFe download and inventory, tiling and normalisation, patch targets
models/ frozen encoders, HiViT port, U-Net, decoder heads, AnyUp loader,
C-RADIO remote-code hashes
models/anyup/ vendored AnyUp inference code (CC BY 4.0, own LICENSE and NOTICE.md)
features.py probe.py runs.py baseline.py fronts.py arm 1
heads.py checks.py arm 2 heads, AnyUp precision check
conditioning.py approach A (exploratory, notebook 09)
viz.py predmaps.py FiftyOne dataset, redrawn test predictions (notebooks 10-11)
resolution.py pixel size vs radar band (notebooks 12-13)
embeddings.py frozen features without training (notebook 14)
env.py reads HF_TOKEN from .env
sync.py the sync code behind ./sync.py
All code outside src/sartransfer/models/anyup/ was written for this project, with
the help of an AI coding assistant (Claude Code).
fronts.py and data/tiling.py re-implement the official CaFFe evaluation
route and reuse its normalisation constants, so that the numbers stay
comparable with the published ones.



