
Mathematical plotting library for ocaml
See the codeREADME
Oplot
Mathematical plotting library for ocaml
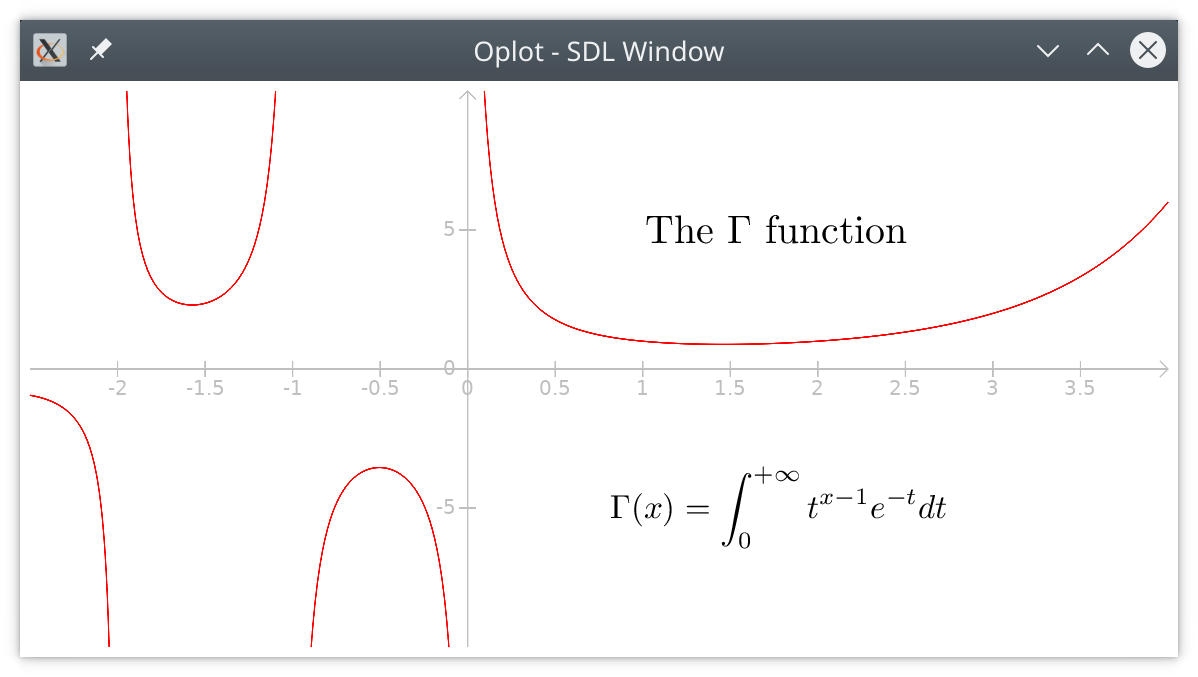
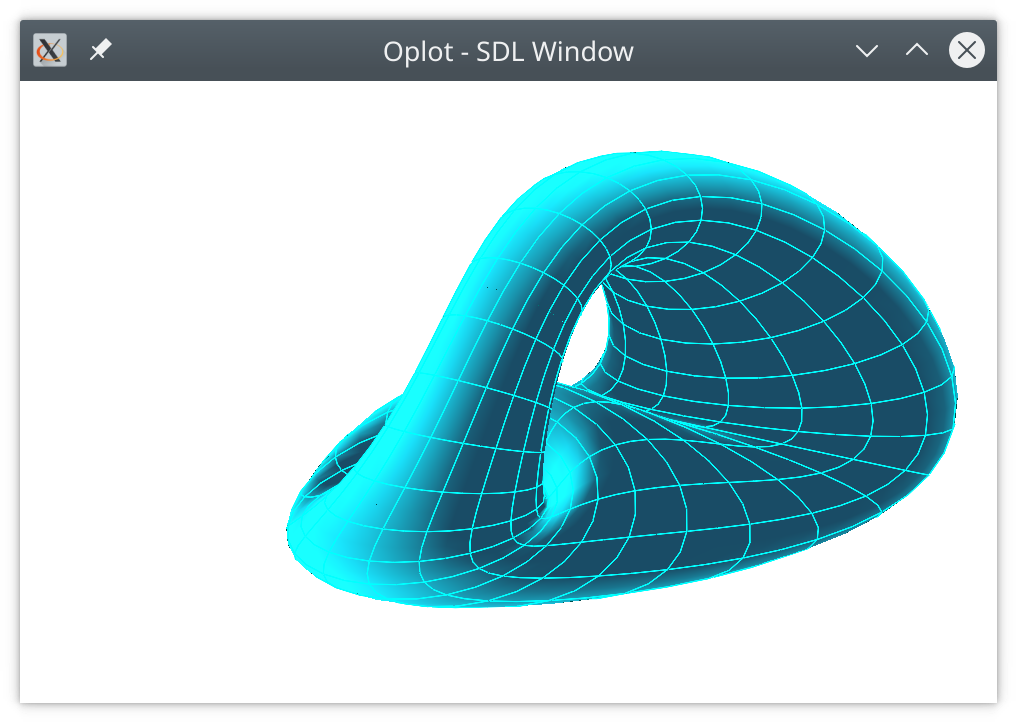
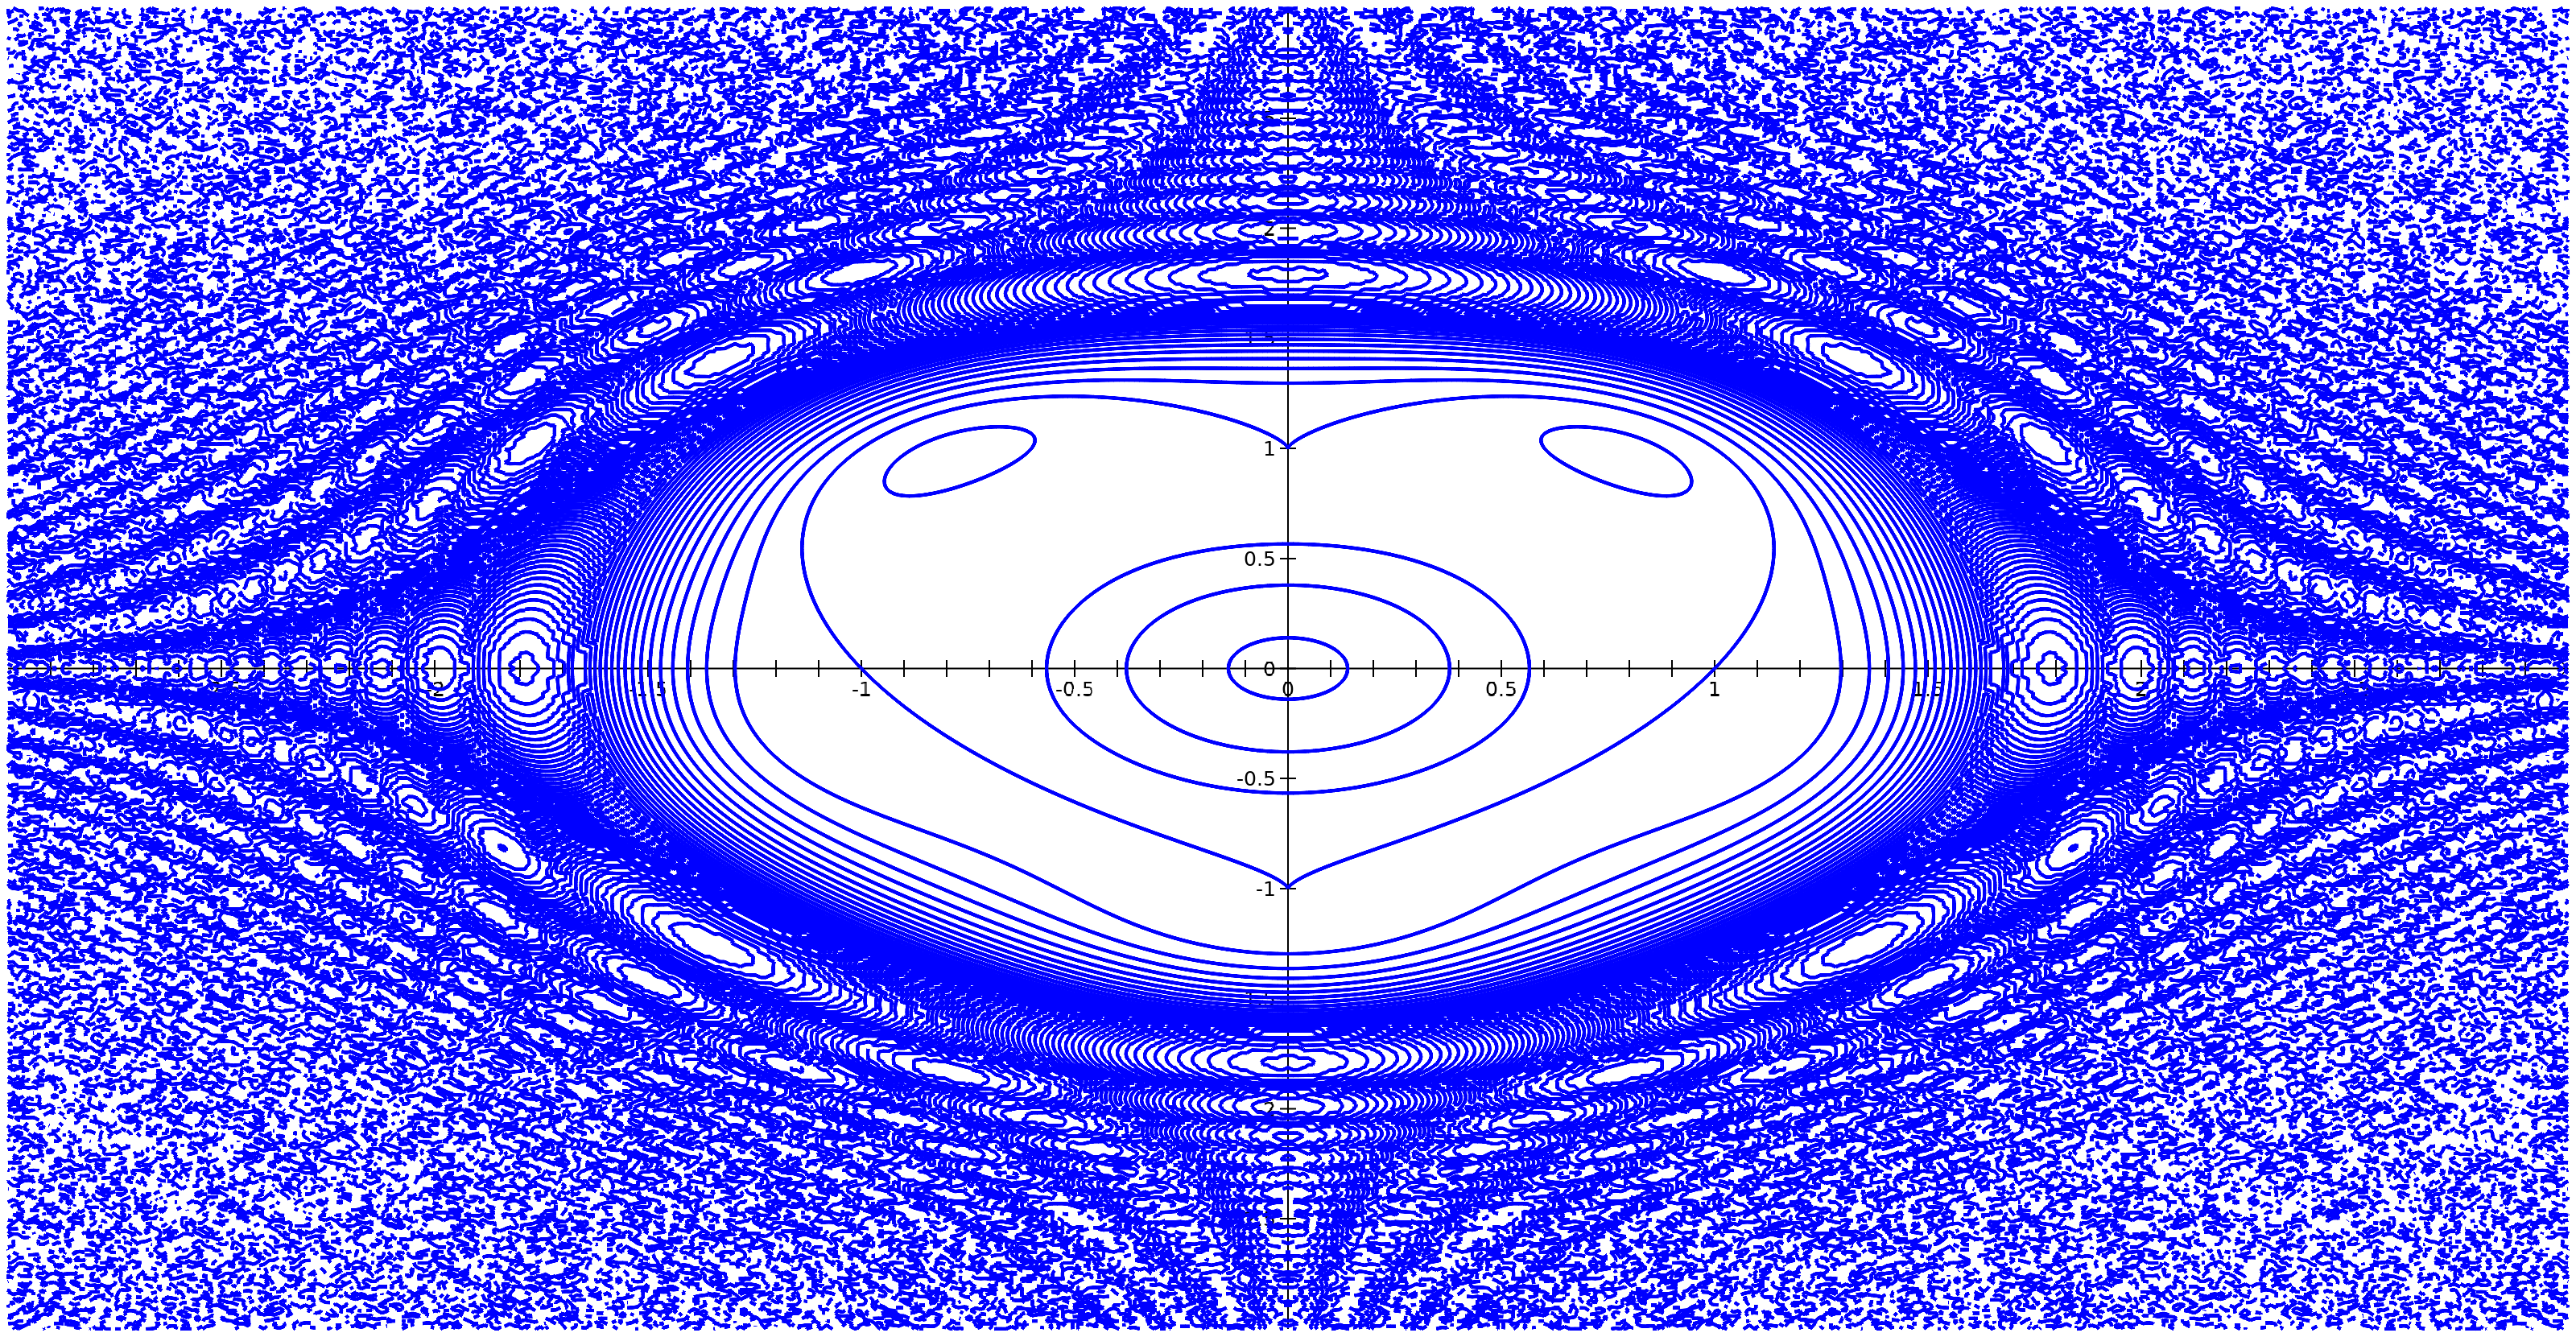
| 2D plot and LaTeX | 3D surface | Isocurve |
|---|---|---|
 |  |  |
-
2D plots
- function
y = f(x) - parametric curves
- implicit curves
f(x,y) = 0 - can use mathematical functions from other libraries like
gsl - can use LaTeX to display text and formulas
- animations
- Matrix or grid display
- ...
- function
-
3D plots
- parametric surfaces
- 3D graphs
z = f(x,y) - interactive 3D rotation and zoom
- ...
-
Many renderers
- GPU graphics (opengl/sdl)
- Graphics package
- high quality vector graphics in EPS or PDF files
- xfig files
- image screenshots
Documentation
Examples and API documentation.
GUI
An official standalone GUI for oplot.0.72:
goplot
Examples
The top directory contains examples that can be run from the ocaml
toplevel. See the README file.
Install version >= 0.80
The current version does not require lablgl, but uses instead tgls and gl-legacy.
They will be automatically installed if you use opam install oplot.
If you need the newest versions:
opam install tgls
opam pin https://github.com/sanette/gl-legacy.git
opam pin https://github.com/sanette/oplot.git
On Windows, you may need to select these tsdl* versions:
opam pin https://github.com/sanette/tsdl
opam pin https://github.com/sanette/tsdl-ttf.git
opam pin https://github.com/sanette/tsdl-image.git
opam install oplot
Install v 0.72
oplot<0.80requireslablgl. If you have any trouble with this, try this one.:
opam pin add https://github.com/sanette/lablgl-lib.git
opam install lablgl.1.07-lib
opam install oplot.0.72
Requirements
-
For PDF output you need to install the
fig2devsystem package. -
For LaTeX display you need a working LaTeX installation; for instance install the
texlivesystem package. -
For using the Gnu Scientific Library, install the
gslopam package:
opam install gsl
- For rendering via the OCaml Graphics library (currently not
recommended), you need to use the
oplot-graphicsopam package.
Extensions to other backends
It's easy to add another backend by using the GRAPHICS signature, see https://github.com/sanette/oplot-graphics
Contributors

144 commits
Similar repos


Languages
OCaml
92.9%
Perl
5.2%
Standard ML
1.1%
Mathematical plotting library for ocaml
See the codeREADME
Oplot
Mathematical plotting library for ocaml
| 2D plot and LaTeX | 3D surface | Isocurve |
|---|---|---|
| | |
-
2D plots
- function
y = f(x) - parametric curves
- implicit curves
f(x,y) = 0 - can use mathematical functions from other libraries like
gsl - can use LaTeX to display text and formulas
- animations
- Matrix or grid display
- ...
- function
-
3D plots
- parametric surfaces
- 3D graphs
z = f(x,y) - interactive 3D rotation and zoom
- ...
-
Many renderers
- GPU graphics (opengl/sdl)
- Graphics package
- high quality vector graphics in EPS or PDF files
- xfig files
- image screenshots
Documentation
Examples and API documentation.
GUI
An official standalone GUI for oplot.0.72:
goplot
Examples
The top directory contains examples that can be run from the ocaml
toplevel. See the README file.
Install version >= 0.80
The current version does not require lablgl, but uses instead tgls and gl-legacy.
They will be automatically installed if you use opam install oplot.
If you need the newest versions:
opam install tgls
opam pin https://github.com/sanette/gl-legacy.git
opam pin https://github.com/sanette/oplot.git
On Windows, you may need to select these tsdl* versions:
opam pin https://github.com/sanette/tsdl
opam pin https://github.com/sanette/tsdl-ttf.git
opam pin https://github.com/sanette/tsdl-image.git
opam install oplot
Install v 0.72
oplot<0.80requireslablgl. If you have any trouble with this, try this one.:
opam pin add https://github.com/sanette/lablgl-lib.git
opam install lablgl.1.07-lib
opam install oplot.0.72
Requirements
-
For PDF output you need to install the
fig2devsystem package. -
For LaTeX display you need a working LaTeX installation; for instance install the
texlivesystem package. -
For using the Gnu Scientific Library, install the
gslopam package:
opam install gsl
- For rendering via the OCaml Graphics library (currently not
recommended), you need to use the
oplot-graphicsopam package.
Extensions to other backends
It's easy to add another backend by using the GRAPHICS signature, see https://github.com/sanette/oplot-graphics
Similar repos
Contributors
144 commits
Languages
OCaml
92.9%
Perl
5.2%
Standard ML
1.1%