
Explore codebases visually as an interactive call graph and export structured, low-token context directly to AI coding assistants.
TypeScript
0
4 commits
updated Sep 21, 2026
See what people are saying (1)
README

Code Graph View
Navigate complex codebases visually as an interactive call graph. Trace execution paths, analyze git change blast radiuses, and curate high-signal context for AI assistants in one click.



Overview
Understanding non-trivial codebases by jumping through dozens of open editor tabs and running blind text searches is slow and error-prone. When explaining a bug, refactoring a service, or onboarding onto a new repository, developers need to see how functions connect and pass data.
Code Graph View turns your code into an intuitive visual topology:
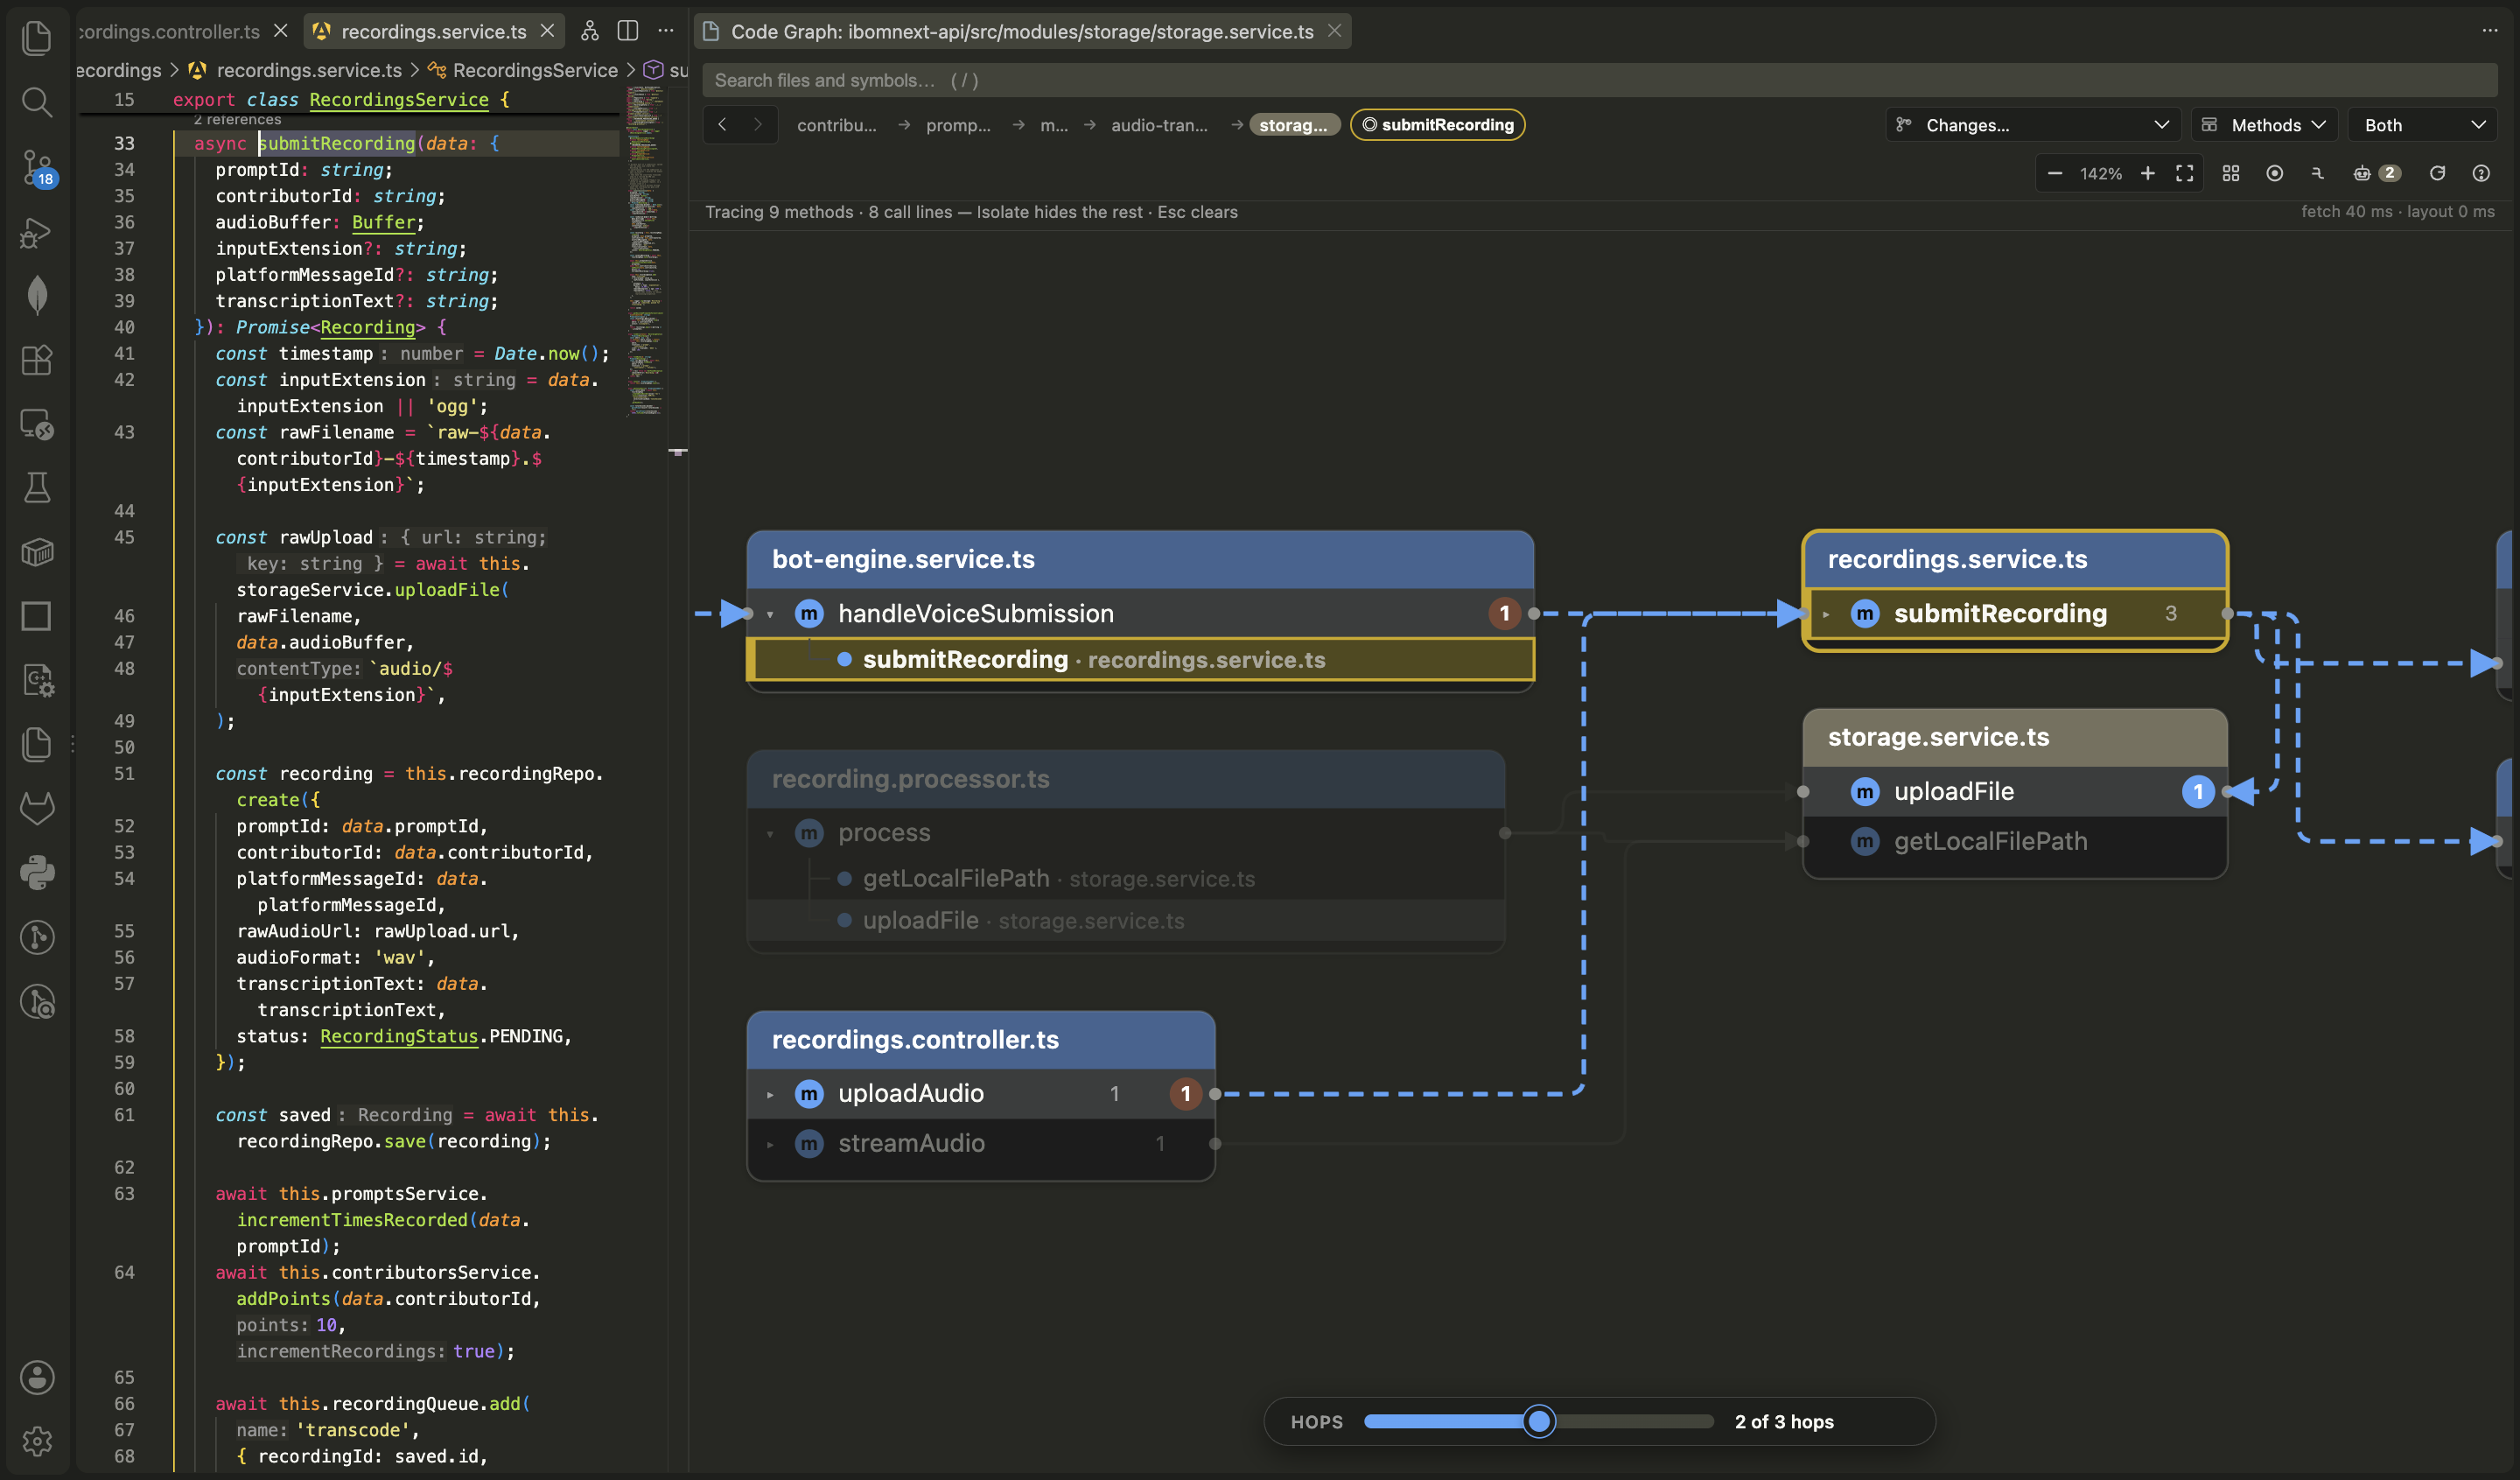
- Files are cards, methods are interactive rows, and lines are live calls.
- Clicking any method highlights its upstream callers and downstream callees.
- AI Context Curation: Capture the exact execution path you are inspecting—complete with call hierarchy trees, method signatures, and deduplicated types—and hand it to GitHub Copilot, Cursor, Claude Code, or ChatGPT (pre-filled into VS Code Chat, or copied to your clipboard to paste).
- Visual Git Blast Radius: See exactly which symbols and downstream callers are impacted by staged, unstaged, branch, or commit changes before opening a pull request.
Quick Start
- Open any code file in a supported language (
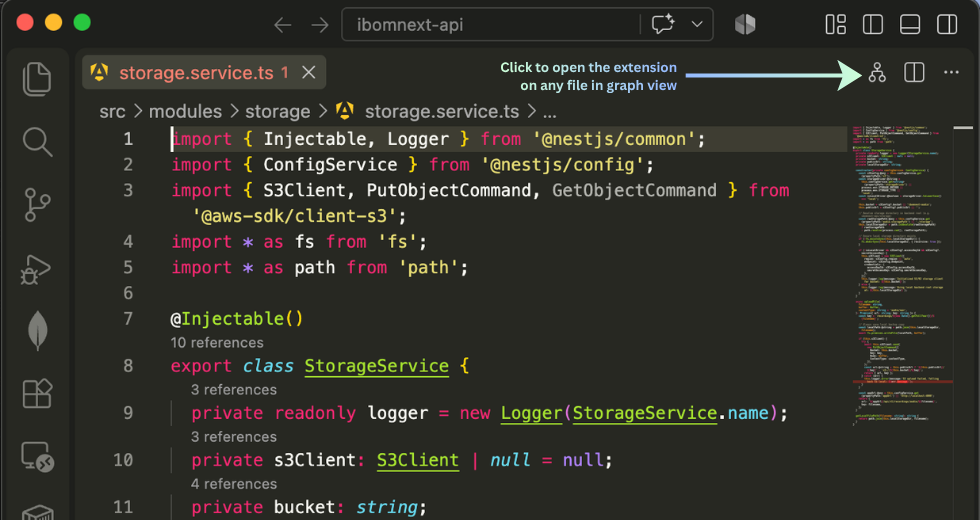
.ts,.tsx,.js,.jsx,.py,.go,.rs). - Click the Code Graph icon in the top-right action bar of the file editor (look for the hierarchy/nodes icon next to the Split Editor button). Hovering over it displays
Code Graph: Open Graph for Active File. - Alternatively, press Cmd+Shift+P (or Ctrl+Shift+P) and type
Code Graph: Open Graph for Active File.
Core Capabilities
1. Interactive Call Hierarchy & Tracing
- Live Upstream & Downstream Flow: Click any method to illuminate who calls it (orange) and what it invokes (blue).
- Multi-Hop Exploration: Adjust the Hops slider to expand 1, 2, 3, or more levels deep across the architecture.
- Fluid Keyboard Navigation: Step into callees (→ / Enter), step into callers (←), or cycle sibling methods (↑ / ↓).
- Instant Re-Rooting: Double-click any method or file to make it the center of your graph.
2. AI Context Curation & Export
AI assistants like Copilot, Cursor, and Claude Code cannot see your screen. Instead of pasting thousands of lines of raw source files or waiting for the model to guess the call chain:
- Curate Execution Paths: Click
+on individual methods or click+ Add Traceto capture an entire multi-hop path. - Granular Detail Control: Toggle each method between Name, Sig (inputs, return types, and decorators), or Full (complete implementation body).
- Deduplicated Schemas: Automatically extracts referenced TypeScript interfaces and data models once, eliminating redundant token usage.
- Secrets masked: Common credentials (API keys, tokens, private keys, passwords in URLs, quoted values on fields like
passwordorapiKey) are replaced with[REDACTED]before you copy or send. On by default; seecodeGraphView.redactSecrets. - Session-only: The context lives in memory and is cleared when the workspace closes.
- Send to chat: Opens VS Code Chat (Copilot) pre-filled with the context. For Cursor, Continue, Cline, Cody and Claude Code the context is copied to your clipboard and, where the extension exposes a command, its chat panel is opened; paste to send. You can also copy prompt-ready markdown with one click.
- Pre-Built & Custom Prompts: Choose from Explain this flow, Find bugs & edge cases, Generate unit tests, or type custom instructions.
3. Git Impact & Blast Radius Analysis
- Inspect Live Changes: Filter the graph to show only methods touched by uncommitted edits, staged changes, PR branches (
HEAD vs main), or recent commits. - Color-Coded Status: Amber indicators mark modified methods; green indicators mark newly added symbols.
- Callers Impact: Immediately identify all upstream callers that could break from your modifications.
4. Live Signature & Type Inspector (Alt+S)
- Inspect parameter types, optional flags, default values, and decorators (
@Body(),@Param()). - View return types and referenced project type definitions side-by-side without leaving the graph.
- Click Open in Editor to jump directly to the exact source location.
5. Services Architecture Mode
- Switch between Detailed Methods Mode (fine-grained call graph) and Services Mode (file- and module-level dependencies with call counts).
Keyboard Shortcuts
| Shortcut | Action |
|---|---|
| → / Enter | Step into callees (downstream flow) |
| ← | Step into callers (upstream origin) |
| ↑ / ↓ | Step sibling methods in active file |
| Space | Open active method in editor beside graph |
| F | Center view on active method |
| 0 | Fit entire graph in view |
| / | Search files and symbols to re-root |
| Alt + C | Toggle AI Context panel |
| Alt + S | Toggle Signature Inspector |
| Alt + ← / → | Navigate Back / Forward through history |
| Esc | Clear selection or exit isolate mode |
Architecture & Design
- Native Language Server Protocol: Leverages VS Code's built-in LSP (Call Hierarchy, Document Symbols, Definitions, and Hover). No background daemons, external databases, or heavy local indexing required.
- Deterministic Layout Engine: Powered by ELK with persistent coordinate caching. The graph remains stable and predictable as you expand nodes.
- Signature extraction:
tsSignature.tsis a small hand-written parser (TypeScript/JavaScript, plus a generic one for Go, Rust and Python) that reads parameters, generic bounds (<T, R extends Base>) and return types from the source, and fills in inferred types and doc comments from the language server's hover. - High-Performance SVG: Custom SVG rendering pipeline with smooth pan, pinch-to-zoom, and responsive interaction.
Requirements
The graph is built from your language server's call hierarchy, so each language needs an extension that provides it: TypeScript/JavaScript (built in), Go (gopls, via the Go extension), Rust (rust-analyzer) and Python (Pylance). The git changes view needs git on your PATH and a trusted workspace.
Configuration
Settings can be customized in settings.json:
{
  // Call hops fetched upfront when opening a method (1-8, default: 2)
  "codeGraphView.maxDepth": 2,

  // Hide test files (*.spec.ts, *.test.ts, __tests__) unless explicitly rooted (default: true)
  "codeGraphView.hideTests": true,

  // Include class constructors as graph nodes (default: false)
  "codeGraphView.includeConstructors": false,

  // Mask credentials in copied or sent AI context (default: true)
  "codeGraphView.redactSecrets": true
}
Contributing & Development
For architecture diagrams, local environment setup, build commands, and testing guidelines, see DEVELOPMENT.md.
License
MIT
Contributors

4 commits
Similar repos


Languages
TypeScript
73.0%
JavaScript
18.2%
CSS
8.8%
Explore codebases visually as an interactive call graph and export structured, low-token context directly to AI coding assistants.
TypeScript
0
4 commits
updated Sep 21, 2026
See what people are saying (1)
README
Code Graph View
Navigate complex codebases visually as an interactive call graph. Trace execution paths, analyze git change blast radiuses, and curate high-signal context for AI assistants in one click.
Overview
Understanding non-trivial codebases by jumping through dozens of open editor tabs and running blind text searches is slow and error-prone. When explaining a bug, refactoring a service, or onboarding onto a new repository, developers need to see how functions connect and pass data.
Code Graph View turns your code into an intuitive visual topology:
- Files are cards, methods are interactive rows, and lines are live calls.
- Clicking any method highlights its upstream callers and downstream callees.
- AI Context Curation: Capture the exact execution path you are inspecting—complete with call hierarchy trees, method signatures, and deduplicated types—and hand it to GitHub Copilot, Cursor, Claude Code, or ChatGPT (pre-filled into VS Code Chat, or copied to your clipboard to paste).
- Visual Git Blast Radius: See exactly which symbols and downstream callers are impacted by staged, unstaged, branch, or commit changes before opening a pull request.
Quick Start
- Open any code file in a supported language (
.ts,.tsx,.js,.jsx,.py,.go,.rs). - Click the Code Graph icon in the top-right action bar of the file editor (look for the hierarchy/nodes icon next to the Split Editor button). Hovering over it displays
Code Graph: Open Graph for Active File. - Alternatively, press Cmd+Shift+P (or Ctrl+Shift+P) and type
Code Graph: Open Graph for Active File.
Core Capabilities
1. Interactive Call Hierarchy & Tracing
- Live Upstream & Downstream Flow: Click any method to illuminate who calls it (orange) and what it invokes (blue).
- Multi-Hop Exploration: Adjust the Hops slider to expand 1, 2, 3, or more levels deep across the architecture.
- Fluid Keyboard Navigation: Step into callees (→ / Enter), step into callers (←), or cycle sibling methods (↑ / ↓).
- Instant Re-Rooting: Double-click any method or file to make it the center of your graph.
2. AI Context Curation & Export
AI assistants like Copilot, Cursor, and Claude Code cannot see your screen. Instead of pasting thousands of lines of raw source files or waiting for the model to guess the call chain:
- Curate Execution Paths: Click
+on individual methods or click+ Add Traceto capture an entire multi-hop path. - Granular Detail Control: Toggle each method between Name, Sig (inputs, return types, and decorators), or Full (complete implementation body).
- Deduplicated Schemas: Automatically extracts referenced TypeScript interfaces and data models once, eliminating redundant token usage.
- Secrets masked: Common credentials (API keys, tokens, private keys, passwords in URLs, quoted values on fields like
passwordorapiKey) are replaced with[REDACTED]before you copy or send. On by default; seecodeGraphView.redactSecrets. - Session-only: The context lives in memory and is cleared when the workspace closes.
- Send to chat: Opens VS Code Chat (Copilot) pre-filled with the context. For Cursor, Continue, Cline, Cody and Claude Code the context is copied to your clipboard and, where the extension exposes a command, its chat panel is opened; paste to send. You can also copy prompt-ready markdown with one click.
- Pre-Built & Custom Prompts: Choose from Explain this flow, Find bugs & edge cases, Generate unit tests, or type custom instructions.
3. Git Impact & Blast Radius Analysis
- Inspect Live Changes: Filter the graph to show only methods touched by uncommitted edits, staged changes, PR branches (
HEAD vs main), or recent commits. - Color-Coded Status: Amber indicators mark modified methods; green indicators mark newly added symbols.
- Callers Impact: Immediately identify all upstream callers that could break from your modifications.
4. Live Signature & Type Inspector (Alt+S)
- Inspect parameter types, optional flags, default values, and decorators (
@Body(),@Param()). - View return types and referenced project type definitions side-by-side without leaving the graph.
- Click Open in Editor to jump directly to the exact source location.
5. Services Architecture Mode
- Switch between Detailed Methods Mode (fine-grained call graph) and Services Mode (file- and module-level dependencies with call counts).
Keyboard Shortcuts
| Shortcut | Action |
|---|---|
| → / Enter | Step into callees (downstream flow) |
| ← | Step into callers (upstream origin) |
| ↑ / ↓ | Step sibling methods in active file |
| Space | Open active method in editor beside graph |
| F | Center view on active method |
| 0 | Fit entire graph in view |
| / | Search files and symbols to re-root |
| Alt + C | Toggle AI Context panel |
| Alt + S | Toggle Signature Inspector |
| Alt + ← / → | Navigate Back / Forward through history |
| Esc | Clear selection or exit isolate mode |
Architecture & Design
- Native Language Server Protocol: Leverages VS Code's built-in LSP (Call Hierarchy, Document Symbols, Definitions, and Hover). No background daemons, external databases, or heavy local indexing required.
- Deterministic Layout Engine: Powered by ELK with persistent coordinate caching. The graph remains stable and predictable as you expand nodes.
- Signature extraction:
tsSignature.tsis a small hand-written parser (TypeScript/JavaScript, plus a generic one for Go, Rust and Python) that reads parameters, generic bounds (<T, R extends Base>) and return types from the source, and fills in inferred types and doc comments from the language server's hover. - High-Performance SVG: Custom SVG rendering pipeline with smooth pan, pinch-to-zoom, and responsive interaction.
Requirements
The graph is built from your language server's call hierarchy, so each language needs an extension that provides it: TypeScript/JavaScript (built in), Go (gopls, via the Go extension), Rust (rust-analyzer) and Python (Pylance). The git changes view needs git on your PATH and a trusted workspace.
Configuration
Settings can be customized in settings.json:
{
  // Call hops fetched upfront when opening a method (1-8, default: 2)
  "codeGraphView.maxDepth": 2,

  // Hide test files (*.spec.ts, *.test.ts, __tests__) unless explicitly rooted (default: true)
  "codeGraphView.hideTests": true,

  // Include class constructors as graph nodes (default: false)
  "codeGraphView.includeConstructors": false,

  // Mask credentials in copied or sent AI context (default: true)
  "codeGraphView.redactSecrets": true
}
Contributing & Development
For architecture diagrams, local environment setup, build commands, and testing guidelines, see DEVELOPMENT.md.
License
MIT
Similar repos
Contributors
4 commits
Languages
TypeScript
73.0%
JavaScript
18.2%
CSS
8.8%