
disassembler, decompiler and debugger in one, with a built-in mcp server: point an ai at a binary and it can debug it, not just read it. ida-style listing, pseudocode (f5), x64dbg-style debugger (windows and linux), binary diff, lua plugins. reads pe, elf and mach-o. runs on windows, linux and macos.
See the codeSee what people are saying
README

ceasta
a disassembler, decompiler and debugger in one — for windows, linux and macos, x86, x64 and arm64




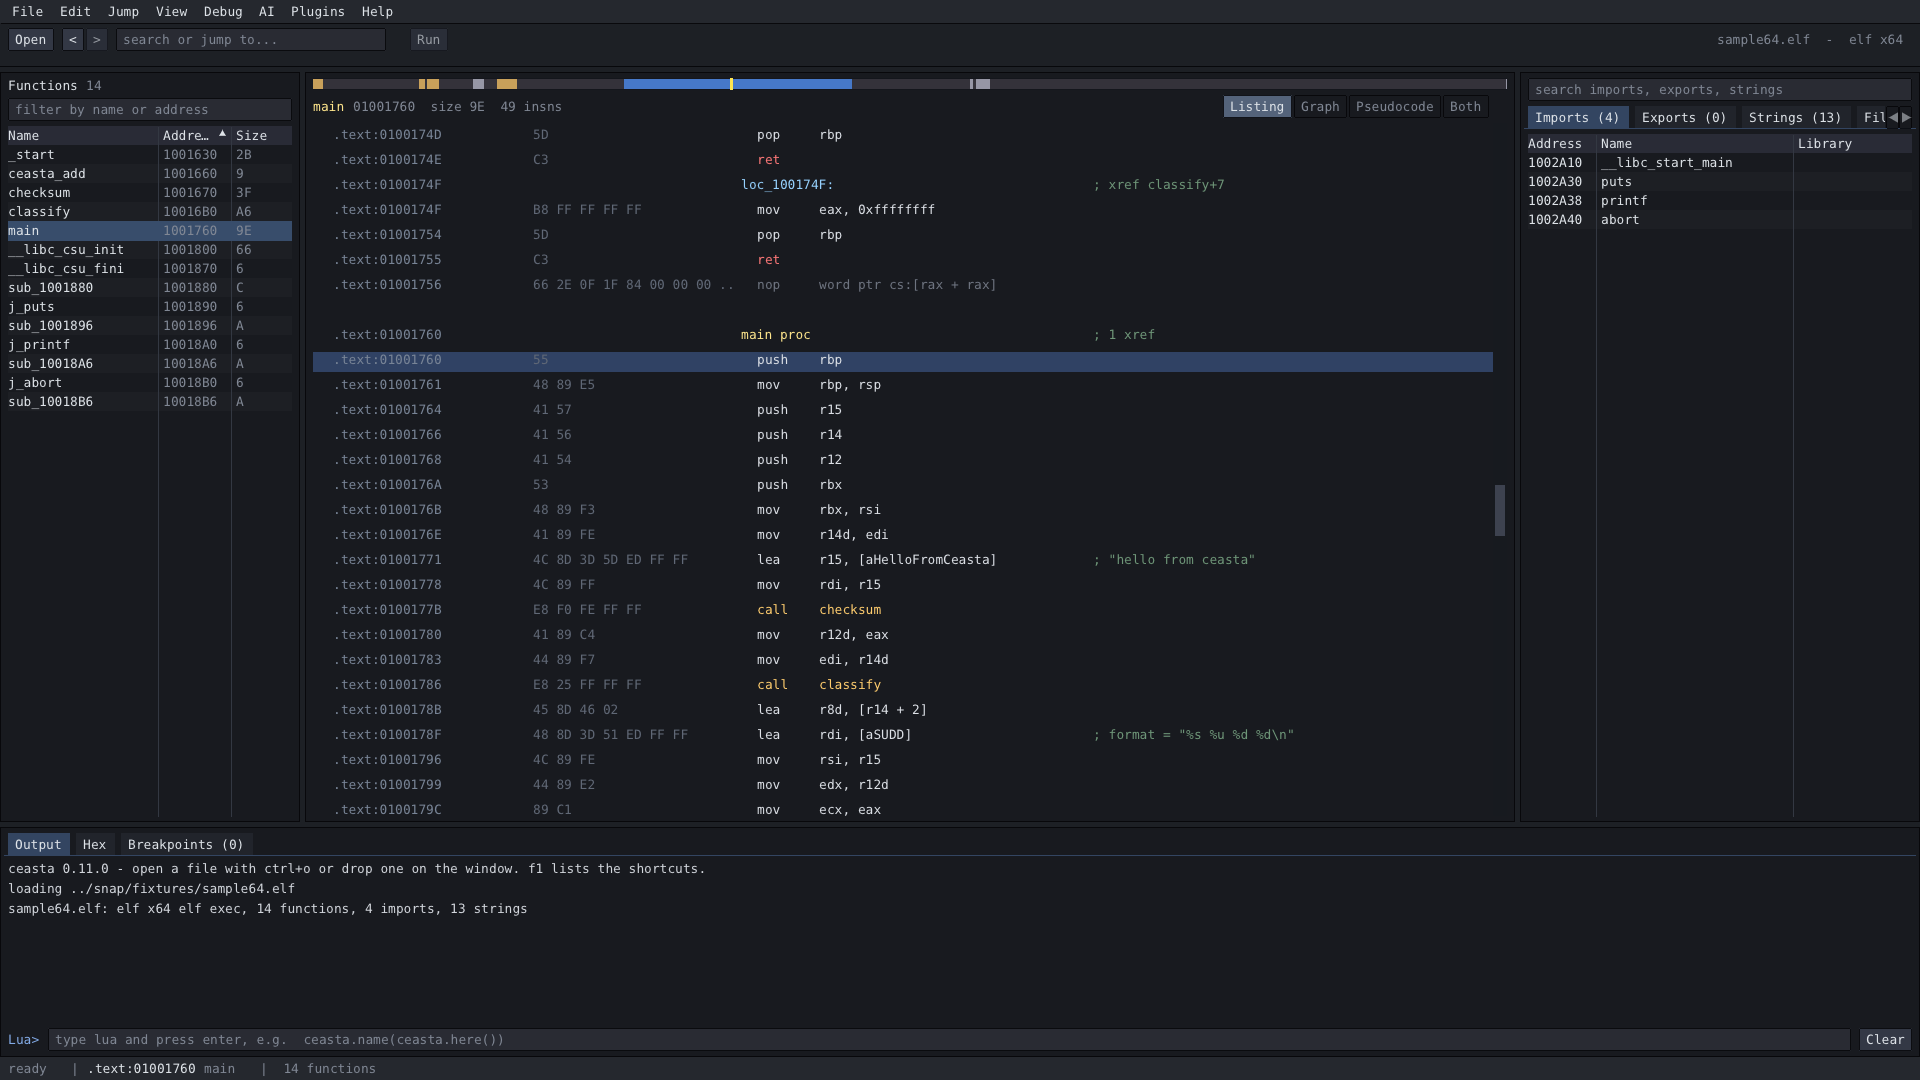
ida-style listing, a decompiler, a function graph, an x64dbg-style debugger, lua plugins, and a built-in MCP server so you can point an AI at a binary — one small program, everything vendored, nothing to install to build.
one function, three ways
ceasta shows the same code from raw bytes up to readable c, so you can drop to whatever level you need:
; assembly - the real instructions  // pseudocode (f5) - reconstructed c

checksum proc                       int checksum(int rdi)
  movzx   edx, byte ptr [rdi]       {
  test    dl, dl                        rdx = *(char*)rdi;
  je      loc_1191                      if (rdx == 0) {
  mov     eax, 0x1505                       return 0x1505;
loc_1179:                               }
  mov     ecx, eax                      rax = 0x1505;
  shl     ecx, 5                        do {
  add     eax, ecx                          rax = rax + (rax << 5) + rdx;
  add     rdi, 1                            rdi = rdi + 1;
  movzx   edx, dl                           rdx = *(char*)rdi;
  add     eax, edx                      } while (rdx != 0);
  movzx   edx, byte ptr [rdi]           return rax;
  test    dl, dl                    }
  jne     loc_1179
  ret
loc_1191:
  mov     eax, 0x1505
  ret
that's djb2 (5381 is 0x1505, and (h << 5) + h is h * 33). click a name in the pseudocode and name things as you understand them — y on the function gives it a prototype, n renames a variable:
unsigned checksum(const char* s)
{
    rdx = *(char*)s;
    if (rdx == 0) {
        return 0x1505;
    }
    h = 0x1505;
    do {
        h = h + (h << 5) + rdx;
        s = s + 1;
        rdx = *(char*)s;
    } while (rdx != 0);
    return h;
}
the decompiler is best-effort (x86 / x64, no structs yet) — great for getting a routine quickly, while the listing stays the source of truth.
download
grab it from the releases page:
| file | platform | what you get |
|---|---|---|
ceasta-x.y.z-setup.exe | windows 10/11 x64 | the full app, installs for your user (no admin), start menu + optional "open with ceasta" |
ceasta-x.y.z-windows-x64.zip | windows x64 | the full app, portable — unzip and run ceasta.exe |
ceasta-x.y.z-linux-x64.AppImage | linux x64 | the full app — chmod +x and run (on linux) |
ceasta-cli-x.y.z-linux-x64.tar.gz | linux x64 | ceasta-cli + plugins: analysis, disassembly, decompiler, scripting, terminal debugger, binary diff, signatures, and the MCP server |
ceasta-x.y.z-macos.dmg | macos 11+, apple silicon and intel | the app, no debugger yet — drag it to Applications (on a mac) |
ceasta-cli-x.y.z-macos.tar.gz | macos 11+, apple silicon and intel | ceasta-cli + plugins, everything above but the debugger |
what it does
- opens pe files (exe, dll, sys — x86, x64 and arm64), elf (x86, x64, arm64), mach-o (macos / ios programs and libraries, x86_64 and arm64, universal files too) and raw code
- auto analysis: functions (entry, exports, symbols, .pdata, unwind tables, mach-o function starts, tls callbacks, calls, pointers in data), switch tables, xrefs, strings (ascii + utf-16), imports / exports, thunks, noreturn calls
- ida-style listing: names instead of addresses, labels, xref and string comments, the arguments each instruction passes to a known api
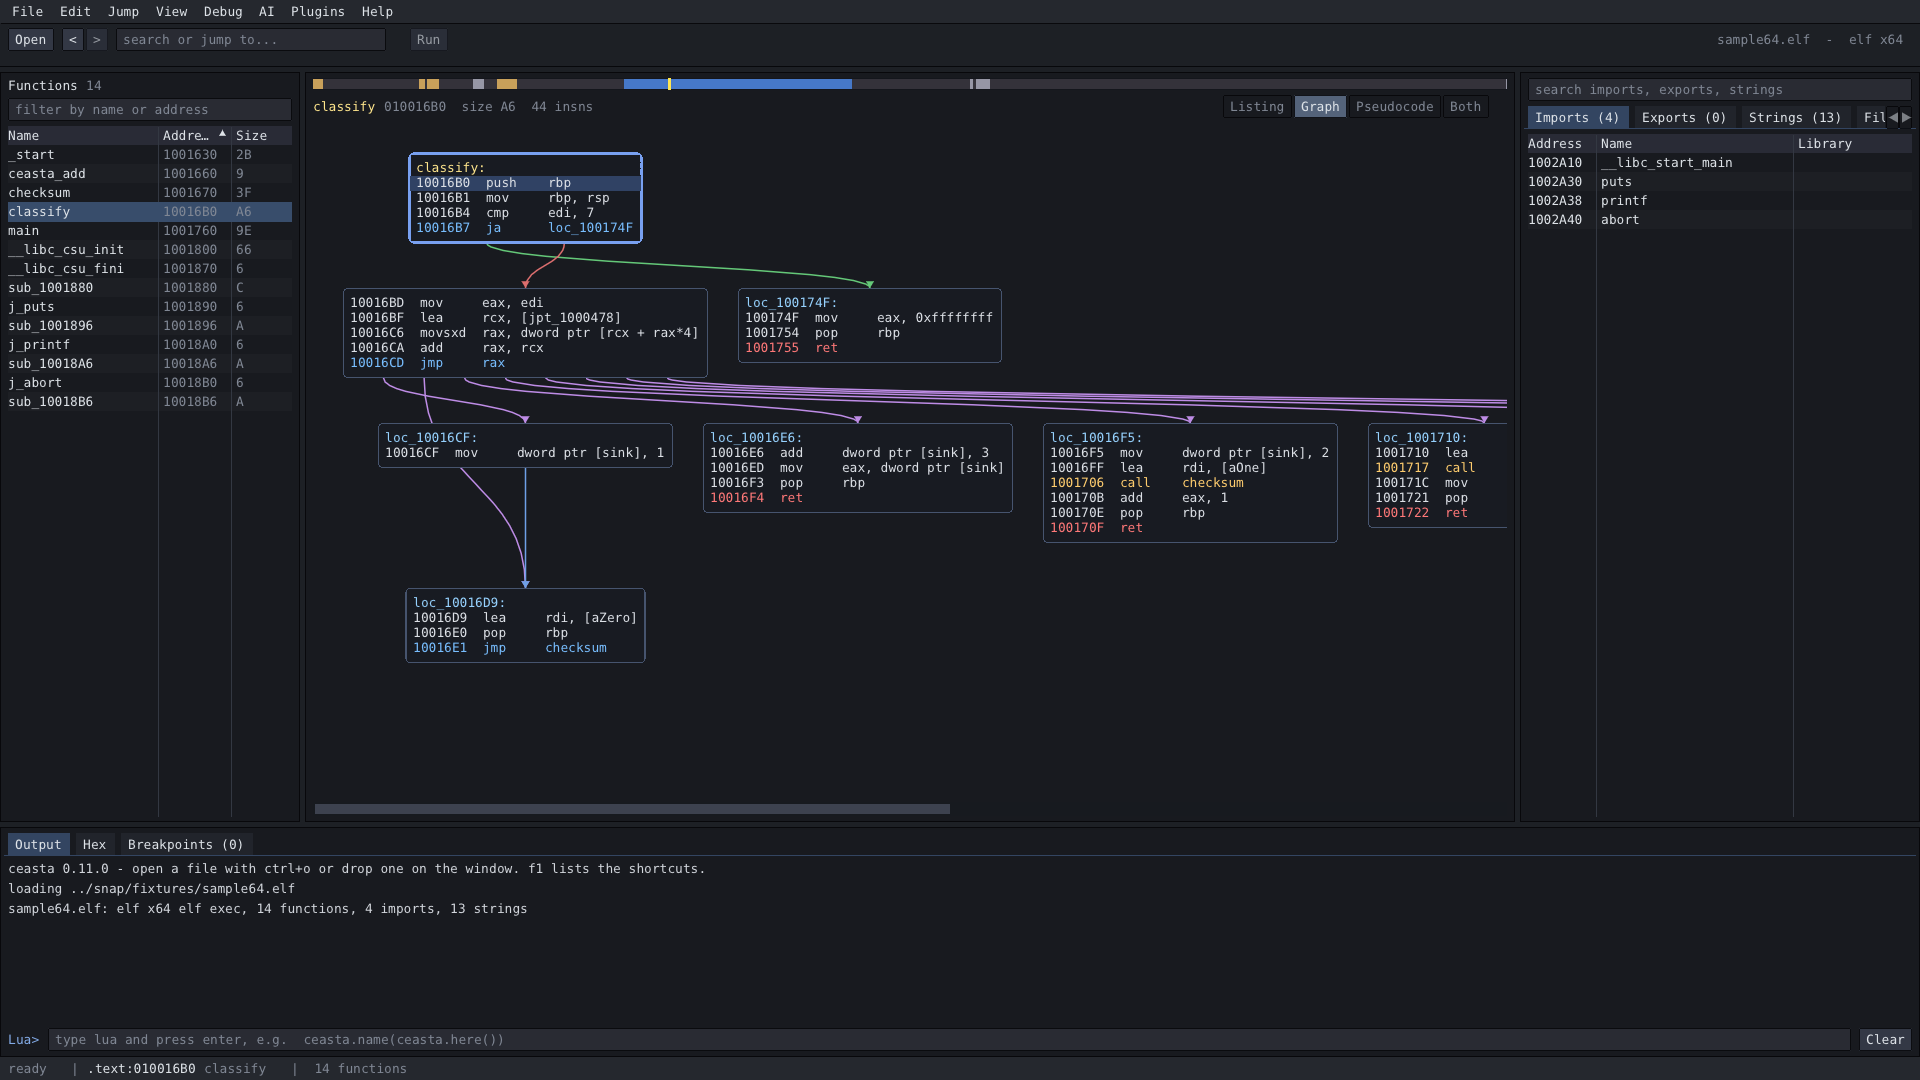
- function graph (space): colored edges, zoom with ctrl + wheel, drag to pan
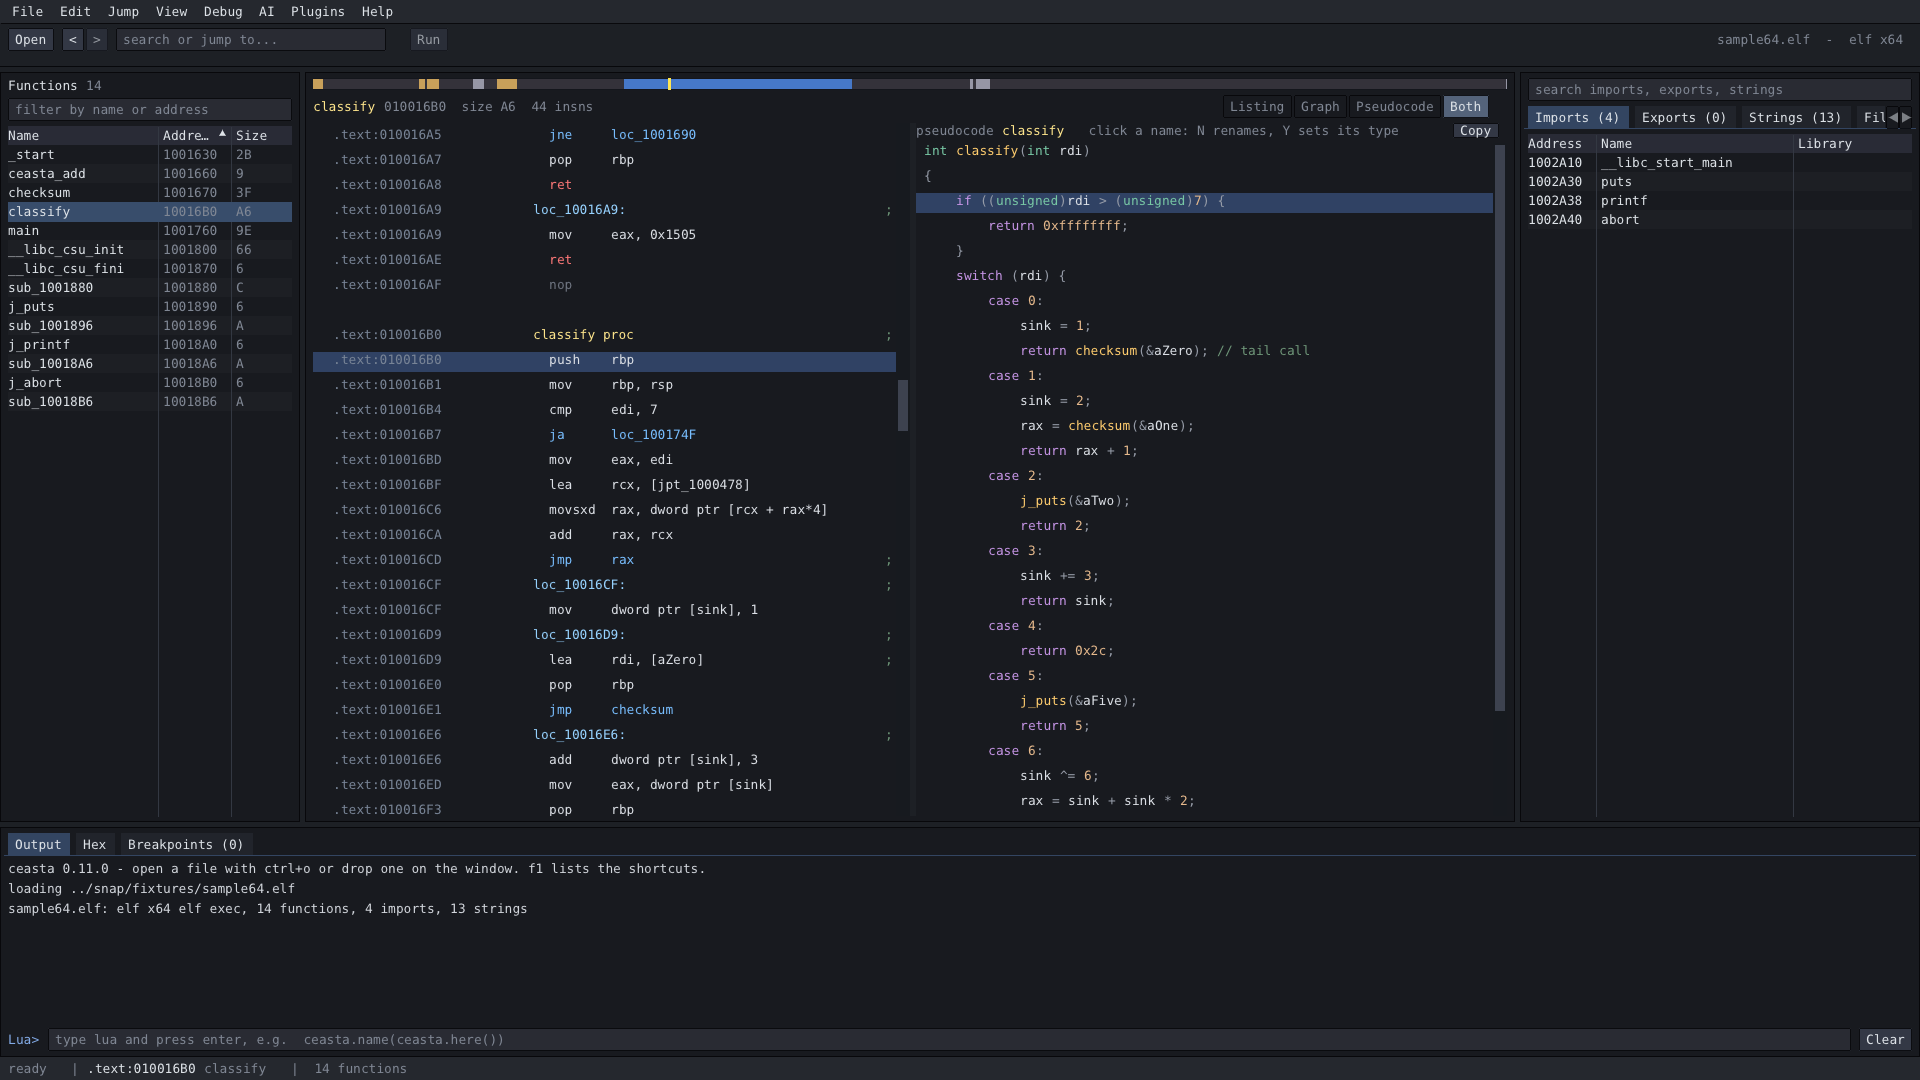
- decompiler (f5, x86 / x64): c-like pseudocode — if / else, loops, switch, stack variables, calls with their arguments (~350 known api prototypes). click a name:
nrenames it,ysets a type or a prototype. shift+f5 shows it next to the listing - a second decompiler if you want one: with kuna installed (a decompiler ported from ghidra's), the pseudocode view gets a
kunaswitch — its output for the same function, lines linked to the listing, arm64 too. more below - file info: headers, security flags (aslr, dep, cfg / pie, nx, relro, canary / hardened runtime), md5 / sha256 / imphash, section entropy, resources, version info, a mac program's code signature and entitlements, and warnings when it looks packed
- search everything (ctrl+f): functions, names, imports, exports, strings, comments and segments in one box, and the strings say where they're used
- debugger (x86 / x64, windows and linux): start or attach, breakpoints (with conditions:
rdi == 3), watchpoints on variables, step into / over / out, step back, run to cursor, pause, registers, stack, call stack, memory map, live memory- the pseudocode marks the line you're stopped on
- call a function in the running program (
call decrypt "..."), record indirect call targets as xrefs (trace) ceasta-cli dbg: the same debugger in a terminal
- binary diff: match functions between two builds and see what changed
- library signatures: name known functions in a stripped binary (
sigmake/sigapply) - a built-in MCP server: connect an AI (Claude Code, Cursor, ...) to the open binary from the AI menu, or with
ceasta-cli mcp— with ready-made prompts, and names you review before they're applied. see connect an AI - rename, comments, bookmarks, jump to address or name, xrefs, byte search, back / forward, undo / redo, and every action in one list (ctrl+shift+p)
- your work in one file, like ida's
.i64: ctrl+s writes<file>.ceastawith your names, comments, types, breakpoints and the program itself — it opens later, or on another machine, without the original. closing asks before it throws unsaved work away - trade names with other tools: export an idapython script, a ghidra script or an x64dbg database; import from x64dbg,
.mapfiles, and ida / ghidra (with the scripts inscripts/) - lua plugins and a lua console;
ceasta-clifor scripts and ci
layout
one window, nothing floating around:
- top: menu and toolbar
- left: functions
- middle: overview band, then the listing, the graph, the pseudocode, or listing and pseudocode side by side
- right: imports / exports / strings / file info / xrefs, with the debugger (registers + stack) under it while debugging
- bottom: output + lua console, hex, breakpoints — and call stack and memory while debugging
- drag the lines between panels to resize, the view menu hides panels and switches theme, ctrl + / ctrl - changes the text size
the decompiler (f5), here next to the listing (shift+f5) — a click in one moves the other:
keys
| key | what | key | what |
|---|---|---|---|
| ctrl+o | open a file (or a .ceasta) | space | listing / graph |
| g | jump to address or name | f5 / shift+f5 | pseudocode / next to the listing |
| ctrl+f | search names, imports, strings, ... | alt+b | search bytes |
| enter / double click | follow the operand | f9 | start debugging / continue |
| esc / ctrl+enter | back / forward | f7 / f8 | step into / over (n at once: the box by the step buttons) |
| n | rename (in the pseudocode too) | ctrl+f9 / shift+f7 | step out / step back |
| y | type / prototype (pseudocode) | f4 | run to cursor |
| ; | comment | f2 | breakpoint (on data: watch it) |
| x | references to here | shift+f2 | breakpoint condition |
| alt+m / ctrl+m | bookmark / bookmarks | f12 | pause |
| ctrl+z / ctrl+y | undo / redo | ctrl+s | save |
| ctrl+shift+p | every action | f1 | all shortcuts |
plugins
plugins are lua files in plugins/ (next to the program) or in your own plugins folder (%APPDATA%\ceasta\plugins, ~/.config/ceasta/plugins). they add commands to the plugins menu. five come with it: file summary, crypto finder, wrapper namer, strings report, call tracer (debugger).
ceasta.register_command("Count calls", function()
    local n = 0
    for _, fn in ipairs(ceasta.functions()) do
        n = n + #ceasta.xrefs_to(fn.addr)
    end
    ceasta.log(n .. " references to functions")
end)
the whole api is in the lua scripting guide. the output panel has a lua prompt too — try ceasta.name(ceasta.here()).
cli
ceasta-cli info file.exe            headers, security flags, hashes, sections, warnings
ceasta-cli funcs file.exe           functions
ceasta-cli disasm file.exe main 40  listing from a name or address
ceasta-cli graph file.exe start     basic blocks of a function
ceasta-cli decompile file.exe main  pseudocode for a function (--kuna: kuna's)
ceasta-cli xrefs file.exe CreateFileW
ceasta-cli find file.exe "48 8b ?? 05"
ceasta-cli search file.exe usage    find text in names, imports, strings, comments
ceasta-cli run file.exe script.lua  run a plugin / script
ceasta-cli dbg ./program [args]     interactive debugger (linux + windows)
ceasta-cli diff old.exe new.exe     match functions, show what changed
ceasta-cli sigmake libc.a lib.sig   make signatures from a file with symbols
ceasta-cli sigapply stripped lib.sig  name matching functions
ceasta-cli export file.exe --ida out.py   your names for ida (--ghidra, --x64dbg too)
ceasta-cli import file.exe names.json     names from x64dbg, a .map, ida or ghidra
ceasta-cli mcp file.exe             serve the file to an AI over MCP
--raw32 / --raw64 / --raw-arm64 (and --base <hex>) load a file as raw code.
second decompiler: kuna
kuna is a decompiler ported from ghidra's (apache-2.0). ceasta doesn't ship it — it runs kuna's command line tool when you have it:
- install kuna the way its readme says and put
kunaon your PATH, or point ceasta at it: view > second decompiler (kuna)... - the pseudocode view then has a
ceasta | kunaswitch. kuna's output is read-only and uses its own names (sub_401000,dat_404010), but its lines are linked to the listing like ceasta's, and a click onsub_...jumps there - it reads arm64 too, where ceasta's own decompiler stops
ceasta-cli decompile file main --kuna(or--kuna-path /path/to/kuna), and the AI gets adecompile_with_kunatool
connect an AI
point an AI (Claude Code, Claude Desktop, Cursor, ...) at the binary through ceasta's built-in MCP server. in the app: AI > Connect an AI..., start the server, and paste the command it shows into your client:
claude mcp add --transport http ceasta http://127.0.0.1:8744/mcp
the AI then works on what you have open — its renames and comments appear as it goes, and with the debugger allowed you watch it set breakpoints and step. without the app:
claude mcp add ceasta -- ceasta-cli mcp /path/to/target.exe
it can decompile, read xrefs, rename functions and variables, set prototypes, diff builds, and —
with the debugger allowed (--allow-debug) — set breakpoints and watchpoints, step (and step
back), read memory and even call a function in the running program. ready-made prompts
(triage, explain_function, rename_pass, find_crypto, trace_function) show up as
commands in the client, and the names it suggests wait for you in AI > Review suggested
names. the full guide, including the debugger tools and the safety notes, is in
connect an AI.
on linux
the full app is an AppImage: download ceasta-x.y.z-linux-x64.AppImage, make it executable and run it — nothing to install (ubuntu 22.04 or newer, or a distro of the same age). it needs an x11 or wayland desktop with opengl 3; file dialogs use zenity or kdialog when they're there, and you can always drop a file on the window.
chmod +x ceasta-*-linux-x64.AppImage
./ceasta-*-linux-x64.AppImage /bin/ls
if it complains about fuse, run it with --appimage-extract-and-run. the debugger is the same one as on windows (ptrace underneath); /proc/sys/kernel/yama/ptrace_scope may need to be 0 to attach to a running process.
for servers and scripts there's the command line tool, ceasta-cli-x.y.z-linux-x64.tar.gz: the analysis, disassembly, decompiler, scripting, a terminal debugger, binary diff, signatures and the mcp server. unpack and run:
tar xzf ceasta-cli-*-linux-x64.tar.gz
cd ceasta-cli-*-linux-x64

./ceasta-cli info /bin/ls                   headers, hashes, sections, warnings
./ceasta-cli decompile /bin/ls start        pseudocode for the entry point
./ceasta-cli run /bin/ls plugins/hello.lua  run a lua plugin
./ceasta-cli dbg ./program                  debug it (break, step, registers, memory)
both read elf, windows pe and mac mach-o files alike (x86, x64, arm64), so you can look at a windows exe — or an arm64 phone or server binary, or a mac app — from linux too.
the terminal debugger (dbg) is a ptrace debugger with ceasta's names, disassembly and decompiler built in:
(ceasta) b main            break at a name or address
(ceasta) c                 continue
(ceasta) ni / si           step over / into      until <addr>  run to
(ceasta) r                 registers             k  stack       x <addr>  memory
(ceasta) u                 disassemble here (with names)
(ceasta) dec               decompile the function you're stopped in
(ceasta) bt / maps         call stack / memory map
(ceasta) watch <addr>      stop when it's written (awatch: read or written)
(ceasta) back / finish     step back / step out
(ceasta) lua ...           run lua against the live process
on a mac
the app comes as ceasta-x.y.z-macos.dmg: open it and drag ceasta to Applications. one app runs on apple silicon and intel macs (macos 11 or newer). it's signed ad-hoc but not notarized by apple, so the first time macos stops it — right-click ceasta.app > Open (on macos 15 and later: System Settings > Privacy & Security > Open Anyway), or once in a terminal:
xattr -dr com.apple.quarantine /Applications/ceasta.app
the shortcuts use cmd where the others use ctrl (cmd+s, cmd+z, cmd+shift+p, ...). plugins you add go in ~/Library/Application Support/ceasta/plugins.
it reads mach-o files: programs, libraries, bundles and .o files, x86_64 and arm64 (arm64e too, apple's own). names show without the underscore mach-o puts in front (main, printf), like on the other systems. a universal file opens its x86_64 part (the decompiler reads it) and the arm64 part is one cmd+shift+p away ("part"), or --arch arm64 on the command line. the file tab shows what a mac program says about itself: the minimum macos and sdk, the libraries and rpaths, the code signature (who signed it, hardened runtime, library validation) and its entitlements, with a warning for the ones that let code in (get-task-allow, disable-library-validation, dyld environment variables, jit). to read an app, open the program inside it: the open panel goes into .app bundles (Contents/MacOS/...).
./ceasta-cli info /bin/ls                        universal, arm64e, signed by apple
./ceasta-cli funcs /bin/ls --arch arm64          the arm64 part
./ceasta-cli decompile /Applications/Foo.app/Contents/MacOS/Foo main
there's no debugger on macos yet: that needs apple's debugging interfaces and a signed, entitled build. the windows and linux builds have one, and they read mac files too.
build
everything needed is in the repo — just a compiler, nothing to fetch.
windows
- visual studio 2022: open
ceasta.sln, pickRelease | x64, build →build\msvc\Release - or cmake:
cmake -S . -B buildthencmake --build build --config Release - release files (zip + installer, needs inno setup 6):
powershell -ExecutionPolicy Bypass -File installer\package.ps1
linux (core + cli)
cmake -S . -B build && cmake --build build -j
linux gui (needs libglfw3-dev and an opengl dev package; ci packs it into the AppImage with linuxdeploy, see .github/workflows/build.yml)
cmake -S . -B build -DCEASTA_LINUX_GUI=ON && cmake --build build -j
macos (the app needs glfw: brew install glfw; without it only ceasta-cli is built)
cmake -S . -B build && cmake --build build -j # build/ceasta.app and build/ceasta-cli
ci builds glfw and ceasta for arm64 and x86_64 at once (-DCMAKE_OSX_ARCHITECTURES="arm64;x86_64") and packs the dmg, see .github/workflows/build.yml.
code
src/app.*— state, actions and the main layout;src/app_mcp.cppruns the AI server from the appsrc/ui/— one file per panel (top_bar, left_panel, ida_view, graph_view, pseudo_view, right_panel, cpu_panel, bottom_panel, status_bar, dialogs)src/widgets/— small shared bits (nav_band, splitter)src/core/— no ui: loaders (binary,pe,elf,macho),fileinfo,disasm(capstone),analysis,database,search,decompiler,protos(known api prototypes),lua_host,debugger(win32) +debugger_linux(ptrace) +dbg_stack(call stacks),mcp+mcp_transport(the AI server),diff,signatures,exchange(ida / ghidra / x64dbg),ossrc/cli/— ceasta-cli and thedbgterminal debuggerplugins/— lua plugins that ship with itscripts/—ida_to_ceasta.pyandghidra_to_ceasta.py: your names from those tools, for file > import namesdocs/— the lua guide, the changelog, third-party licenses, screenshotsinstaller/— inno setup script and packaging;packaging/linux/— the AppImage's desktop entry and icon;packaging/macos/— the app's Info.plist and icon;src/mac_platform.mm— the mac open / save panelsthird_party/— imgui, capstone (x86 and arm64), lua 5.4
license
ceasta is GPLv3. the vendored libraries keep their own (permissive) licenses — dear imgui and lua are MIT, capstone is BSD; details in docs/THIRD_PARTY_NOTICES.md.


Similar repos


Languages
C++
96.8%
disassembler, decompiler and debugger in one, with a built-in mcp server: point an ai at a binary and it can debug it, not just read it. ida-style listing, pseudocode (f5), x64dbg-style debugger (windows and linux), binary diff, lua plugins. reads pe, elf and mach-o. runs on windows, linux and macos.
See the codeSee what people are saying
README
ceasta
a disassembler, decompiler and debugger in one — for windows, linux and macos, x86, x64 and arm64
ida-style listing, a decompiler, a function graph, an x64dbg-style debugger, lua plugins, and a built-in MCP server so you can point an AI at a binary — one small program, everything vendored, nothing to install to build.
one function, three ways
ceasta shows the same code from raw bytes up to readable c, so you can drop to whatever level you need:
; assembly - the real instructions  // pseudocode (f5) - reconstructed c

checksum proc                       int checksum(int rdi)
  movzx   edx, byte ptr [rdi]       {
  test    dl, dl                        rdx = *(char*)rdi;
  je      loc_1191                      if (rdx == 0) {
  mov     eax, 0x1505                       return 0x1505;
loc_1179:                               }
  mov     ecx, eax                      rax = 0x1505;
  shl     ecx, 5                        do {
  add     eax, ecx                          rax = rax + (rax << 5) + rdx;
  add     rdi, 1                            rdi = rdi + 1;
  movzx   edx, dl                           rdx = *(char*)rdi;
  add     eax, edx                      } while (rdx != 0);
  movzx   edx, byte ptr [rdi]           return rax;
  test    dl, dl                    }
  jne     loc_1179
  ret
loc_1191:
  mov     eax, 0x1505
  ret
that's djb2 (5381 is 0x1505, and (h << 5) + h is h * 33). click a name in the pseudocode and name things as you understand them — y on the function gives it a prototype, n renames a variable:
unsigned checksum(const char* s)
{
    rdx = *(char*)s;
    if (rdx == 0) {
        return 0x1505;
    }
    h = 0x1505;
    do {
        h = h + (h << 5) + rdx;
        s = s + 1;
        rdx = *(char*)s;
    } while (rdx != 0);
    return h;
}
the decompiler is best-effort (x86 / x64, no structs yet) — great for getting a routine quickly, while the listing stays the source of truth.
download
grab it from the releases page:
| file | platform | what you get |
|---|---|---|
ceasta-x.y.z-setup.exe | windows 10/11 x64 | the full app, installs for your user (no admin), start menu + optional "open with ceasta" |
ceasta-x.y.z-windows-x64.zip | windows x64 | the full app, portable — unzip and run ceasta.exe |
ceasta-x.y.z-linux-x64.AppImage | linux x64 | the full app — chmod +x and run (on linux) |
ceasta-cli-x.y.z-linux-x64.tar.gz | linux x64 | ceasta-cli + plugins: analysis, disassembly, decompiler, scripting, terminal debugger, binary diff, signatures, and the MCP server |
ceasta-x.y.z-macos.dmg | macos 11+, apple silicon and intel | the app, no debugger yet — drag it to Applications (on a mac) |
ceasta-cli-x.y.z-macos.tar.gz | macos 11+, apple silicon and intel | ceasta-cli + plugins, everything above but the debugger |
what it does
- opens pe files (exe, dll, sys — x86, x64 and arm64), elf (x86, x64, arm64), mach-o (macos / ios programs and libraries, x86_64 and arm64, universal files too) and raw code
- auto analysis: functions (entry, exports, symbols, .pdata, unwind tables, mach-o function starts, tls callbacks, calls, pointers in data), switch tables, xrefs, strings (ascii + utf-16), imports / exports, thunks, noreturn calls
- ida-style listing: names instead of addresses, labels, xref and string comments, the arguments each instruction passes to a known api
- function graph (space): colored edges, zoom with ctrl + wheel, drag to pan
- decompiler (f5, x86 / x64): c-like pseudocode — if / else, loops, switch, stack variables, calls with their arguments (~350 known api prototypes). click a name:
nrenames it,ysets a type or a prototype. shift+f5 shows it next to the listing - a second decompiler if you want one: with kuna installed (a decompiler ported from ghidra's), the pseudocode view gets a
kunaswitch — its output for the same function, lines linked to the listing, arm64 too. more below - file info: headers, security flags (aslr, dep, cfg / pie, nx, relro, canary / hardened runtime), md5 / sha256 / imphash, section entropy, resources, version info, a mac program's code signature and entitlements, and warnings when it looks packed
- search everything (ctrl+f): functions, names, imports, exports, strings, comments and segments in one box, and the strings say where they're used
- debugger (x86 / x64, windows and linux): start or attach, breakpoints (with conditions:
rdi == 3), watchpoints on variables, step into / over / out, step back, run to cursor, pause, registers, stack, call stack, memory map, live memory- the pseudocode marks the line you're stopped on
- call a function in the running program (
call decrypt "..."), record indirect call targets as xrefs (trace) ceasta-cli dbg: the same debugger in a terminal
- binary diff: match functions between two builds and see what changed
- library signatures: name known functions in a stripped binary (
sigmake/sigapply) - a built-in MCP server: connect an AI (Claude Code, Cursor, ...) to the open binary from the AI menu, or with
ceasta-cli mcp— with ready-made prompts, and names you review before they're applied. see connect an AI - rename, comments, bookmarks, jump to address or name, xrefs, byte search, back / forward, undo / redo, and every action in one list (ctrl+shift+p)
- your work in one file, like ida's
.i64: ctrl+s writes<file>.ceastawith your names, comments, types, breakpoints and the program itself — it opens later, or on another machine, without the original. closing asks before it throws unsaved work away - trade names with other tools: export an idapython script, a ghidra script or an x64dbg database; import from x64dbg,
.mapfiles, and ida / ghidra (with the scripts inscripts/) - lua plugins and a lua console;
ceasta-clifor scripts and ci
layout
one window, nothing floating around:
- top: menu and toolbar
- left: functions
- middle: overview band, then the listing, the graph, the pseudocode, or listing and pseudocode side by side
- right: imports / exports / strings / file info / xrefs, with the debugger (registers + stack) under it while debugging
- bottom: output + lua console, hex, breakpoints — and call stack and memory while debugging
- drag the lines between panels to resize, the view menu hides panels and switches theme, ctrl + / ctrl - changes the text size
the decompiler (f5), here next to the listing (shift+f5) — a click in one moves the other:
keys
| key | what | key | what |
|---|---|---|---|
| ctrl+o | open a file (or a .ceasta) | space | listing / graph |
| g | jump to address or name | f5 / shift+f5 | pseudocode / next to the listing |
| ctrl+f | search names, imports, strings, ... | alt+b | search bytes |
| enter / double click | follow the operand | f9 | start debugging / continue |
| esc / ctrl+enter | back / forward | f7 / f8 | step into / over (n at once: the box by the step buttons) |
| n | rename (in the pseudocode too) | ctrl+f9 / shift+f7 | step out / step back |
| y | type / prototype (pseudocode) | f4 | run to cursor |
| ; | comment | f2 | breakpoint (on data: watch it) |
| x | references to here | shift+f2 | breakpoint condition |
| alt+m / ctrl+m | bookmark / bookmarks | f12 | pause |
| ctrl+z / ctrl+y | undo / redo | ctrl+s | save |
| ctrl+shift+p | every action | f1 | all shortcuts |
plugins
plugins are lua files in plugins/ (next to the program) or in your own plugins folder (%APPDATA%\ceasta\plugins, ~/.config/ceasta/plugins). they add commands to the plugins menu. five come with it: file summary, crypto finder, wrapper namer, strings report, call tracer (debugger).
ceasta.register_command("Count calls", function()
    local n = 0
    for _, fn in ipairs(ceasta.functions()) do
        n = n + #ceasta.xrefs_to(fn.addr)
    end
    ceasta.log(n .. " references to functions")
end)
the whole api is in the lua scripting guide. the output panel has a lua prompt too — try ceasta.name(ceasta.here()).
cli
ceasta-cli info file.exe            headers, security flags, hashes, sections, warnings
ceasta-cli funcs file.exe           functions
ceasta-cli disasm file.exe main 40  listing from a name or address
ceasta-cli graph file.exe start     basic blocks of a function
ceasta-cli decompile file.exe main  pseudocode for a function (--kuna: kuna's)
ceasta-cli xrefs file.exe CreateFileW
ceasta-cli find file.exe "48 8b ?? 05"
ceasta-cli search file.exe usage    find text in names, imports, strings, comments
ceasta-cli run file.exe script.lua  run a plugin / script
ceasta-cli dbg ./program [args]     interactive debugger (linux + windows)
ceasta-cli diff old.exe new.exe     match functions, show what changed
ceasta-cli sigmake libc.a lib.sig   make signatures from a file with symbols
ceasta-cli sigapply stripped lib.sig  name matching functions
ceasta-cli export file.exe --ida out.py   your names for ida (--ghidra, --x64dbg too)
ceasta-cli import file.exe names.json     names from x64dbg, a .map, ida or ghidra
ceasta-cli mcp file.exe             serve the file to an AI over MCP
--raw32 / --raw64 / --raw-arm64 (and --base <hex>) load a file as raw code.
second decompiler: kuna
kuna is a decompiler ported from ghidra's (apache-2.0). ceasta doesn't ship it — it runs kuna's command line tool when you have it:
- install kuna the way its readme says and put
kunaon your PATH, or point ceasta at it: view > second decompiler (kuna)... - the pseudocode view then has a
ceasta | kunaswitch. kuna's output is read-only and uses its own names (sub_401000,dat_404010), but its lines are linked to the listing like ceasta's, and a click onsub_...jumps there - it reads arm64 too, where ceasta's own decompiler stops
ceasta-cli decompile file main --kuna(or--kuna-path /path/to/kuna), and the AI gets adecompile_with_kunatool
connect an AI
point an AI (Claude Code, Claude Desktop, Cursor, ...) at the binary through ceasta's built-in MCP server. in the app: AI > Connect an AI..., start the server, and paste the command it shows into your client:
claude mcp add --transport http ceasta http://127.0.0.1:8744/mcp
the AI then works on what you have open — its renames and comments appear as it goes, and with the debugger allowed you watch it set breakpoints and step. without the app:
claude mcp add ceasta -- ceasta-cli mcp /path/to/target.exe
it can decompile, read xrefs, rename functions and variables, set prototypes, diff builds, and —
with the debugger allowed (--allow-debug) — set breakpoints and watchpoints, step (and step
back), read memory and even call a function in the running program. ready-made prompts
(triage, explain_function, rename_pass, find_crypto, trace_function) show up as
commands in the client, and the names it suggests wait for you in AI > Review suggested
names. the full guide, including the debugger tools and the safety notes, is in
connect an AI.
on linux
the full app is an AppImage: download ceasta-x.y.z-linux-x64.AppImage, make it executable and run it — nothing to install (ubuntu 22.04 or newer, or a distro of the same age). it needs an x11 or wayland desktop with opengl 3; file dialogs use zenity or kdialog when they're there, and you can always drop a file on the window.
chmod +x ceasta-*-linux-x64.AppImage
./ceasta-*-linux-x64.AppImage /bin/ls
if it complains about fuse, run it with --appimage-extract-and-run. the debugger is the same one as on windows (ptrace underneath); /proc/sys/kernel/yama/ptrace_scope may need to be 0 to attach to a running process.
for servers and scripts there's the command line tool, ceasta-cli-x.y.z-linux-x64.tar.gz: the analysis, disassembly, decompiler, scripting, a terminal debugger, binary diff, signatures and the mcp server. unpack and run:
tar xzf ceasta-cli-*-linux-x64.tar.gz
cd ceasta-cli-*-linux-x64

./ceasta-cli info /bin/ls                   headers, hashes, sections, warnings
./ceasta-cli decompile /bin/ls start        pseudocode for the entry point
./ceasta-cli run /bin/ls plugins/hello.lua  run a lua plugin
./ceasta-cli dbg ./program                  debug it (break, step, registers, memory)
both read elf, windows pe and mac mach-o files alike (x86, x64, arm64), so you can look at a windows exe — or an arm64 phone or server binary, or a mac app — from linux too.
the terminal debugger (dbg) is a ptrace debugger with ceasta's names, disassembly and decompiler built in:
(ceasta) b main            break at a name or address
(ceasta) c                 continue
(ceasta) ni / si           step over / into      until <addr>  run to
(ceasta) r                 registers             k  stack       x <addr>  memory
(ceasta) u                 disassemble here (with names)
(ceasta) dec               decompile the function you're stopped in
(ceasta) bt / maps         call stack / memory map
(ceasta) watch <addr>      stop when it's written (awatch: read or written)
(ceasta) back / finish     step back / step out
(ceasta) lua ...           run lua against the live process
on a mac
the app comes as ceasta-x.y.z-macos.dmg: open it and drag ceasta to Applications. one app runs on apple silicon and intel macs (macos 11 or newer). it's signed ad-hoc but not notarized by apple, so the first time macos stops it — right-click ceasta.app > Open (on macos 15 and later: System Settings > Privacy & Security > Open Anyway), or once in a terminal:
xattr -dr com.apple.quarantine /Applications/ceasta.app
the shortcuts use cmd where the others use ctrl (cmd+s, cmd+z, cmd+shift+p, ...). plugins you add go in ~/Library/Application Support/ceasta/plugins.
it reads mach-o files: programs, libraries, bundles and .o files, x86_64 and arm64 (arm64e too, apple's own). names show without the underscore mach-o puts in front (main, printf), like on the other systems. a universal file opens its x86_64 part (the decompiler reads it) and the arm64 part is one cmd+shift+p away ("part"), or --arch arm64 on the command line. the file tab shows what a mac program says about itself: the minimum macos and sdk, the libraries and rpaths, the code signature (who signed it, hardened runtime, library validation) and its entitlements, with a warning for the ones that let code in (get-task-allow, disable-library-validation, dyld environment variables, jit). to read an app, open the program inside it: the open panel goes into .app bundles (Contents/MacOS/...).
./ceasta-cli info /bin/ls                        universal, arm64e, signed by apple
./ceasta-cli funcs /bin/ls --arch arm64          the arm64 part
./ceasta-cli decompile /Applications/Foo.app/Contents/MacOS/Foo main
there's no debugger on macos yet: that needs apple's debugging interfaces and a signed, entitled build. the windows and linux builds have one, and they read mac files too.
build
everything needed is in the repo — just a compiler, nothing to fetch.
windows
- visual studio 2022: open
ceasta.sln, pickRelease | x64, build →build\msvc\Release - or cmake:
cmake -S . -B buildthencmake --build build --config Release - release files (zip + installer, needs inno setup 6):
powershell -ExecutionPolicy Bypass -File installer\package.ps1
linux (core + cli)
cmake -S . -B build && cmake --build build -j
linux gui (needs libglfw3-dev and an opengl dev package; ci packs it into the AppImage with linuxdeploy, see .github/workflows/build.yml)
cmake -S . -B build -DCEASTA_LINUX_GUI=ON && cmake --build build -j
macos (the app needs glfw: brew install glfw; without it only ceasta-cli is built)
cmake -S . -B build && cmake --build build -j # build/ceasta.app and build/ceasta-cli
ci builds glfw and ceasta for arm64 and x86_64 at once (-DCMAKE_OSX_ARCHITECTURES="arm64;x86_64") and packs the dmg, see .github/workflows/build.yml.
code
src/app.*— state, actions and the main layout;src/app_mcp.cppruns the AI server from the appsrc/ui/— one file per panel (top_bar, left_panel, ida_view, graph_view, pseudo_view, right_panel, cpu_panel, bottom_panel, status_bar, dialogs)src/widgets/— small shared bits (nav_band, splitter)src/core/— no ui: loaders (binary,pe,elf,macho),fileinfo,disasm(capstone),analysis,database,search,decompiler,protos(known api prototypes),lua_host,debugger(win32) +debugger_linux(ptrace) +dbg_stack(call stacks),mcp+mcp_transport(the AI server),diff,signatures,exchange(ida / ghidra / x64dbg),ossrc/cli/— ceasta-cli and thedbgterminal debuggerplugins/— lua plugins that ship with itscripts/—ida_to_ceasta.pyandghidra_to_ceasta.py: your names from those tools, for file > import namesdocs/— the lua guide, the changelog, third-party licenses, screenshotsinstaller/— inno setup script and packaging;packaging/linux/— the AppImage's desktop entry and icon;packaging/macos/— the app's Info.plist and icon;src/mac_platform.mm— the mac open / save panelsthird_party/— imgui, capstone (x86 and arm64), lua 5.4
license
ceasta is GPLv3. the vendored libraries keep their own (permissive) licenses — dear imgui and lua are MIT, capstone is BSD; details in docs/THIRD_PARTY_NOTICES.md.
Similar repos
Languages
C++
96.8%