A user-friendly python package for computing and plotting machine learning explainability output.
Jupyter Notebook
43
382 commits
updated Apr 2, 2026


A user-friendly Python module for tabular machine learning explainability. For a comprehensive tutorial, see Flora et al. (2024).
These methods are discussed in Christoph Molnar's Interpretable Machine Learning. A primary feature of scikit-explain is the built-in plotting methods, designed to be easy to use while producing publication-quality figures. Documentation is available at Read the Docs.
pip (PyPI):
pip install scikit-explain
conda (conda-forge):
conda install -c conda-forge scikit-explain
Development version (most up-to-date):
git clone https://github.com/monte-flora/scikit-explain.git
cd scikit-explain
pip install -e .
scikit-explain is compatible with Python 3.8 or newer and requires:
numpy, scipy, pandas, scikit-learn, matplotlib, shap>=0.30.0,
xarray>=0.16.0, tqdm, statsmodels, seaborn>=0.11.0
import skexplain

# Load pre-trained models and data
estimators = skexplain.load_models()
X, y = skexplain.load_data()

# Create the explainer
explainer = skexplain.ExplainToolkit(estimators=estimators, X=X, y=y)

# Configure plot display settings once (optional)
explainer.set_plotting_config(
    display_feature_names={"sfc_temp": "$T_{sfc}$", "temp2m": "$T_{2m}$"},
    display_units={"sfc_temp": "$^\\circ$C", "temp2m": "$^\\circ$C"},
)
perm_results = explainer.permutation_importance(n_vars=10, evaluation_fn='norm_aupdc')
explainer.plot_importance(data=perm_results, panels=[('multipass', 'Random Forest')])

important_vars = explainer.get_important_vars(perm_results, multipass=True, nvars=7)
ale = explainer.ale(features=important_vars, n_bins=20)
explainer.plot_ale(ale=ale)

import shap

single_example = X.iloc[[0]]
explainer = skexplain.ExplainToolkit(estimators=estimators, X=single_example)

shap_kws = {
    'masker': shap.maskers.Partition(X, max_samples=100, clustering="correlation"),
    'algorithm': 'auto',
}
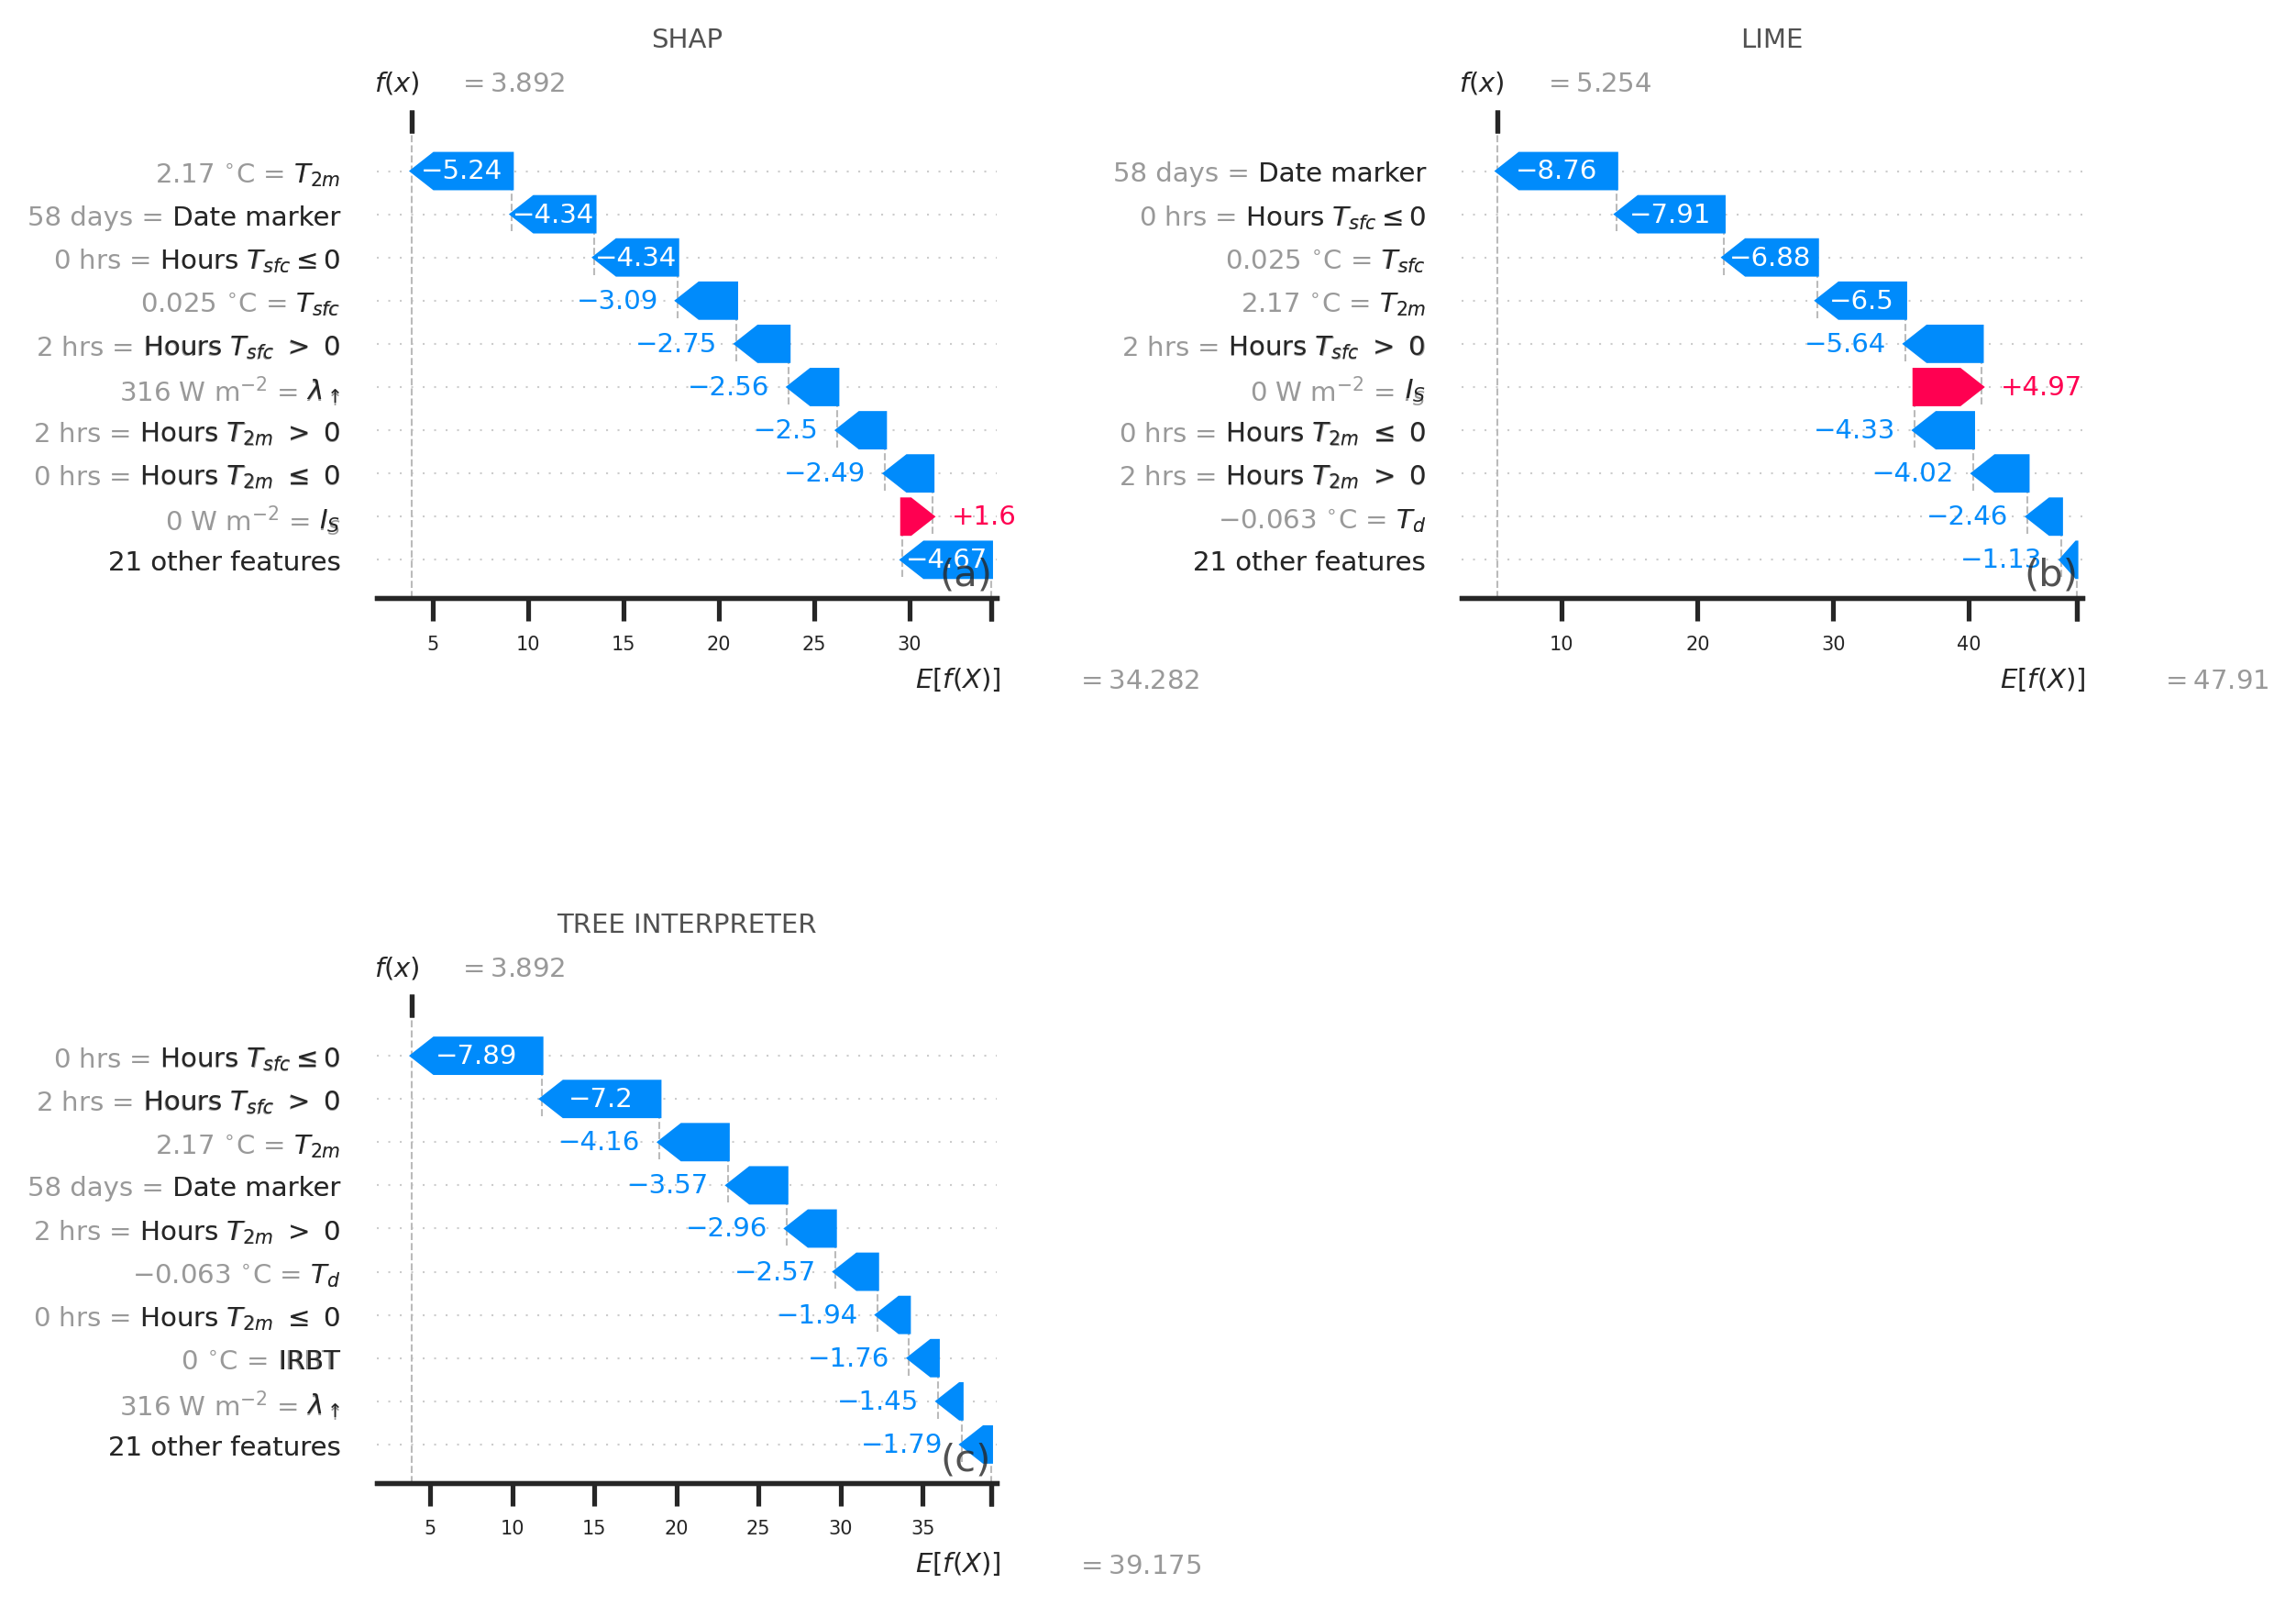
attr_results = explainer.local_attributions(
    method=['shap', 'lime', 'tree_interpreter'],
    shap_kws=shap_kws,
)
explainer.plot_contributions(attr_results)
| Notebook | Description |
|---|---|
| 01 Quickstart | Minimal workflow from model to explanation |
| 02 Permutation Importance | Single/multi-pass permutation importance |
| 03 Grouped Importance | Grouped PI and comparing ranking methods |
| 04 ALE | 1D Accumulated Local Effects |
| 05 Partial Dependence | 1D Partial Dependence |
| 06 ICE Curves | Individual Conditional Expectations |
| 07 2D Effects | 2D ALE and Partial Dependence |
| 08 Local Attributions | SHAP, LIME, and TreeInterpreter |
| 09 SHAP Plots | Summary and dependence plots |
| 10 Interactions | H-statistic, IAS, MEC, Sobol indices |
| 11 Multiclass | Multiclass classification support |
| 12 Plot Configuration | Customizing plots with PlotConfig |
If you use scikit-explain in your research, please cite:
@article{Flora_2024,
  author  = {Flora, Montgomery L. and McGovern, Amy and Handler, Shawn},
  title   = {A Machine Learning Explainability Tutorial for Atmospheric Sciences},
  journal = {Artificial Intelligence for the Earth Systems},
  volume  = {3},
  number  = {1},
  pages   = {e230018},
  year    = {2024},
  doi     = {10.1175/AIES-D-23-0018.1},
}
This package includes adapted code from: PyALE, PermutationImportance, ALEPython, SHAP, scikit-learn, LIME, Faster-LIME, treeinterpreter
BSD license.
Overall
Maintained
Code review
PyPI
Latest release
Releases this year
A user-friendly python package for computing and plotting machine learning explainability output.
Jupyter Notebook
43
382 commits
updated Apr 2, 2026
A user-friendly Python module for tabular machine learning explainability. For a comprehensive tutorial, see Flora et al. (2024).
These methods are discussed in Christoph Molnar's Interpretable Machine Learning. A primary feature of scikit-explain is the built-in plotting methods, designed to be easy to use while producing publication-quality figures. Documentation is available at Read the Docs.
pip (PyPI):
pip install scikit-explain
conda (conda-forge):
conda install -c conda-forge scikit-explain
Development version (most up-to-date):
git clone https://github.com/monte-flora/scikit-explain.git
cd scikit-explain
pip install -e .
scikit-explain is compatible with Python 3.8 or newer and requires:
numpy, scipy, pandas, scikit-learn, matplotlib, shap>=0.30.0,
xarray>=0.16.0, tqdm, statsmodels, seaborn>=0.11.0
import skexplain

# Load pre-trained models and data
estimators = skexplain.load_models()
X, y = skexplain.load_data()

# Create the explainer
explainer = skexplain.ExplainToolkit(estimators=estimators, X=X, y=y)

# Configure plot display settings once (optional)
explainer.set_plotting_config(
    display_feature_names={"sfc_temp": "$T_{sfc}$", "temp2m": "$T_{2m}$"},
    display_units={"sfc_temp": "$^\\circ$C", "temp2m": "$^\\circ$C"},
)
perm_results = explainer.permutation_importance(n_vars=10, evaluation_fn='norm_aupdc')
explainer.plot_importance(data=perm_results, panels=[('multipass', 'Random Forest')])
important_vars = explainer.get_important_vars(perm_results, multipass=True, nvars=7)
ale = explainer.ale(features=important_vars, n_bins=20)
explainer.plot_ale(ale=ale)
import shap

single_example = X.iloc[[0]]
explainer = skexplain.ExplainToolkit(estimators=estimators, X=single_example)

shap_kws = {
    'masker': shap.maskers.Partition(X, max_samples=100, clustering="correlation"),
    'algorithm': 'auto',
}
attr_results = explainer.local_attributions(
    method=['shap', 'lime', 'tree_interpreter'],
    shap_kws=shap_kws,
)
explainer.plot_contributions(attr_results)
| Notebook | Description |
|---|---|
| 01 Quickstart | Minimal workflow from model to explanation |
| 02 Permutation Importance | Single/multi-pass permutation importance |
| 03 Grouped Importance | Grouped PI and comparing ranking methods |
| 04 ALE | 1D Accumulated Local Effects |
| 05 Partial Dependence | 1D Partial Dependence |
| 06 ICE Curves | Individual Conditional Expectations |
| 07 2D Effects | 2D ALE and Partial Dependence |
| 08 Local Attributions | SHAP, LIME, and TreeInterpreter |
| 09 SHAP Plots | Summary and dependence plots |
| 10 Interactions | H-statistic, IAS, MEC, Sobol indices |
| 11 Multiclass | Multiclass classification support |
| 12 Plot Configuration | Customizing plots with PlotConfig |
If you use scikit-explain in your research, please cite:
@article{Flora_2024,
  author  = {Flora, Montgomery L. and McGovern, Amy and Handler, Shawn},
  title   = {A Machine Learning Explainability Tutorial for Atmospheric Sciences},
  journal = {Artificial Intelligence for the Earth Systems},
  volume  = {3},
  number  = {1},
  pages   = {e230018},
  year    = {2024},
  doi     = {10.1175/AIES-D-23-0018.1},
}
This package includes adapted code from: PyALE, PermutationImportance, ALEPython, SHAP, scikit-learn, LIME, Faster-LIME, treeinterpreter
BSD license.
Overall
Maintained
Code review
PyPI
Latest release
Releases this year



