
See what people are saying
README
Qwen3.8-Flash-Next on one RTX PRO 6000
YouTube
LOCAL AI SERIES:
- NEW: Qwen3.8 Flash: Over 7x Faster First Token | llama.cpp vs SGLang vs FreeToken. Benchmarked! https://youtu.be/RlsxXB5q-cA
- Why Qwen3 8 Flash Is So Cheap to Run 0 to 96GB VRAM Explained and Tested! https://youtu.be/L4XyWM6IrBc
- DeepSeek V4 Flash 284B on a single RTX 6000 PRO with DSpark https://youtu.be/EDls1Popv1o
- Fastest Qwen 3.8 27B in Llama.cpp? DFlash 2 + n-gram Explained & Benchmarked! https://youtu.be/RBlRTUwJMI4
- Up to 8x Faster AI N-gram Explained, Deployed & Benchmarked on Qwen 3.6 27B llama.cpp! https://youtu.be/zNUoHONUHGk
- Up to 6x Faster AI? DFlash Explained, Deployed & Benchmarked on Qwen 3.6 27B llama.cpp! https://www.youtube.com/watch?v=TUdihA_dJjo
Qwen3.8-Flash-Next (125B MoE, 6B active) on a single RTX PRO 6000 with 96 GB of system RAM, in llama.cpp. 51.2B of its 176.94B parameters are a lookup table, not matrix-multiply weights. Put that table in system RAM and the model runs on an 8 GB card — or on no GPU at all.
Short answers: putting the lookup table on the GPU instead is 55.6× slower
to decode. The largest free speed lever is not the card, it is
--load-mode none, worth 1.87× prefill at identical tensor placement. The
model reaches 36 tok/s on an 8 GB card and 8.5 tok/s with no GPU. A
larger microbatch buys +30.8% prefill for about 1 GiB of VRAM.
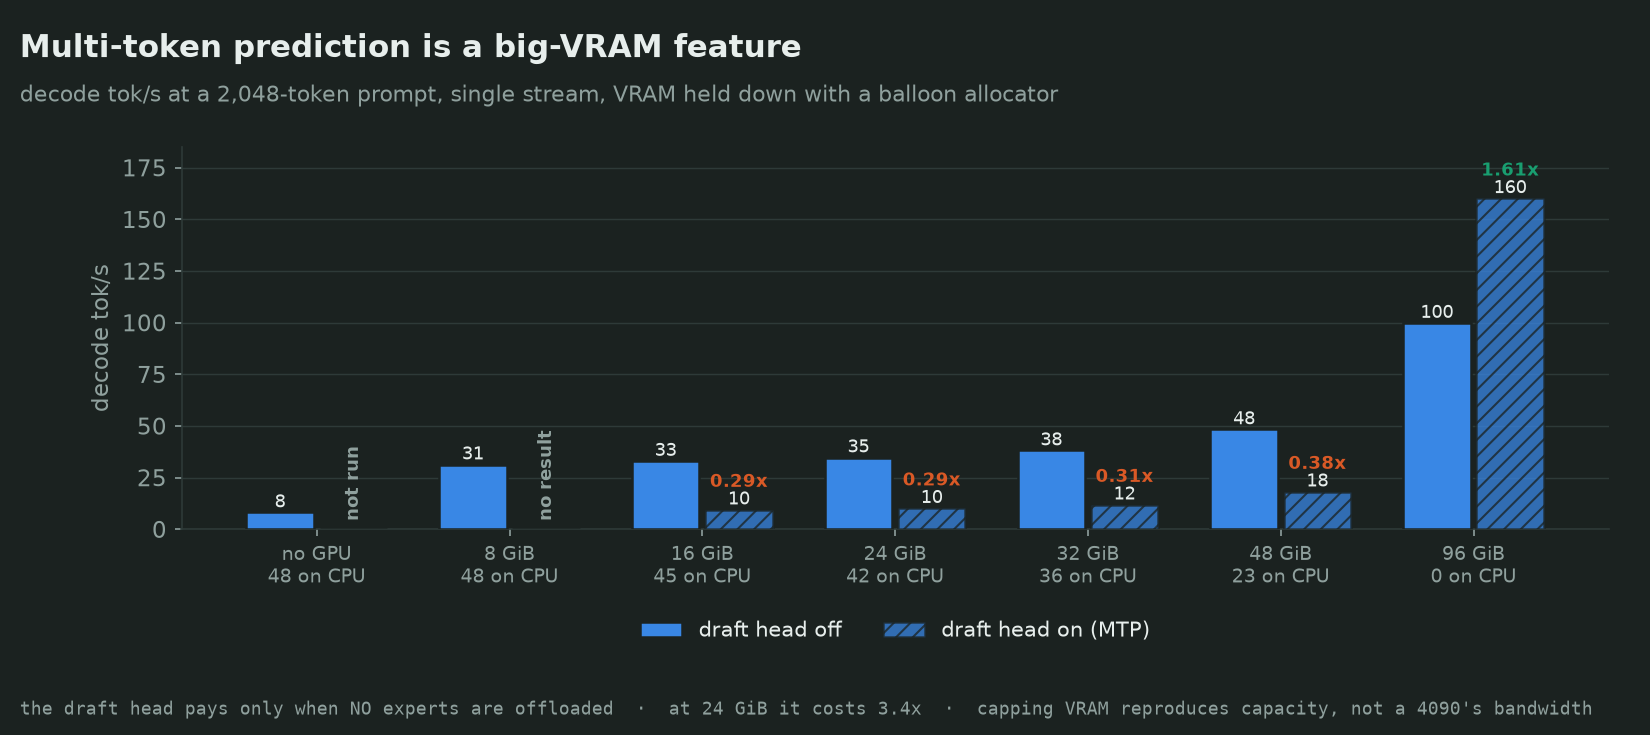
Answering a viewer: an RTX 4090, 24 GB VRAM, 64 GB system RAM.
- Does it run? Yes — about 34 tok/s. Verified in a container hard-capped at 64 GB, and again at 56 GB to leave room for an OS: 34.4 and 34.7 tok/s, the same speed this box gets at that VRAM tier with all 91 GiB.
- Should you turn on MTP? No. On a 24 GB card the draft head is 3.4× slower (10.2 vs 34.7 tok/s). Its advertised 1.3–1.7× is real, but only when every expert is on the GPU — at 96 GiB it is 1.61×. Putting the head on the CPU does not help.
- The flags that matter, on top of the usual ones:
--n-cpu-moe 42                    # 42 of 48 expert layers on the CPU
-ot per_layer_token_embd=CPU      # the 27 GiB lookup table stays off the GPU
--load-mode mmap
--lazy-mode on                    # read that table from SSD; server sits at ~3 GiB
-ub 512
Without --lazy-mode on it still runs at the same speed, but streams the model off
the disk continuously to stay under the limit — 611 MB/s, all run long.
The chart below is the original ladder, kept for reference. It ran on this box's 91 GiB of host RAM, which the chart itself never stated — the new one above is the version with the RAM budget tested rather than assumed.
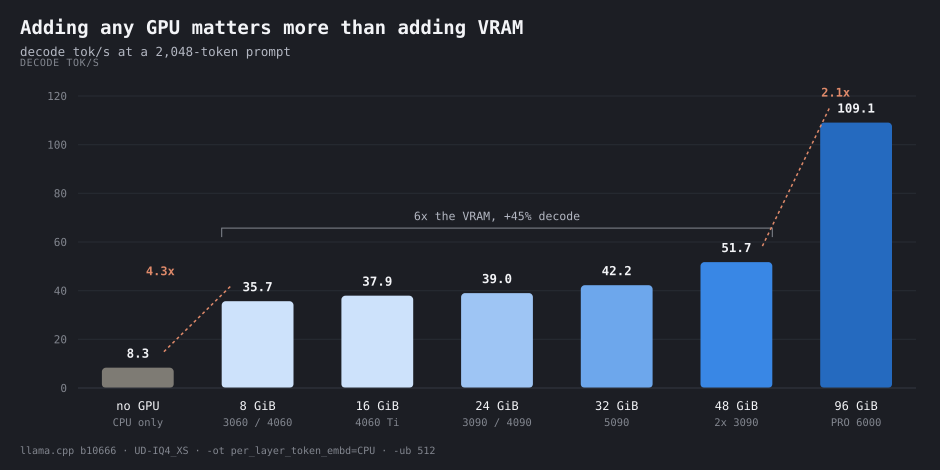
The full write-up, with a diagram per result and every limit stated, is
report.html — open it in a browser.
We discuss it here: Reddit thread
Third report: the official SGLang image, and seven tests speed cannot show
qwen38-flash-next-official-sglang-report.pdf —
the official lmsysorg/sglang:dev-qwen38-next-local recipe against our build (first token,
prefill, decode, cold vs cached), then the model at work: tool calling (BFCL, τ²-bench
telecom), a needle in 262K tokens, an army-building game against reference armies and
against Claude and GPT, an SVG it drew and judged with its own eyes, an animated board in
the channel's design system, and a raw video take it cut from a transcript it made itself.
Every number is generated from a saved run. The test harness behind it is private while it
is still changing; the report is not.
Second report: three engines, one card
The first report above is one engine. engine_benchmark_report.html
is the follow-up: the same model on the same card served three ways — llama.cpp,
SGLang and FreeToken — plus everything measured since. Open it in a browser; it is
one self-contained file with every chart embedded.
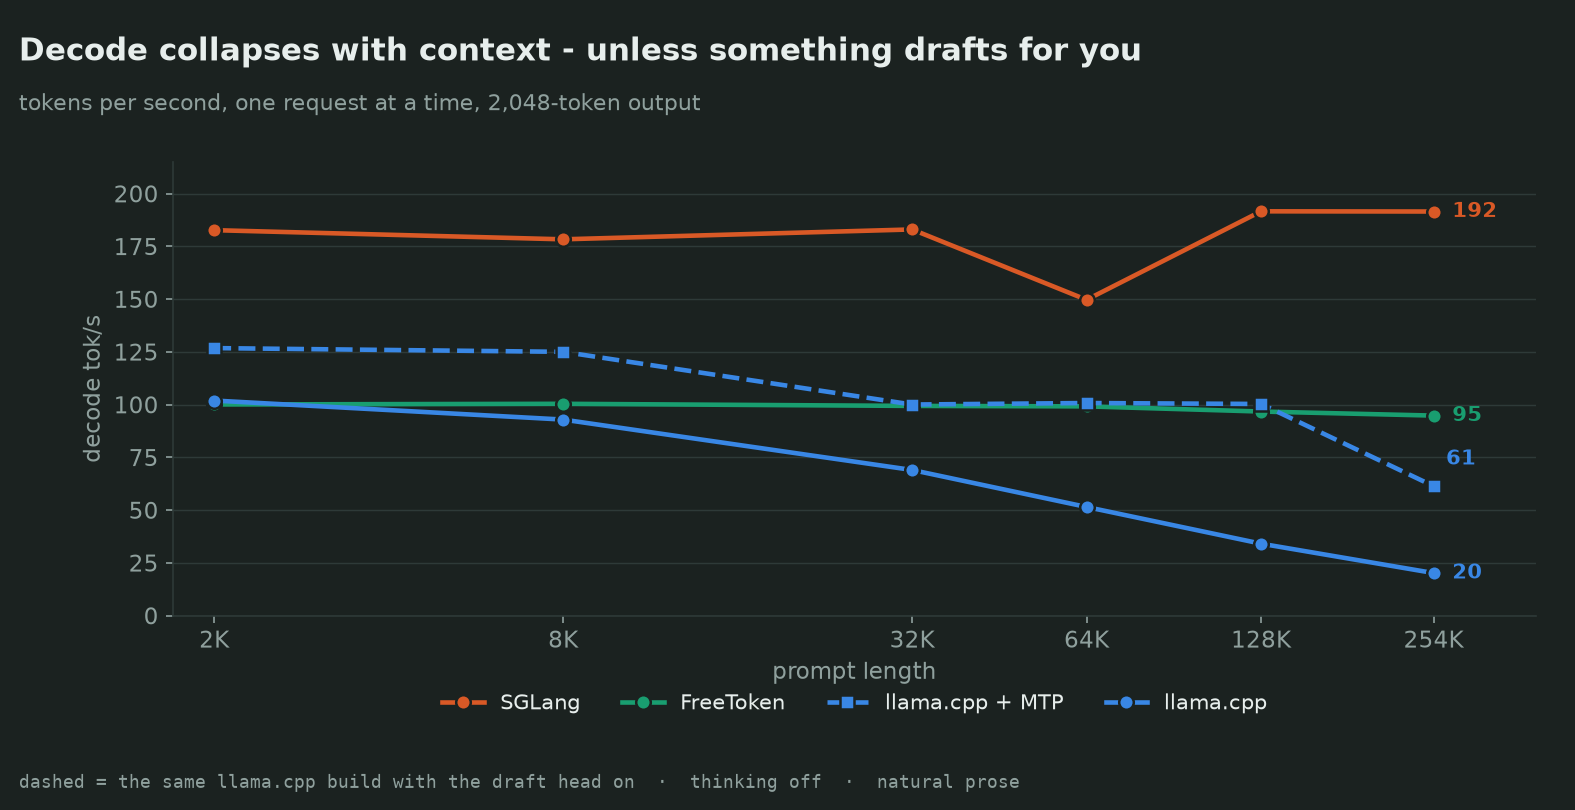
What it measures, and what came out:
- Speed against context, 2K to 262K. Three different shapes, not three speeds. SGLang holds ~180 tok/s decode; FreeToken is almost flat; llama.cpp collapses 3× across the ladder. Prefill spreads 7.3× at the full window.
- Accuracy. GSM8K (1,319 problems) and MATH-500, exact match, no LLM judge. All four arms land within eight-tenths of a point, and nine paired tests come back null. Which stack you pick changes how long you wait, not what you get back.
- Multi-token prediction, working for the first time. The checkpoint ships its own draft head; llama.cpp could not load it until a fork build. It is worth 1.63× at 8K, 1.69× at 32K and 2.6× at the full window, and it changes the shape of the curve rather than just lifting it. Accuracy with it on: 95.75% against 95.60%, paired p = 0.87.
- Why
--load-mode noneand notmlock— a viewer's question from the last video, answered with all five modes measured. They are the same within 4%. - GPU temperature, power and energy. Nothing ever throttled; peak 82 °C with 12 °C of headroom. The interesting number is energy per request: 8.9× between the fastest and slowest stack, because a GPU draws its working power whatever it is doing and the only lever is finishing sooner.
- Startup cost, which nobody publishes and which ranks the engines backwards:
llama.cpp answers in 16 s, SGLang 108 s, FreeToken 126 s — and FreeToken's
/healthreturns 200 79 seconds before it can serve. - Resizing the KV cache on a running server (FreeToken): ~1 s against 82 s to restart, and the pool turns out to be a wall, not a slope.
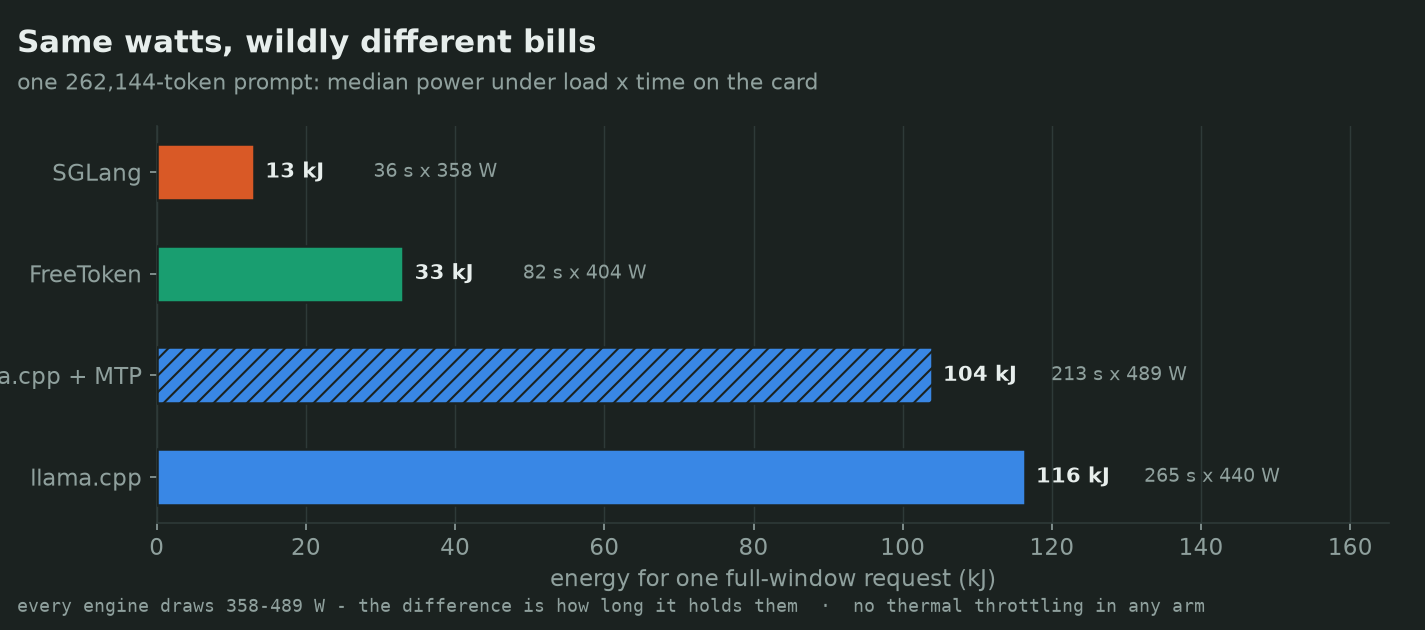
Every number in that report is generated from saved evidence by
bench/report_data.py — nothing is typed in by hand. The runs it reads are in
artifacts/, with the void ones listed and explained.
Update: the official SGLang image, and a viewer who was right
A viewer said the SGLang arm was "missing a ton of speed optimizations" and
"using your SSD for engrams." Both were tested. His fork's launch flags do not
transfer to our build — 22 of 23 exist, one hangs, the rest are inside noise
(results/BLOCKERS.md B-27 to B-30). But his mechanism was right: the
47.68 GiB lookup table was streaming from NVMe because nothing that pinned it
in host RAM had ever booted on 91 GiB. The September SGLang cookbook's
RTX PRO 6000 recipe
(single node, NVFP4, low-latency, PLE offload on) on
lmsysorg/sglang:dev-qwen38-next-local does boot with the table pinned — at
the 86 GB container cap, with nothing to spare — and this is what it changes:
The cookbook page carries two recipes for this card. The one measured here
is the first, for RadixArk/Qwen3.8-Flash-Next-NVFP4 — the same checkpoint
every SGLang number in this repo uses, so the comparison is image-against-image.
The second, for nvidia/Qwen3.8-Flash-Next-NVFP4 (NVIDIA's own mixed-precision
export, which needs this image's loader and reports a ~170k-token pool at 16
slots against RadixArk's ~78k), is in bench/sglang_recipe_compare.py as the
nvidia_context1 arm and has not been run yet — it is a 133 GB download.
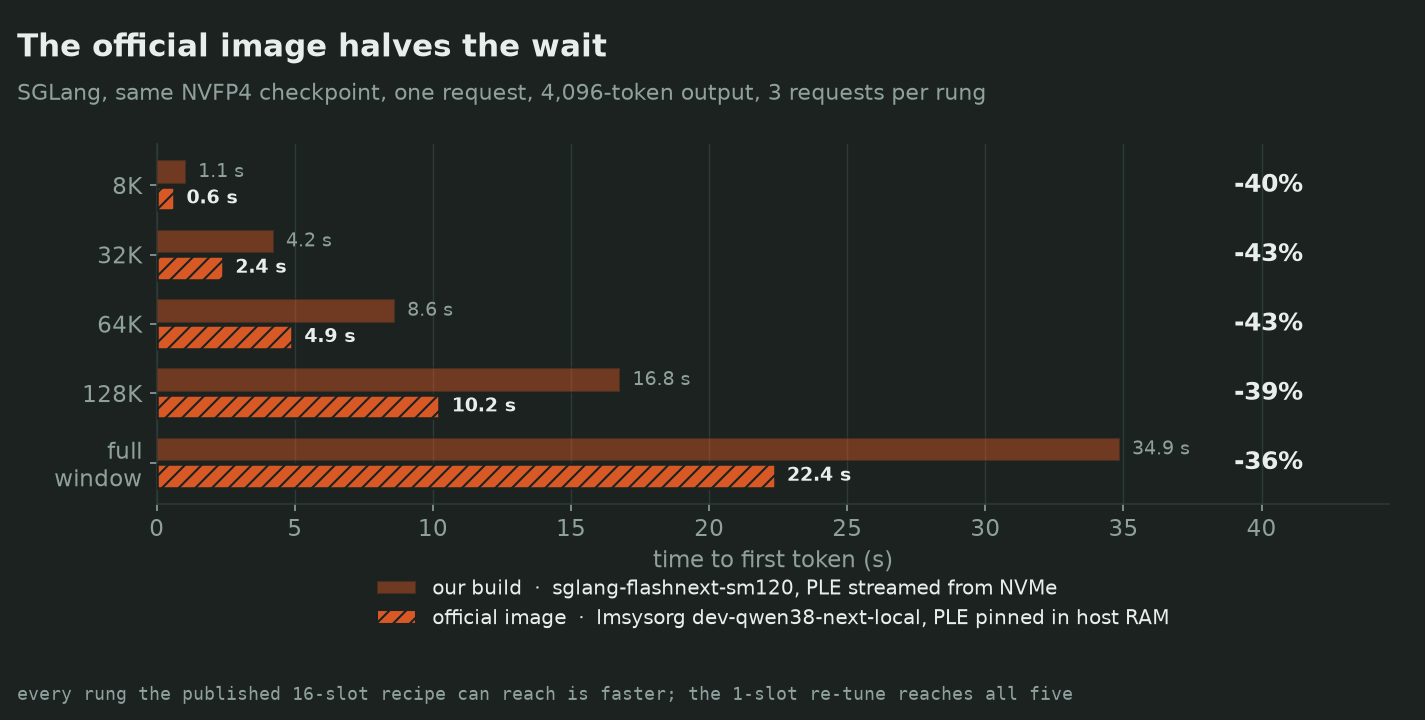
| ISL | TTFT ours → official | prefill ours → official | decode ours → official |
|---|---|---|---|
| 8K | 1.1 s → 0.6 s | 7,768 → 12,997 (+67%) | 175 → 199 |
| 32K | 4.2 s → 2.4 s | 7,742 → 13,662 (+76%) | 227 → 238 |
| 64K | 8.6 s → 4.9 s | 7,602 → 13,381 (+76%) | 181 → 200 |
| 128K | 16.8 s → 10.2 s | 7,811 → 12,806 (+64%) | 222 → 242 |
| full window | 34.8 s → 22.4 s | 7,284 → 11,352 (+56%) | 186 → 217 |
Same checkpoint, same 4,096-token output, three requests per rung, no thermal or memory void. Prefill is 1.6–1.8× faster at every length; the full-window first token arrives 12 seconds sooner. Decode is higher at all five rungs but inside the ~15% request-to-request spread three requests can resolve, so no figure is claimed for it.
Three things to know before running it (docker/best.sglang-official.yaml):
-
The published recipe cannot serve the full window. Its default 16 slots leave a 76,224-token pool; 128K and above are refused. The compose file drops it to one slot (pool 268,096) and sets
--max-mamba-cache-size 5— scaling the recipe's 48 linearly gives 3, and NEXTN needs five states per request on this model, so 3 boots and then deadlocks on the first request. -
It is not one flag. Every parameter that differs, read from both servers' resolved arguments, with what each does and what is known about its effect:
parameter ours official what it does known effect PLE table placement streamed from NVMe ( io_uring, queue depth 512)--ple-offload-embedding: pinned in host RAMThe 47.68 GiB per-layer embedding table — 128 tensors, 320M FP8 rows — gathered at every layer for every token. Cannot fit in VRAM beside the model. Likely the largest term. Prefill gathers rows for every prompt token, and the gain is largest exactly where prompts are long. Not isolated: the two images are their PLE strategies. KV cache dtype fp8_e4m3auto→ bf16Precision of the attention K/V cache on the QSA layers. The official image runs higher precision and is still faster. KV on this model is small — most layers are linear-attention with no KV — so fp8 saved only 1.5 GB per side at 262K, for an unverified quality cost. CUDA graphs decode breakable, prefilldisableddefaults: captures draft decode, draft extend, target verify Replays a recorded kernel sequence instead of launching kernels one by one. The official image graphs the whole speculative loop; ours disables prefill graphs. A real decode/verify lever. SGLang build Aug 17 base + yepapa-nest overlay + 3 PRs lmsysorg Sep 7 ( 4ccff141)Three weeks of upstream work. Unknown share. Both run the hybrid-GDN path on Triton — the FlashInfer GDN promotion fires on neither. FP4 GEMM flashinfer_cudnnflashinfer_cutlassKernel library for the NVFP4 matmuls. Prefill is GEMM-bound. Plausible prefill contributor. Untested alone. SSM state dtype fp32 bfloat16Precision of the linear-attention recurrent state. Measured on our image: halves the state, frees 756 MiB, no speed change. chunked prefill 8192 4096 Prompt processed in chunks of N tokens. Normally slightly slower per token. Contribution unknown. mem-fraction-static 0.93 0.96 Share of VRAM for weights + KV. Needed for their bf16 KV; pool 268,096 vs 262,144. mamba radix strategy extra_bufferextra_buffer_lazyHow recurrent state is snapshotted for prefix reuse. Irrelevant here: every request is cache-busted. env — PYTORCH_CUDA_ALLOC_CONF=expandable_segments:True,SGLANG_OPT_MAMBA_SKIP_DECODE_LOCK=1Allocator hint; skips a lock in mamba decode. expandable_segmentsmeasured +1.7% on our image (noise). The lock skip is untested.Unchanged between the two: checkpoint and snapshot,
attention_backend=flashinfer,moe_runner_backend=flashinfer_cutlass(ours auto-resolves to it), NEXTN 3/1/4, page size 64, mamba track interval 64, context 262,144, 1 slot, 5 mamba states, no HiCache. By mechanism, the ranking would be PLE-in-RAM first, CUDA graphs on the speculative path second, cutlass GEMM third — that is reasoning, not measurement. -
The full-window chart above still shows 126.9 decode for SGLang, and that number measured the acceptance ramp. With a 128-token answer after a 35-second prefill, NEXTN has not warmed into the text; the same server and sampler at 4,096 tokens decode at 155–178 (B-31). The bar is kept because the other three bars are the same kind of measurement. Prefill and TTFT are unaffected and reproduce to 2.5%.
The configuration that won, per engine
Every number below is the configuration its own artifact recorded, not a recommendation reconstructed afterwards. One compose file per engine, all of it driven by environment variables, so a configuration is a set of variables.
| Engine | Decode / prefill at 32K | The settings that made it |
|---|---|---|
| SGLang, official image — fastest to first token | 13,662 prefill vs 7,742 for our build on the same run (different workload from the rows below: greedy, 4,096-token output) | docker/best.sglang-official.yaml: lmsysorg/sglang:dev-qwen38-next-local, PLE pinned in host RAM, 1 slot, --max-mamba-cache-size 5, flashinfer_cutlass, bf16 SSM state. Needs 86 GB host RAM and nothing else running |
| SGLang — our build, NVMe PLE | 183 / 8,088 tok/s | NVFP4, ENGINE_CTX=262144, MEM_FRACTION=0.90, PREFILL_BUDGET=8192, KV fp8_e4m3, NEXTN speculation on. ~30 GB less host RAM than the row above |
| llama.cpp + MTP — fastest llama.cpp | 160 tok/s at 2K (1.61× over the same build without it) | LLAMA_IMAGE=llamacpp-mtp:d1a92352, SPEC_TYPE=draft-mtp, SPEC_DRAFT_N_MAX=5, SPEC_DRAFT_NGL=99, and --n-cpu-moe 0 |
| FreeToken | 99 / 3,026 tok/s | NVFP4, --moe-backend offload and --ple-backend disk together |
| llama.cpp (stock image) | 69 / 1,859 tok/s | LOAD_MODE=none, -ot per_layer_token_embd=CPU, UBATCH=1024, -ngl 999, --n-cpu-moe 0 |
One departure, deliberately: docker/best.sglang.yaml sets
--mem-fraction-static to 0.93, not the 0.90 the artifact above recorded. A
later boot probe found 0.90 sizes the KV pool at 166,720 tokens — 36% short of
the window — while 0.93 reaches the full 262,144 for +1.3 GB of VRAM, with NEXTN
kept. The table records what was measured; the compose file is what is worth
running.
Four settings carry most of the difference, and each is a measured pair:
-ot per_layer_token_embd=CPU— the 27 GiB lookup table on the CPU. On the GPU instead: 55.6× slower to decode. This one setting is why the model fits.--moe-backend offload+--ple-backend disk(FreeToken) — neither alone fits. Experts 63.32 GiB + pinned table 47.68 GiB = 111 GiB on a 91 GiB box; streaming the table from NVMe leaves 63.32 GiB, which fits.UBATCH=1024(llama.cpp) — +8.8% prefill over 512. 2048 is no better.SPEC_TYPE=draft-mtp— 1.61× decode, but only at--n-cpu-moe 0. With any expert offload it is a 0.29–0.38× loss. See the chart at the top.
On a 24 GB card, the answer is different: --n-cpu-moe 42,
-ot per_layer_token_embd=CPU, --load-mode mmap, --lazy-mode on, -ub 512,
and MTP off. That runs at ~34 tok/s in 64 GB of system RAM.
Run any of them with one command
Each row above is a compose file with every value already in it — no env file, no override, no wrapper script. The file is the answer to "what flags did you run":
docker compose -f docker/best.sglang.yaml        up -d   # fastest overall
docker compose -f docker/best.llamacpp-mtp.yaml  up -d   # fastest llama.cpp
docker compose -f docker/best.freetoken.yaml     up -d
docker compose -f docker/best.llamacpp.yaml      up -d   # the stock-image baseline
docker compose -f docker/best.llamacpp-24gb.yaml up -d   # 3090 / 4090, 64 GB RAM

docker compose -f docker/best.sglang.yaml down           # stop it
They are standalone, not overrides — do not stack them with -f on the base
compose files. Each has its own project name, container name and port, so two
can run side by side.
| File | Port | Image |
|---|---|---|
best.sglang.yaml | 8001 | sglang-flashnext-sm120:local — must exist already, see below |
best.llamacpp-mtp.yaml | 8000 | built on first up from the pinned fork commit |
best.freetoken.yaml | 8002 | built on first up from docker/freetoken.Dockerfile |
best.llamacpp.yaml | 8000 | ghcr.io/ggml-org/llama.cpp:server-cuda13, pulled |
best.llamacpp-24gb.yaml | 8000 | ghcr.io/ggml-org/llama.cpp:server-cuda13, pulled |
There is no separate build step. Four of the five carry a build: block or a
registry tag, so up produces the image if the machine does not have it and
reuses it if it does. The llama.cpp fork builds straight from its git ref —
BuildKit clones the pinned commit itself, no source tree to fetch. Both builds
are CUDA compiles and take a while the first time; --build forces a rebuild
afterwards.
best.sglang.yaml is the exception and cannot be fixed here: that image is a
three-commit overlay plus a local patch that this repo does not yet carry a
recipe for (PLAN_SGLANG.md records the commits and says so). For anyone but this
machine that file is the flag list, not a working command.
The model paths are written out in full and pinned to a snapshot commit, which
is what lets these files skip the glob a script would need. If Unsloth
re-uploads, a path goes stale and each file's header carries the ls that finds
the current one.
Reproduce the second report
uv sync                                  # pinned by pyproject.toml + uv.lock
./scripts/download_models.sh             # weights, resumable and sha256-verified

# one engine, one workload, fully recorded (plan gate: prints its plan without --execute)
./bench/run.sh --execute --plan-id FLASHNEXT-R1 llamacpp fn_code_tune
./bench/run.sh --execute --plan-id FLASHNEXT-R1 sglang   fn_ctxladder

uv run --with matplotlib bench/make_charts.py   # assets/eb_*.png
uv run bench/build_report.py                    # engine_benchmark_report.html
One engine runs at a time, behind a lock; every arm boots fresh, settles the card, and records its resolved flags, image digest and telemetry before the first request.
A note on the SGLang image. It is our own overlay: an Aug 17 nightly plus four
upstream pull requests that carry this model's SM120 kernels
(#36567,
#36556,
#36749,
#36750) and one local patch for
FP8 KV dequantisation. Those are other people's work and every SGLang number here
depends on them. There is no build script in this repo for that overlay;
docker/docker-compose.sglang.yaml documents exactly how the image is run.
Hardware
All numbers are measured on a single card, one server at a time:
| GPU | NVIDIA RTX PRO 6000 Blackwell (sm_120), 96 GB VRAM (~92 GB usable) |
| CPU | AMD Ryzen 9 9950X, 16 cores / 32 threads |
| RAM | 96 GB DDR5 dual channel (~91 GB usable) |
| llama.cpp | ghcr.io/ggml-org/llama.cpp:server-cuda13, build b10666 (4e97ac86e). qwen4exp support landed upstream in 6c84c7d5d, first tagged build b10658 |
| Model | unsloth/Qwen3.8-Flash-Next-GGUF:UD-IQ4_XS, 87.2 GiB, 176.94B total parameters |
| GPU layout | single GPU, -ngl 999, -ot per_layer_token_embd=CPU, no tensor split |
| Raw baseline | 109 tok/s decode, 1,955 tok/s prefill at a 2,048-token prompt |
Quick start
./scripts/download_models.sh          # UD-IQ4_XS, 93.7 GB, resumable, sha256-verified
./scripts/serve.sh                    # pulls the image on first run, waits for health
curl -s localhost:8000/health
No local engine build is needed. The upstream image carries qwen4exp support, and compose pulls it if it is not already present.
serve.sh wraps docker/docker-compose.yaml and resolves the HuggingFace
cache path for you:
./scripts/serve.sh --print                       # show resolved config, start nothing
./scripts/serve.sh --ctx 262144                  # full native context
./scripts/serve.sh --n-cpu-moe 42 --ctx 262144   # 24 GB-class card
./scripts/serve.sh --spec ngram-mod              # speculative arm
./scripts/serve.sh --down
How every test is run
The rules come first, because a number without its method is not a result.
- Scores come from saved files. Every request writes a result row to disk. Each score is computed from those rows by a recorded command. Scores are never copied from terminal output.
- We read the logs and check the generated text. A checker flags runs where the model did not do the workload: tool calls with no executor, stub answers, missing code, truncated turns. This matters — three early runs reported plausible speeds (158, 98 and 105 tok/s) while the model only emitted tool-call syntax and wrote no code. Speed alone cannot show that.
- One fresh server per arm, with a cooldown. A settle routine waits for the previous arm's VRAM to be released and for the card to cool to 42 °C or less, then holds a floor delay. A hot card clocks lower, so back-to-back arms would measure order, not configuration.
- We repeat and reverse the order. Two-configuration tests run A-B-B-A, and the order effect is reported — 0.56% for the placement test.
- The GPU is monitored during every arm. Temperature, power, clocks and throttle flags per arm; DCGM profiling counters for tensor-pipe, GPU-memory and PCIe activity. A thermal throttle voids the arm.
- The sampler must match the mode, checked against the model card before each workload test.
- Every option is asserted before the run — tensor placement, context, expert offload, microbatch, batch, parallel slots, GPU layers, loading mode, lazy reads, KV layout. A mismatch fails the arm before any request is sent.
Every arm walks the same pipeline:
flowchart LR
A["GPU cool-down<br/>≤ 42 °C + settle"] --> B["Fresh server<br/>this arm's flags only"]
B --> C["Record resolved config<br/>compose.txt + /props"]
C --> D{"Matches model card<br/>and arm intent?"}
D -- no --> X["Arm voided"]
D -- yes --> E["Run workload<br/>A-B-B-A order"]
E --> F["Check the text<br/>tool calls · stubs · repetition"]
F --> G["Telemetry verdict<br/>temp · clocks · DCGM"]
G --> H["Publish"]
Sampler values, from the model card
| Parameter | Thinking | Non-thinking |
|---|---|---|
| Temperature | 1.0 | 0.7 |
| top-p | 0.95 | 0.80 |
| top-k | 20 | 20 |
| min-p | 0.0 | 0.0 |
| Presence penalty | 0.0 | 1.5 |
| Repetition penalty | 1.0 | 1.0 |
The five workloads
No test uses live traffic. Every run of a test sees the same input.
| Workload | What the model receives | Used by |
|---|---|---|
| Speed sweep | Real code-problem text (101 LiveCodeBench problems) cut to exact prompt lengths, 256 → 245,760. Greedy, fixed output length, prompt cache off | ladder, placement, load mode, microbatch, quant |
| llama-bench | The tool's own built-in tests (pp512, pp4096, tg128) | ladder cross-check |
| Coding conversation | Fixed requests that build one app step by step, as one growing conversation. Model-card sampler | speculation, preserved reasoning |
| Concurrent load | Unique ~4,000-token prompts, exactly 256 output tokens, cache off, 1–16 at once | concurrency |
| Recall document | Generated document up to 245,760 tokens with three planted facts at three depths, graded by exact checkers | long-document recall |
Why not greedy sampling for workload tests
Greedy (temperature 0, top-k 1) promises identical output between arms. On this engine it does not deliver that: with speculation as the only difference, output diverged on the first turn. Speculation verifies several tokens per forward pass, so the arithmetic batches differently and a near-tie token choice can flip. Workload tests therefore compare decode rates under the model-card sampler. Fixed-length synthetic sweeps still use greedy with a pinned output length, where the sampler cannot change how much work is done.
Results
Machine-readable evidence is under results/; each test names its
directory below. results/CONFIGS.md lists the exact
server configuration of every one of the 42 server starts, generated from the
saved artifacts.
The lookup table belongs in system RAM
Most model weights feed large matrix multiplications. The PLE table is different: for each token the model fetches a few small rows by address, with no matrix multiply.
flowchart LR
G["87.2 GiB GGUF<br/>176.94B params"] --> S{"-ot per_layer_token_embd=CPU"}
S -->|"matrix-multiply weights · 60.7 GiB"| V["GPU VRAM<br/>+ 10.3 GiB KV at 262K"]
S -->|"PLE lookup table · 27.2 GiB"| R["System RAM<br/>row fetch by address"]
| Part | Params | Size | Fast placement |
|---|---|---|---|
| Expert weights | ~120 B | 60.7 GiB | GPU VRAM |
| PLE lookup table | ~51 B | 27.2 GiB | System RAM (CPU) |
| 262,144-token context | — | 10.3 GiB | GPU VRAM |
How it runs: four server starts in A-B-B-A order; the only change is
per_layer_token_embd=CPU or =CUDA0. One warm-up and three measured requests
at a 2,048-token prompt, context 32,768 in both arms (the GPU placement does not
fit 262,144 with all expert layers on the card).
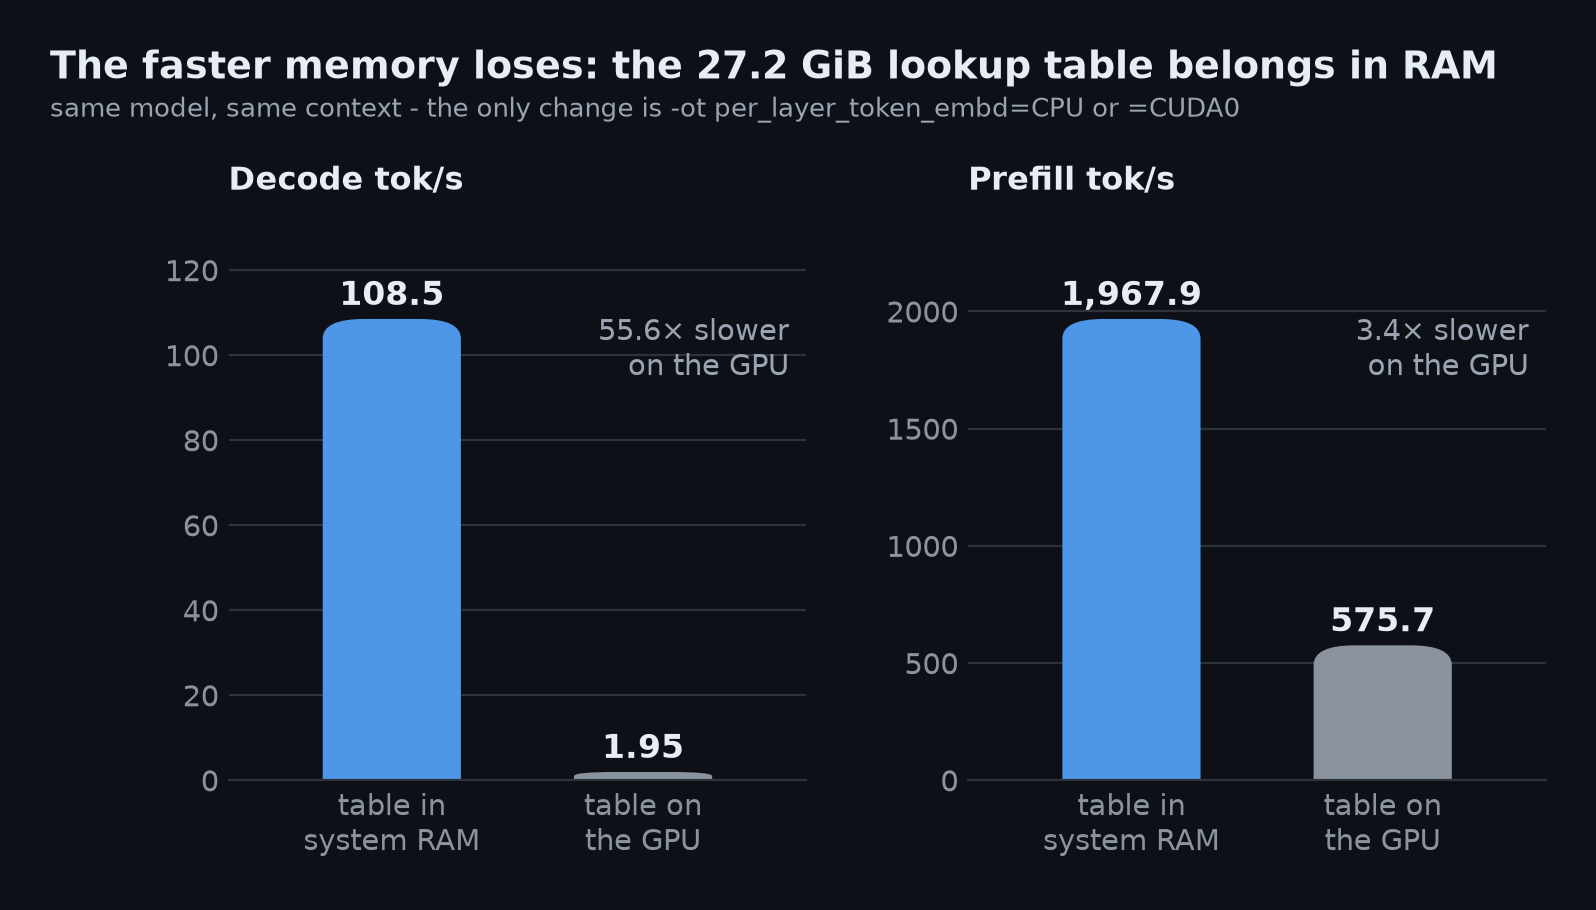
| PLE placement | GPU memory | Host memory | Prefill tok/s | Decode tok/s |
|---|---|---|---|---|
| System RAM / CPU | 63,407 MiB | 27.2 GiB | 1,967.9 | 108.5 |
| CUDA0 / GPU | 90,927 MiB | 0.4 GiB | 575.7 | 1.95 |
Decode is 55.6× slower with the table on the GPU; prefill 3.4× slower. The memory columns prove the placement moved. Decode pays a per-step CPU↔GPU cost on every token, so it slows 55.6×; prefill batches many tokens per step and slows only 3.4×.
results/corrections/20260830T145932Z_PLE-01/
What it runs like on the card you own
VRAM is software-limited to reproduce smaller cards' capacity, not their bandwidth. Expert layers move to system RAM until the model and that tier's largest servable context fit.
| Usable VRAM | Closest setup | Expert layers in RAM | Loading | Prefill 2K | Decode 2K | Long-context decode |
|---|---|---|---|---|---|---|
| None | CPU only | all | mmap | 183 | 8.3 | — |
| 8 GiB | 3060 / 4060 | 48 of 48 | mmap | 232 | 35.7 | — (16K max) |
| 16 GiB | 4060 Ti / 5060 Ti | 45 of 48 | mmap | 249 | 37.9 | 20.6 @ 123K |
| 24 GiB | 3090 / 4090 | 42 of 48 | mmap | 260 | 39.0 | 14.9 @ 245K |
| 32 GiB | 5090 | 36 of 48 | mmap | 292 | 42.2 | 15.4 @ 245K |
| 48 GiB | 2× 3090 | 23 of 48 | RAM resident | 747 | 51.7 | 17.0 @ 245K |
| 96 GiB | this card | 0 of 48 | RAM resident | 1,955 | 109.1 | 21.6 @ 245K |
Not every tier can use the same loading mode. The 8–32 GiB tiers offload so
many expert layers that resident loading would need more system RAM than this
machine has, so they use mmap. Only 48 and 96 GiB run --load-mode none.
The tiers converge as the prompt grows. At 2,048 tokens the 96 GiB tier decodes 2.8× faster than the 24 GiB tier; at 245,760 tokens the lead is 1.45×. Long context costs every tier, and the fastest tier most.
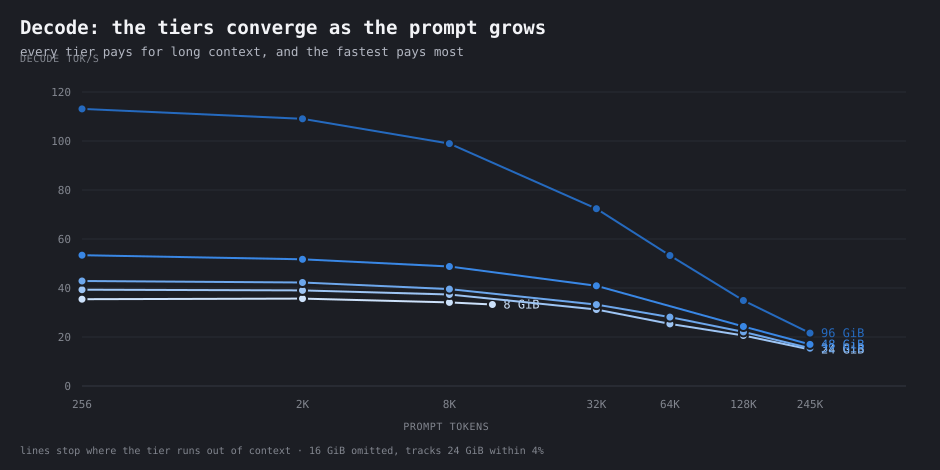
Prefill is what the VRAM actually buys. At a 2K prompt the 96 GiB tier processes prompts 8.4x faster than 8 GiB, against 3.1x for decode. Prompt processing runs every weight through the GPU, so resident layers do compute-bound work; decode only streams the ~2.4B active expert parameters per token, which system RAM can feed. Your GPU buys reading speed; your RAM decides whether the model runs at all.
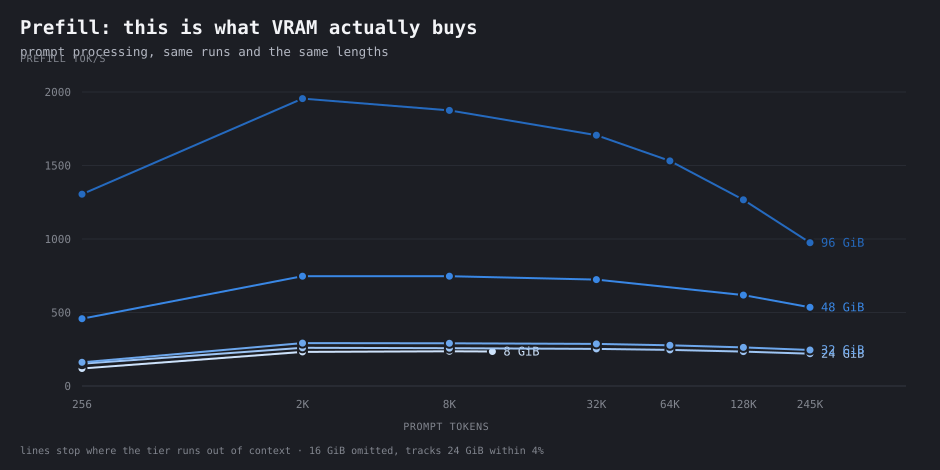
report.html has the per-tier charts, all 38 measured points with TTFT, and the
llama-bench cross-check. results/tier_full/, results/cpu_only/.
16 GiB is omitted from the two line charts for legibility; it tracks 24 GiB within 4%. Five is also the most steps the blue ordinal ramp holds while keeping adjacent tiers distinguishable.
Loading mode: mmap or RAM resident
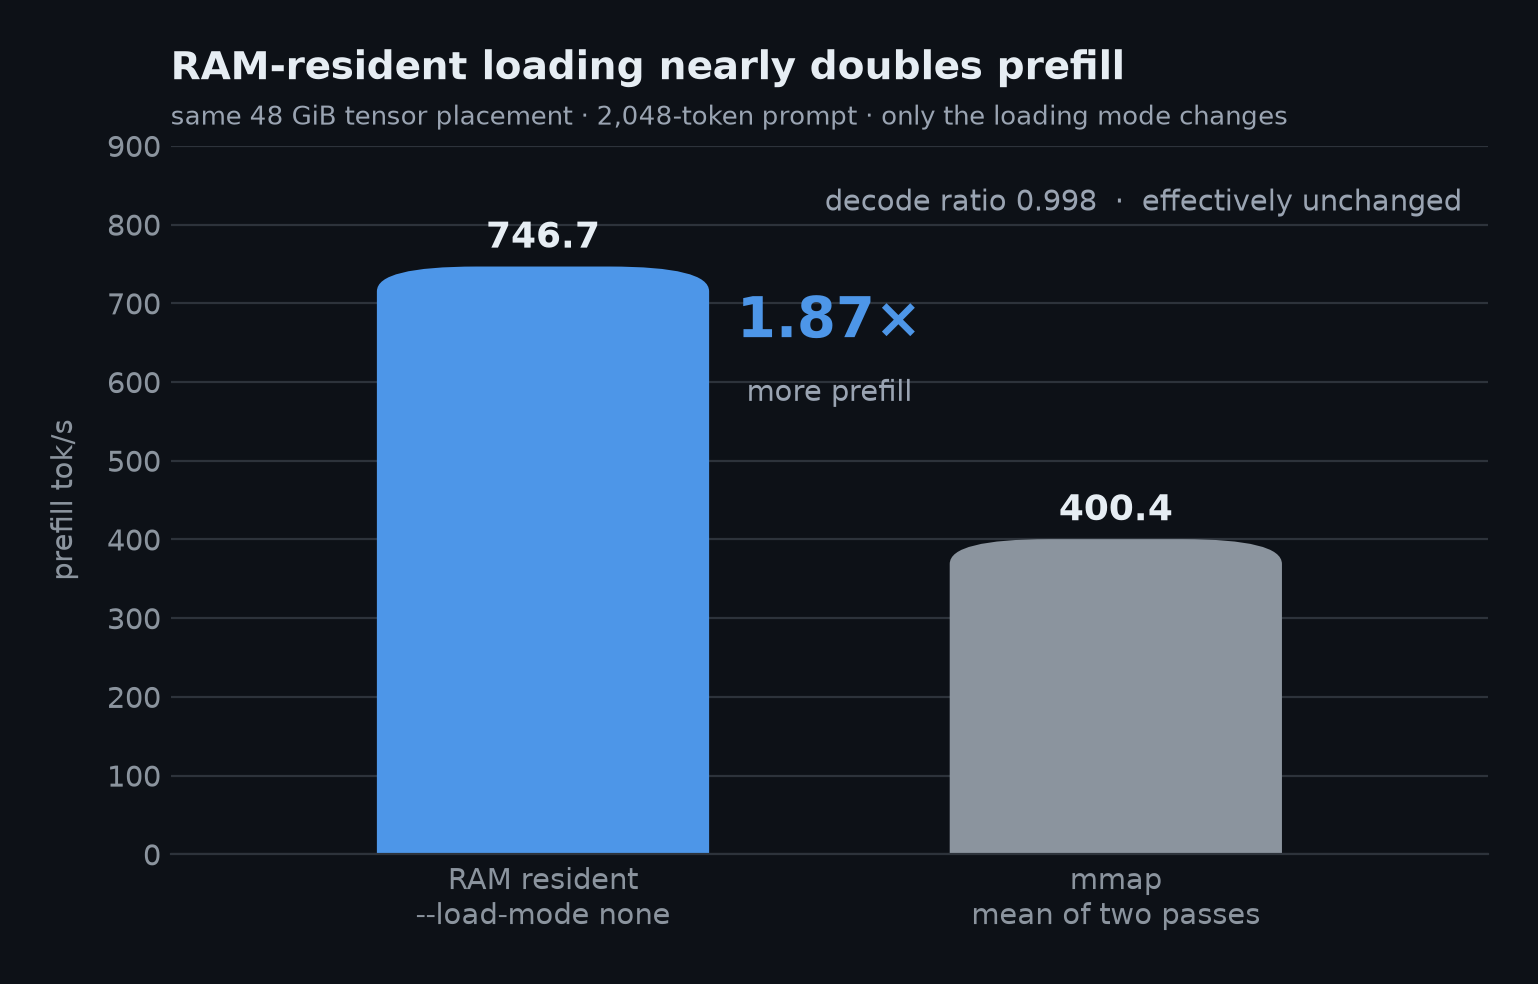
How it runs: the 48 GiB tier again, identical tensor placement, context and microbatch — only the loading method changes. mmap runs cold and again warm.
| Prompt tokens | RAM resident | mmap 1st | mmap 2nd | 2nd vs resident |
|---|---|---|---|---|
| 2,048 | 746.7 | 394.9 | 405.8 | 54% |
| 8,192 | 747.2 | 407.4 | 392.3 | 52% |
| 32,768 | 723.9 | 405.9 | 404.3 | 56% |
| 131,072 | 618.5 | 365.5 | 366.2 | 59% |
The ladder shows a 2.6× prefill step between 32 and 48 GiB. Two things change there: VRAM and loading mode. Separated: resident loading is 1.87×, more VRAM is 1.39×, and 1.39 × 1.87 = 2.60 — the whole step. Decode is unaffected by loading mode (ratio 0.998).
Before buying more VRAM, check whether the machine has enough free system RAM
to use --load-mode none.
results/mmap_control_p1/, results/mmap_control_p2/,
results/corrections/20260830T151444Z_LOAD-01/
Microbatch size
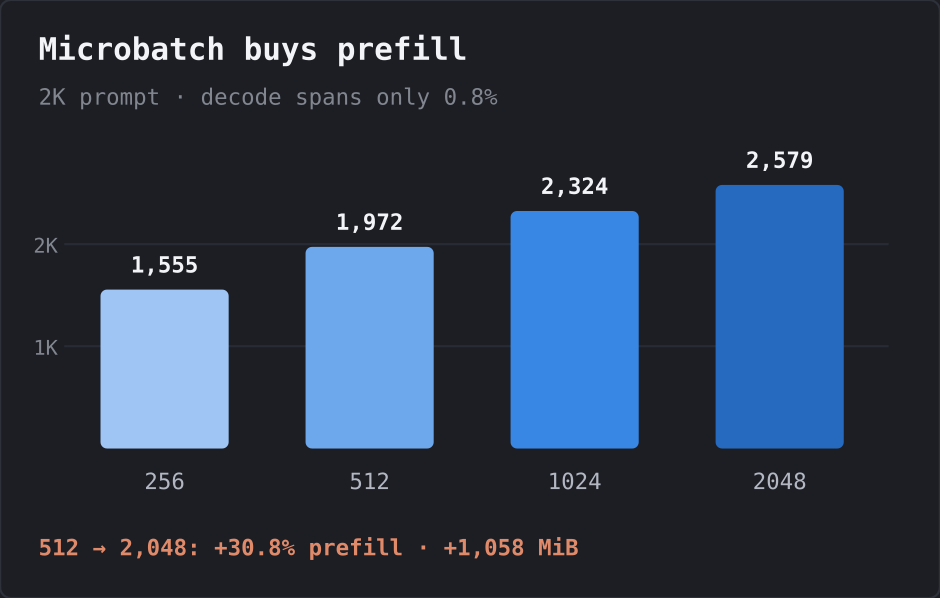
How it runs: only -ub changes — 256, 512, 1,024, 2,048 — ascending then
descending, fresh server each time, context 32,768, no expert offload.
| Microbatch | Prefill tok/s | Decode tok/s | GPU memory | vs 512 |
|---|---|---|---|---|
| 256 | 1,555.5 | 108.66 | 63,231 MiB | −21.1% |
| 512 | 1,972.3 | 108.50 | 63,407 MiB | baseline |
| 1,024 | 2,324.1 | 109.07 | 63,759 MiB | +17.8% |
| 2,048 | 2,579.3 | 109.02 | 64,465 MiB | +30.8% |
Prefill-only: decode spans 0.8% across the sweep. Returns diminish (+26.8%, +17.8%, +11.0%), so most of the gain is in by 1,024. The cost is 1,058 MiB from 512 to 2,048 — free on this card, but on a small card that memory competes with context and expert layers.
results/corrections/20260830T180949Z_UB-01/
n-gram speculation
How it runs: the same three-turn coding conversation in thinking mode with the model-card sampler; four pairs with alternating order, fresh server per arm, output text checked per arm. Score = total generated tokens ÷ total decode time.
| Configuration | Run 1 | Run 2 | Run 3 | Run 4 | Mean |
|---|---|---|---|---|---|
| Baseline | 79.7 | 91.1 | 86.8 | 81.5 | 84.8 |
| ngram-mod | 89.3 | 89.6 | 91.9 | 91.5 | 90.6 |
| Draft acceptance | 43.2% | 41.6% | 35.1% | 28.2% | — |
About +7% (84.8 → 90.6 tok/s), 95% CI on the difference +0.6 to +11.0 tok/s. Real but not large, and four runs per arm leave it imprecise. No DFlash or MTP draft model exists for this model; this is n-gram speculation only.
results/corrections/20260830T171252Z_SPEC-01-rate/,
results/corrections/20260830T182917Z_SPEC-01-rate/
One request does not saturate the GPU
Tensor-pipe activity runs 0.9% (8 GiB) to 13.3% (96 GiB); SM activity reaches 69% at 96 GiB. Neither the tensor pipeline nor the memory interface saturates.
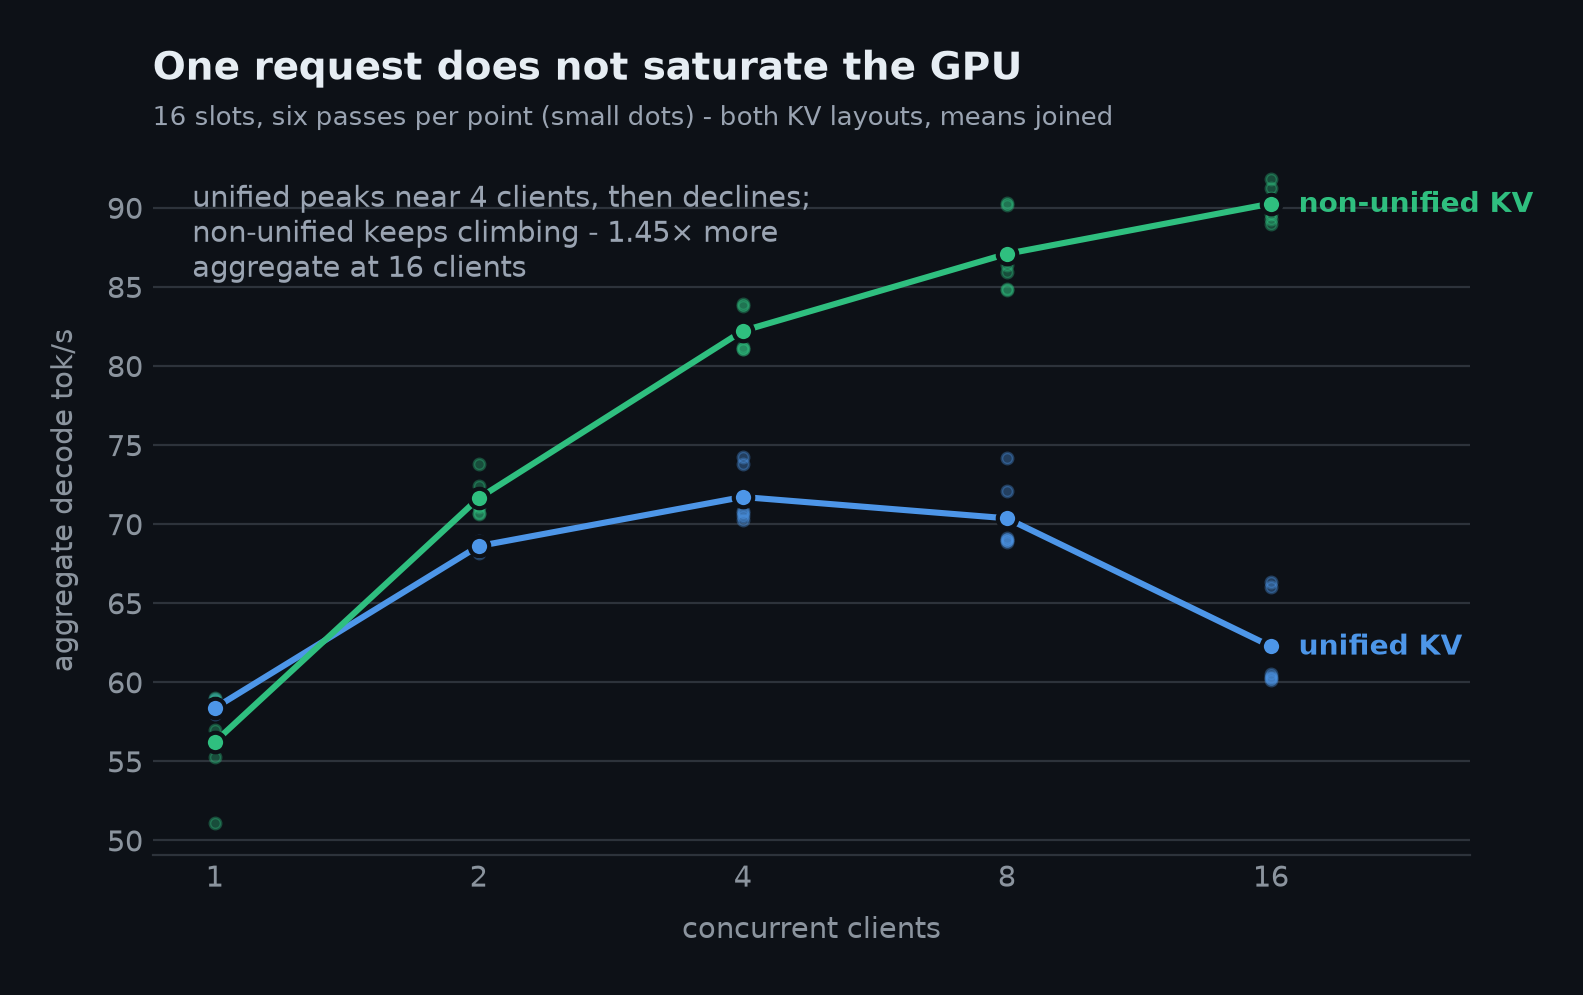
Concurrency: two KV-cache layouts at the same total context (131,072) and the same 16 slots — one shared pool, or 8,192 tokens per slot. Two server starts per layout, three sweeps each, so every cell is the mean of six samples.
| Requests at once | Unified KV | Non-unified KV |
|---|---|---|
| 1 | 58.4 ± 0.4 | 56.2 ± 2.9 |
| 2 | 68.6 ± 0.3 | 71.6 ± 1.2 |
| 4 | 71.7 ± 1.8 | 82.2 ± 1.3 |
| 8 | 70.4 ± 2.2 | 87.1 ± 2.5 |
| 16 | 62.3 ± 3.0 | 90.3 ± 1.1 |
The shape matters more than the ratio: unified peaks around 4 concurrent then declines; non-unified keeps climbing to 16, where it is 1.45× faster in aggregate. At one or two requests the layouts match within noise — the difference only appears under load. Individual requests slow either way, from ~104 tok/s at one to 10–12 tok/s at sixteen.
results/corrections/20260830T193552Z_CONC-01/
Preserved reasoning — an early look
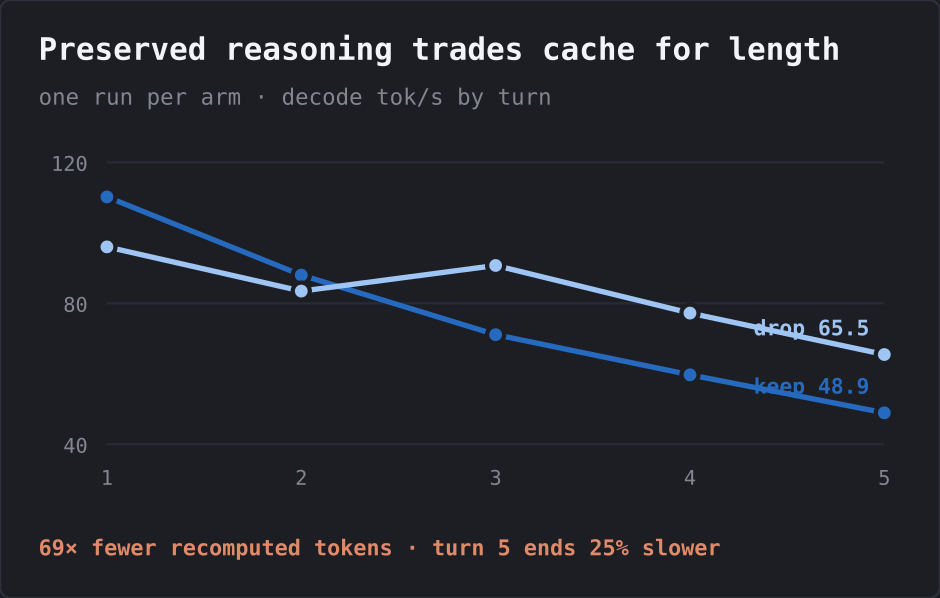
Both arms run in thinking mode with the model-card sampler. The flag controls one thing: whether earlier turns' reasoning is sent back in later prompts. The model still generates reasoning every turn in both arms.
| Keep prior reasoning | Drop prior reasoning | |
|---|---|---|
| Prompt tokens recomputed | 267 | 18,403 |
| Prompt tokens from cache | 132,972 | 18,183 |
| Turn-5 prompt length | 63,223 | 18,387 |
| Decode, turn 1 → 5 | 110.2 → 48.9 | 96.0 → 65.5 |
Keeping reasoning makes the history append-only, so the server recomputes almost nothing — 69× fewer prompt tokens. But the prompt grows to 63,223 tokens by turn 5 and decode ends 25% lower. One run per arm, so this is a direction, not a magnitude. More measurement is planned; the result will go in the comments under the video.
results/corrections/20260830T200958Z_THINK-01/
Long-document recall after server reuse
How it runs: three facts are hidden in a long generated document — an access code, a number a later sentence corrects, and a date among decoys — at three depths. The model is asked to find each one. Then one different large request goes to the same server. Then the same questions are asked again. Exact checkers grade every answer, and the checkers were first proven able to fail.
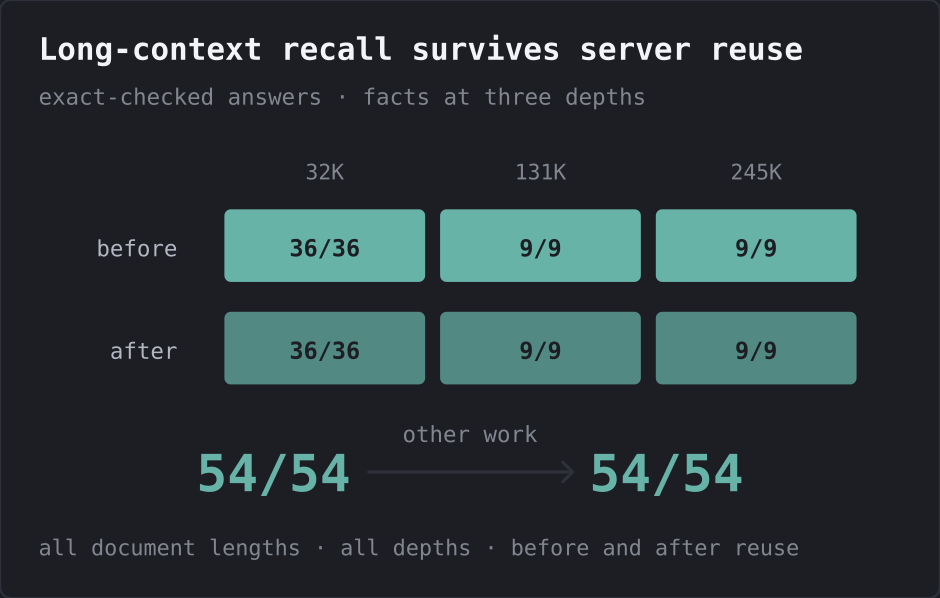
| Document length | Before other work | After other work |
|---|---|---|
| 32,768 (1 and 4 slots) | 36/36 | 36/36 |
| 131,072 | 9/9 | 9/9 |
| 245,760 | 9/9 | 9/9 |
| Total | 54/54 | 54/54 |
Every answer stayed correct. An upstream project reported recall errors in a similar situation on a different GPU backend; that behavior did not appear here on CUDA.
results/slot_reuse/
Quant comparison
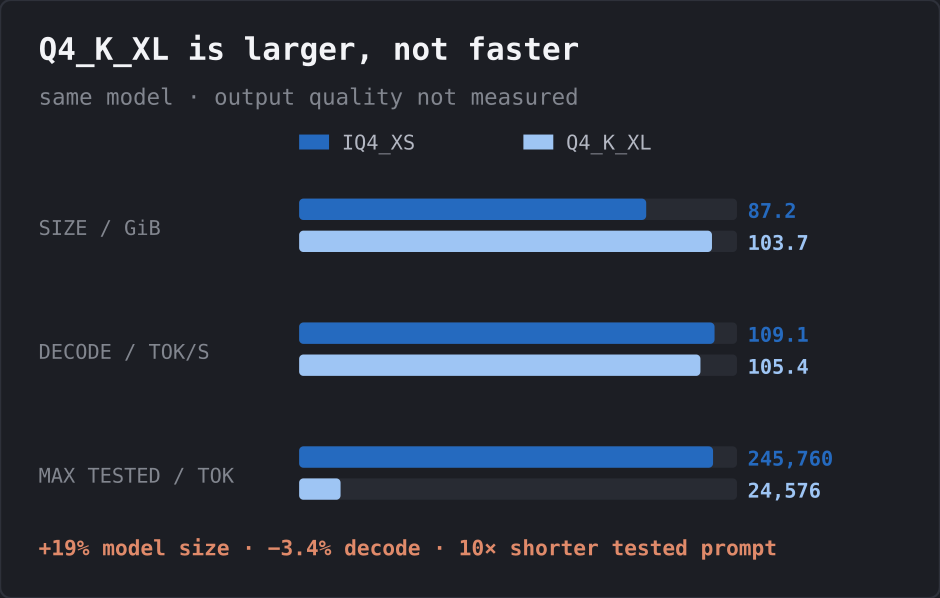
| UD-IQ4_XS | UD-Q4_K_XL | |
|---|---|---|
| Size | 87.2 GiB | 103.7 GiB |
| Decode @2K | 109.1 | 105.4 |
| Configured context | 262,144 | 32,768 |
| Largest tested prompt | 245,760 | 24,576 |
Q4_K_XL costs 3.4% decode for 19% more model and reduces the context this card can hold. Its real context ceiling was not probed. Output quality was not measured for either quantization.
results/q4kxl/
The configuration that matters
-ot per_layer_token_embd=CPU   # the 27 GiB lookup table.
                               # On the GPU instead: 55.6x slower.
--load-mode none               # copy host-side weights into RAM instead of mmap:
                               # 1.87x prefill here. Needs room in system RAM.
--tensor-read-lazy off         # 'auto' silently streams any tensor >4 GiB from
                               # disk. The largest PLE tensor is ~25 GiB.
--n-cpu-moe N                  # expert layers kept in system RAM.
                               # 0 at 96 GiB VRAM; all 48 at 8 GiB VRAM.
-ub 2048                       # +30.8% prefill vs 512 for +1,058 MiB, measured.
                               # Use 1024 (+17.8%, +352 MiB) if VRAM is tighter.
--parallel 1                   # one user. For 8+ concurrent users prefer the
                               # non-unified KV layout.
Benchmarks — run them yourself
./benchmark/tier_full.sh              # the hardware ladder
./benchmark/mmap_control_v2.sh        # loading mode, cold and warm
./benchmark/cpu_only.sh               # no GPU at all
./benchmark/slot_reuse_long.sh        # long-document recall
uv run benchmark/slot_reuse.py --selftest     # checkers must be able to fail

./benchmark/correction_run_v2.sh --execute --plan-id CORRECTION-R1 --only PLE-01
./benchmark/correction_run_v2.sh --execute --plan-id CORRECTION-R1 --only UB-01
./benchmark/spec01_rate.sh --execute --plan-id CORRECTION-R1
./benchmark/conc01.sh   --execute --plan-id CORRECTION-R1
./benchmark/think01.sh  --execute --plan-id CORRECTION-R1
Each controller prints its plan and exits unless given --execute and the plan
id. Every sweep calls gpu_settle() between arms: it waits for the previous
arm's VRAM to be released and for the card to cool, then holds a floor delay.
What this does not prove
- Capping VRAM reproduces capacity, not bandwidth. A 24 GiB cap on this Blackwell card overstates a real 3090 (~1.6 TB/s vs 936 GB/s). The 5090 row is the one fair proxy; multi-GPU rows are an optimistic upper bound.
- Most long-context cells are a single run. Short-prompt arms repeat to 0.2% decode and 0.7% prefill, but a 245,760-token cell costs ~18 minutes and ran once.
- The mmap penalty is measured, not explained. The two mmap passes agree within 0.5%, so the file cache is not the obvious cause. A background download ran during that control at ~54 MiB/s; both passes shared it.
- The recall test restarts the server once per document length. Only the first probe after each start runs on a never-used server.
- The speculation gain is ~+7% with a wide interval (+0.6 to +11.0 tok/s, 95%) from four runs per arm. Draft acceptance also declined across runs, 43% → 28%, unexplained.
- The preserved-reasoning comparison is one run per arm — direction and mechanism, not a settled magnitude.
- The microbatch sweep covered one configuration: context 32,768, no expert offload, this card.
- Quant quality was never measured. IQ4_XS versus Q4_K_XL is speed and reach only.
Repo layout
scripts/download_models.sh   sequential, resumable, sha256-verified. aria2c, not
                             `hf download`, which cannot resume.
scripts/serve.sh             quant name -> cache path -> server.
docker/best.*.yaml           one standalone compose file per winning
                             configuration, every value written out and the model
                             paths pinned. `docker compose -f <file> up -d`.
docker/                      one compose file per engine: docker-compose.yaml
                             (llama.cpp), .sglang.yaml, .freetoken.yaml, plus the
                             FreeToken image and the no-speculation override.
benchmark/                   the first report's harnesses. See benchmark/README.md.
bench/                       the second report's harness: run.sh and the engine
                             library, the workload .conf files, the accuracy and
                             boot/cache/greedy arms, and the report generators
                             (report_data.py -> build_report.py, make_charts.py).
artifacts/                   the saved runs the second report reads. See
                             artifacts/README.md for the map and the void list.
results/                     saved evidence for the first report, and the tier
                             experiment's verdicts and cgroup traces.
assets/                      the charts for both reports, as dark PNG files.
report.html                  first report: one engine, why the model fits.
engine_benchmark_report.html second report: three engines, self-contained.
pyproject.toml, uv.lock      the pinned Python environment (uv).
References
Model and weights:
- Qwen3.8-Flash-Next: https://huggingface.co/Qwen/Qwen3.8-Flash-Next
- Official announcement: https://qwen.ai/blog?id=qwen3.8-flash-next
- Official repo: https://github.com/QwenLM/Qwen3.8-Flash-Next/
- Unsloth GGUFs: https://huggingface.co/unsloth/Qwen3.8-Flash-Next-GGUF
- llama.cpp qwen4exp support, merged as
6c84c7d5d; first tagged buildb10658 - Independent quality benchmarks: https://artificialanalysis.ai/models/qwen3-8-flash-next
- SGLang cookbook, RTX PRO 6000 recipes (both checkpoints; the RadixArk one is measured here): https://docs.sglang.io/cookbook/autoregressive/Qwen/Qwen3.8-Flash-Next#hw=rtx6000&variant=default&quant=nvfp4&strategy=low-latency&nodes=single&pleOffload=on
Architecture and prior art:
- Qwen Team — On the Design of Qwen3.8-Next Architecture: Evaluation, Efficiency,
and Training Stability (2026) —
tech_report.pdf.
Source for the GDN equations, Qwen Sparse Attention, the gated residual, and
the 51.2B-parameter n-gram embedding table — the tensor llama.cpp names
per_layer_token_embdand this study calls the PLE table. - SGLang team — Qwen3.8-Flash-Next: Day-0 Support in SGLang (2026-08-26) — https://www.lmsys.org/blog/2026-08-26-qwen-flash-next. The host-RAM PLE path on datacenter GPUs: weights 83.91 → 60.45 GiB per GPU (−23.46 GiB), KV capacity 1.84M → 3.28M tokens (+78.54%), throughput −0.07%. This study measures the same placement question on one consumer-class card.
- Yang, Kautz & Hatamizadeh — Gated Delta Networks: Improving Mamba2 with Delta Rule (ICLR 2025) — https://arxiv.org/abs/2412.06464. Background for the gated delta rule: decay plus targeted memory correction. 36 of this model's 48 blocks are gated-delta-net layers.
Previous studies in this series:
- DeepSeek V4 Flash + DSpark: https://github.com/lukaLLM/deepseek-v4-flash-dspark-rtx6000pro
- Qwen 27B speculative decoding: https://github.com/lukaLLM/DFlash_Qwen3.6_27B_LlamaCPP
Similar repos


Languages
HTML
61.8%
Shell
20.6%
Python
16.6%
See what people are saying
README
Qwen3.8-Flash-Next on one RTX PRO 6000
YouTube
LOCAL AI SERIES:
- NEW: Qwen3.8 Flash: Over 7x Faster First Token | llama.cpp vs SGLang vs FreeToken. Benchmarked! https://youtu.be/RlsxXB5q-cA
- Why Qwen3 8 Flash Is So Cheap to Run 0 to 96GB VRAM Explained and Tested! https://youtu.be/L4XyWM6IrBc
- DeepSeek V4 Flash 284B on a single RTX 6000 PRO with DSpark https://youtu.be/EDls1Popv1o
- Fastest Qwen 3.8 27B in Llama.cpp? DFlash 2 + n-gram Explained & Benchmarked! https://youtu.be/RBlRTUwJMI4
- Up to 8x Faster AI N-gram Explained, Deployed & Benchmarked on Qwen 3.6 27B llama.cpp! https://youtu.be/zNUoHONUHGk
- Up to 6x Faster AI? DFlash Explained, Deployed & Benchmarked on Qwen 3.6 27B llama.cpp! https://www.youtube.com/watch?v=TUdihA_dJjo
Qwen3.8-Flash-Next (125B MoE, 6B active) on a single RTX PRO 6000 with 96 GB of system RAM, in llama.cpp. 51.2B of its 176.94B parameters are a lookup table, not matrix-multiply weights. Put that table in system RAM and the model runs on an 8 GB card — or on no GPU at all.
Short answers: putting the lookup table on the GPU instead is 55.6× slower
to decode. The largest free speed lever is not the card, it is
--load-mode none, worth 1.87× prefill at identical tensor placement. The
model reaches 36 tok/s on an 8 GB card and 8.5 tok/s with no GPU. A
larger microbatch buys +30.8% prefill for about 1 GiB of VRAM.
Answering a viewer: an RTX 4090, 24 GB VRAM, 64 GB system RAM.
- Does it run? Yes — about 34 tok/s. Verified in a container hard-capped at 64 GB, and again at 56 GB to leave room for an OS: 34.4 and 34.7 tok/s, the same speed this box gets at that VRAM tier with all 91 GiB.
- Should you turn on MTP? No. On a 24 GB card the draft head is 3.4× slower (10.2 vs 34.7 tok/s). Its advertised 1.3–1.7× is real, but only when every expert is on the GPU — at 96 GiB it is 1.61×. Putting the head on the CPU does not help.
- The flags that matter, on top of the usual ones:
--n-cpu-moe 42                    # 42 of 48 expert layers on the CPU
-ot per_layer_token_embd=CPU      # the 27 GiB lookup table stays off the GPU
--load-mode mmap
--lazy-mode on                    # read that table from SSD; server sits at ~3 GiB
-ub 512
Without --lazy-mode on it still runs at the same speed, but streams the model off
the disk continuously to stay under the limit — 611 MB/s, all run long.
The chart below is the original ladder, kept for reference. It ran on this box's 91 GiB of host RAM, which the chart itself never stated — the new one above is the version with the RAM budget tested rather than assumed.
The full write-up, with a diagram per result and every limit stated, is
report.html — open it in a browser.
We discuss it here: Reddit thread
Third report: the official SGLang image, and seven tests speed cannot show
qwen38-flash-next-official-sglang-report.pdf —
the official lmsysorg/sglang:dev-qwen38-next-local recipe against our build (first token,
prefill, decode, cold vs cached), then the model at work: tool calling (BFCL, τ²-bench
telecom), a needle in 262K tokens, an army-building game against reference armies and
against Claude and GPT, an SVG it drew and judged with its own eyes, an animated board in
the channel's design system, and a raw video take it cut from a transcript it made itself.
Every number is generated from a saved run. The test harness behind it is private while it
is still changing; the report is not.
Second report: three engines, one card
The first report above is one engine. engine_benchmark_report.html
is the follow-up: the same model on the same card served three ways — llama.cpp,
SGLang and FreeToken — plus everything measured since. Open it in a browser; it is
one self-contained file with every chart embedded.
What it measures, and what came out:
- Speed against context, 2K to 262K. Three different shapes, not three speeds. SGLang holds ~180 tok/s decode; FreeToken is almost flat; llama.cpp collapses 3× across the ladder. Prefill spreads 7.3× at the full window.
- Accuracy. GSM8K (1,319 problems) and MATH-500, exact match, no LLM judge. All four arms land within eight-tenths of a point, and nine paired tests come back null. Which stack you pick changes how long you wait, not what you get back.
- Multi-token prediction, working for the first time. The checkpoint ships its own draft head; llama.cpp could not load it until a fork build. It is worth 1.63× at 8K, 1.69× at 32K and 2.6× at the full window, and it changes the shape of the curve rather than just lifting it. Accuracy with it on: 95.75% against 95.60%, paired p = 0.87.
- Why
--load-mode noneand notmlock— a viewer's question from the last video, answered with all five modes measured. They are the same within 4%. - GPU temperature, power and energy. Nothing ever throttled; peak 82 °C with 12 °C of headroom. The interesting number is energy per request: 8.9× between the fastest and slowest stack, because a GPU draws its working power whatever it is doing and the only lever is finishing sooner.
- Startup cost, which nobody publishes and which ranks the engines backwards:
llama.cpp answers in 16 s, SGLang 108 s, FreeToken 126 s — and FreeToken's
/healthreturns 200 79 seconds before it can serve. - Resizing the KV cache on a running server (FreeToken): ~1 s against 82 s to restart, and the pool turns out to be a wall, not a slope.
Every number in that report is generated from saved evidence by
bench/report_data.py — nothing is typed in by hand. The runs it reads are in
artifacts/, with the void ones listed and explained.
Update: the official SGLang image, and a viewer who was right
A viewer said the SGLang arm was "missing a ton of speed optimizations" and
"using your SSD for engrams." Both were tested. His fork's launch flags do not
transfer to our build — 22 of 23 exist, one hangs, the rest are inside noise
(results/BLOCKERS.md B-27 to B-30). But his mechanism was right: the
47.68 GiB lookup table was streaming from NVMe because nothing that pinned it
in host RAM had ever booted on 91 GiB. The September SGLang cookbook's
RTX PRO 6000 recipe
(single node, NVFP4, low-latency, PLE offload on) on
lmsysorg/sglang:dev-qwen38-next-local does boot with the table pinned — at
the 86 GB container cap, with nothing to spare — and this is what it changes:
The cookbook page carries two recipes for this card. The one measured here
is the first, for RadixArk/Qwen3.8-Flash-Next-NVFP4 — the same checkpoint
every SGLang number in this repo uses, so the comparison is image-against-image.
The second, for nvidia/Qwen3.8-Flash-Next-NVFP4 (NVIDIA's own mixed-precision
export, which needs this image's loader and reports a ~170k-token pool at 16
slots against RadixArk's ~78k), is in bench/sglang_recipe_compare.py as the
nvidia_context1 arm and has not been run yet — it is a 133 GB download.
| ISL | TTFT ours → official | prefill ours → official | decode ours → official |
|---|---|---|---|
| 8K | 1.1 s → 0.6 s | 7,768 → 12,997 (+67%) | 175 → 199 |
| 32K | 4.2 s → 2.4 s | 7,742 → 13,662 (+76%) | 227 → 238 |
| 64K | 8.6 s → 4.9 s | 7,602 → 13,381 (+76%) | 181 → 200 |
| 128K | 16.8 s → 10.2 s | 7,811 → 12,806 (+64%) | 222 → 242 |
| full window | 34.8 s → 22.4 s | 7,284 → 11,352 (+56%) | 186 → 217 |
Same checkpoint, same 4,096-token output, three requests per rung, no thermal or memory void. Prefill is 1.6–1.8× faster at every length; the full-window first token arrives 12 seconds sooner. Decode is higher at all five rungs but inside the ~15% request-to-request spread three requests can resolve, so no figure is claimed for it.
Three things to know before running it (docker/best.sglang-official.yaml):
-
The published recipe cannot serve the full window. Its default 16 slots leave a 76,224-token pool; 128K and above are refused. The compose file drops it to one slot (pool 268,096) and sets
--max-mamba-cache-size 5— scaling the recipe's 48 linearly gives 3, and NEXTN needs five states per request on this model, so 3 boots and then deadlocks on the first request. -
It is not one flag. Every parameter that differs, read from both servers' resolved arguments, with what each does and what is known about its effect:
parameter ours official what it does known effect PLE table placement streamed from NVMe ( io_uring, queue depth 512)--ple-offload-embedding: pinned in host RAMThe 47.68 GiB per-layer embedding table — 128 tensors, 320M FP8 rows — gathered at every layer for every token. Cannot fit in VRAM beside the model. Likely the largest term. Prefill gathers rows for every prompt token, and the gain is largest exactly where prompts are long. Not isolated: the two images are their PLE strategies. KV cache dtype fp8_e4m3auto→ bf16Precision of the attention K/V cache on the QSA layers. The official image runs higher precision and is still faster. KV on this model is small — most layers are linear-attention with no KV — so fp8 saved only 1.5 GB per side at 262K, for an unverified quality cost. CUDA graphs decode breakable, prefilldisableddefaults: captures draft decode, draft extend, target verify Replays a recorded kernel sequence instead of launching kernels one by one. The official image graphs the whole speculative loop; ours disables prefill graphs. A real decode/verify lever. SGLang build Aug 17 base + yepapa-nest overlay + 3 PRs lmsysorg Sep 7 ( 4ccff141)Three weeks of upstream work. Unknown share. Both run the hybrid-GDN path on Triton — the FlashInfer GDN promotion fires on neither. FP4 GEMM flashinfer_cudnnflashinfer_cutlassKernel library for the NVFP4 matmuls. Prefill is GEMM-bound. Plausible prefill contributor. Untested alone. SSM state dtype fp32 bfloat16Precision of the linear-attention recurrent state. Measured on our image: halves the state, frees 756 MiB, no speed change. chunked prefill 8192 4096 Prompt processed in chunks of N tokens. Normally slightly slower per token. Contribution unknown. mem-fraction-static 0.93 0.96 Share of VRAM for weights + KV. Needed for their bf16 KV; pool 268,096 vs 262,144. mamba radix strategy extra_bufferextra_buffer_lazyHow recurrent state is snapshotted for prefix reuse. Irrelevant here: every request is cache-busted. env — PYTORCH_CUDA_ALLOC_CONF=expandable_segments:True,SGLANG_OPT_MAMBA_SKIP_DECODE_LOCK=1Allocator hint; skips a lock in mamba decode. expandable_segmentsmeasured +1.7% on our image (noise). The lock skip is untested.Unchanged between the two: checkpoint and snapshot,
attention_backend=flashinfer,moe_runner_backend=flashinfer_cutlass(ours auto-resolves to it), NEXTN 3/1/4, page size 64, mamba track interval 64, context 262,144, 1 slot, 5 mamba states, no HiCache. By mechanism, the ranking would be PLE-in-RAM first, CUDA graphs on the speculative path second, cutlass GEMM third — that is reasoning, not measurement. -
The full-window chart above still shows 126.9 decode for SGLang, and that number measured the acceptance ramp. With a 128-token answer after a 35-second prefill, NEXTN has not warmed into the text; the same server and sampler at 4,096 tokens decode at 155–178 (B-31). The bar is kept because the other three bars are the same kind of measurement. Prefill and TTFT are unaffected and reproduce to 2.5%.
The configuration that won, per engine
Every number below is the configuration its own artifact recorded, not a recommendation reconstructed afterwards. One compose file per engine, all of it driven by environment variables, so a configuration is a set of variables.
| Engine | Decode / prefill at 32K | The settings that made it |
|---|---|---|
| SGLang, official image — fastest to first token | 13,662 prefill vs 7,742 for our build on the same run (different workload from the rows below: greedy, 4,096-token output) | docker/best.sglang-official.yaml: lmsysorg/sglang:dev-qwen38-next-local, PLE pinned in host RAM, 1 slot, --max-mamba-cache-size 5, flashinfer_cutlass, bf16 SSM state. Needs 86 GB host RAM and nothing else running |
| SGLang — our build, NVMe PLE | 183 / 8,088 tok/s | NVFP4, ENGINE_CTX=262144, MEM_FRACTION=0.90, PREFILL_BUDGET=8192, KV fp8_e4m3, NEXTN speculation on. ~30 GB less host RAM than the row above |
| llama.cpp + MTP — fastest llama.cpp | 160 tok/s at 2K (1.61× over the same build without it) | LLAMA_IMAGE=llamacpp-mtp:d1a92352, SPEC_TYPE=draft-mtp, SPEC_DRAFT_N_MAX=5, SPEC_DRAFT_NGL=99, and --n-cpu-moe 0 |
| FreeToken | 99 / 3,026 tok/s | NVFP4, --moe-backend offload and --ple-backend disk together |
| llama.cpp (stock image) | 69 / 1,859 tok/s | LOAD_MODE=none, -ot per_layer_token_embd=CPU, UBATCH=1024, -ngl 999, --n-cpu-moe 0 |
One departure, deliberately: docker/best.sglang.yaml sets
--mem-fraction-static to 0.93, not the 0.90 the artifact above recorded. A
later boot probe found 0.90 sizes the KV pool at 166,720 tokens — 36% short of
the window — while 0.93 reaches the full 262,144 for +1.3 GB of VRAM, with NEXTN
kept. The table records what was measured; the compose file is what is worth
running.
Four settings carry most of the difference, and each is a measured pair:
-ot per_layer_token_embd=CPU— the 27 GiB lookup table on the CPU. On the GPU instead: 55.6× slower to decode. This one setting is why the model fits.--moe-backend offload+--ple-backend disk(FreeToken) — neither alone fits. Experts 63.32 GiB + pinned table 47.68 GiB = 111 GiB on a 91 GiB box; streaming the table from NVMe leaves 63.32 GiB, which fits.UBATCH=1024(llama.cpp) — +8.8% prefill over 512. 2048 is no better.SPEC_TYPE=draft-mtp— 1.61× decode, but only at--n-cpu-moe 0. With any expert offload it is a 0.29–0.38× loss. See the chart at the top.
On a 24 GB card, the answer is different: --n-cpu-moe 42,
-ot per_layer_token_embd=CPU, --load-mode mmap, --lazy-mode on, -ub 512,
and MTP off. That runs at ~34 tok/s in 64 GB of system RAM.
Run any of them with one command
Each row above is a compose file with every value already in it — no env file, no override, no wrapper script. The file is the answer to "what flags did you run":
docker compose -f docker/best.sglang.yaml        up -d   # fastest overall
docker compose -f docker/best.llamacpp-mtp.yaml  up -d   # fastest llama.cpp
docker compose -f docker/best.freetoken.yaml     up -d
docker compose -f docker/best.llamacpp.yaml      up -d   # the stock-image baseline
docker compose -f docker/best.llamacpp-24gb.yaml up -d   # 3090 / 4090, 64 GB RAM

docker compose -f docker/best.sglang.yaml down           # stop it
They are standalone, not overrides — do not stack them with -f on the base
compose files. Each has its own project name, container name and port, so two
can run side by side.
| File | Port | Image |
|---|---|---|
best.sglang.yaml | 8001 | sglang-flashnext-sm120:local — must exist already, see below |
best.llamacpp-mtp.yaml | 8000 | built on first up from the pinned fork commit |
best.freetoken.yaml | 8002 | built on first up from docker/freetoken.Dockerfile |
best.llamacpp.yaml | 8000 | ghcr.io/ggml-org/llama.cpp:server-cuda13, pulled |
best.llamacpp-24gb.yaml | 8000 | ghcr.io/ggml-org/llama.cpp:server-cuda13, pulled |
There is no separate build step. Four of the five carry a build: block or a
registry tag, so up produces the image if the machine does not have it and
reuses it if it does. The llama.cpp fork builds straight from its git ref —
BuildKit clones the pinned commit itself, no source tree to fetch. Both builds
are CUDA compiles and take a while the first time; --build forces a rebuild
afterwards.
best.sglang.yaml is the exception and cannot be fixed here: that image is a
three-commit overlay plus a local patch that this repo does not yet carry a
recipe for (PLAN_SGLANG.md records the commits and says so). For anyone but this
machine that file is the flag list, not a working command.
The model paths are written out in full and pinned to a snapshot commit, which
is what lets these files skip the glob a script would need. If Unsloth
re-uploads, a path goes stale and each file's header carries the ls that finds
the current one.
Reproduce the second report
uv sync                                  # pinned by pyproject.toml + uv.lock
./scripts/download_models.sh             # weights, resumable and sha256-verified

# one engine, one workload, fully recorded (plan gate: prints its plan without --execute)
./bench/run.sh --execute --plan-id FLASHNEXT-R1 llamacpp fn_code_tune
./bench/run.sh --execute --plan-id FLASHNEXT-R1 sglang   fn_ctxladder

uv run --with matplotlib bench/make_charts.py   # assets/eb_*.png
uv run bench/build_report.py                    # engine_benchmark_report.html
One engine runs at a time, behind a lock; every arm boots fresh, settles the card, and records its resolved flags, image digest and telemetry before the first request.
A note on the SGLang image. It is our own overlay: an Aug 17 nightly plus four
upstream pull requests that carry this model's SM120 kernels
(#36567,
#36556,
#36749,
#36750) and one local patch for
FP8 KV dequantisation. Those are other people's work and every SGLang number here
depends on them. There is no build script in this repo for that overlay;
docker/docker-compose.sglang.yaml documents exactly how the image is run.
Hardware
All numbers are measured on a single card, one server at a time:
| GPU | NVIDIA RTX PRO 6000 Blackwell (sm_120), 96 GB VRAM (~92 GB usable) |
| CPU | AMD Ryzen 9 9950X, 16 cores / 32 threads |
| RAM | 96 GB DDR5 dual channel (~91 GB usable) |
| llama.cpp | ghcr.io/ggml-org/llama.cpp:server-cuda13, build b10666 (4e97ac86e). qwen4exp support landed upstream in 6c84c7d5d, first tagged build b10658 |
| Model | unsloth/Qwen3.8-Flash-Next-GGUF:UD-IQ4_XS, 87.2 GiB, 176.94B total parameters |
| GPU layout | single GPU, -ngl 999, -ot per_layer_token_embd=CPU, no tensor split |
| Raw baseline | 109 tok/s decode, 1,955 tok/s prefill at a 2,048-token prompt |
Quick start
./scripts/download_models.sh          # UD-IQ4_XS, 93.7 GB, resumable, sha256-verified
./scripts/serve.sh                    # pulls the image on first run, waits for health
curl -s localhost:8000/health
No local engine build is needed. The upstream image carries qwen4exp support, and compose pulls it if it is not already present.
serve.sh wraps docker/docker-compose.yaml and resolves the HuggingFace
cache path for you:
./scripts/serve.sh --print                       # show resolved config, start nothing
./scripts/serve.sh --ctx 262144                  # full native context
./scripts/serve.sh --n-cpu-moe 42 --ctx 262144   # 24 GB-class card
./scripts/serve.sh --spec ngram-mod              # speculative arm
./scripts/serve.sh --down
How every test is run
The rules come first, because a number without its method is not a result.
- Scores come from saved files. Every request writes a result row to disk. Each score is computed from those rows by a recorded command. Scores are never copied from terminal output.
- We read the logs and check the generated text. A checker flags runs where the model did not do the workload: tool calls with no executor, stub answers, missing code, truncated turns. This matters — three early runs reported plausible speeds (158, 98 and 105 tok/s) while the model only emitted tool-call syntax and wrote no code. Speed alone cannot show that.
- One fresh server per arm, with a cooldown. A settle routine waits for the previous arm's VRAM to be released and for the card to cool to 42 °C or less, then holds a floor delay. A hot card clocks lower, so back-to-back arms would measure order, not configuration.
- We repeat and reverse the order. Two-configuration tests run A-B-B-A, and the order effect is reported — 0.56% for the placement test.
- The GPU is monitored during every arm. Temperature, power, clocks and throttle flags per arm; DCGM profiling counters for tensor-pipe, GPU-memory and PCIe activity. A thermal throttle voids the arm.
- The sampler must match the mode, checked against the model card before each workload test.
- Every option is asserted before the run — tensor placement, context, expert offload, microbatch, batch, parallel slots, GPU layers, loading mode, lazy reads, KV layout. A mismatch fails the arm before any request is sent.
Every arm walks the same pipeline:
flowchart LR
A["GPU cool-down<br/>≤ 42 °C + settle"] --> B["Fresh server<br/>this arm's flags only"]
B --> C["Record resolved config<br/>compose.txt + /props"]
C --> D{"Matches model card<br/>and arm intent?"}
D -- no --> X["Arm voided"]
D -- yes --> E["Run workload<br/>A-B-B-A order"]
E --> F["Check the text<br/>tool calls · stubs · repetition"]
F --> G["Telemetry verdict<br/>temp · clocks · DCGM"]
G --> H["Publish"]
Sampler values, from the model card
| Parameter | Thinking | Non-thinking |
|---|---|---|
| Temperature | 1.0 | 0.7 |
| top-p | 0.95 | 0.80 |
| top-k | 20 | 20 |
| min-p | 0.0 | 0.0 |
| Presence penalty | 0.0 | 1.5 |
| Repetition penalty | 1.0 | 1.0 |
The five workloads
No test uses live traffic. Every run of a test sees the same input.
| Workload | What the model receives | Used by |
|---|---|---|
| Speed sweep | Real code-problem text (101 LiveCodeBench problems) cut to exact prompt lengths, 256 → 245,760. Greedy, fixed output length, prompt cache off | ladder, placement, load mode, microbatch, quant |
| llama-bench | The tool's own built-in tests (pp512, pp4096, tg128) | ladder cross-check |
| Coding conversation | Fixed requests that build one app step by step, as one growing conversation. Model-card sampler | speculation, preserved reasoning |
| Concurrent load | Unique ~4,000-token prompts, exactly 256 output tokens, cache off, 1–16 at once | concurrency |
| Recall document | Generated document up to 245,760 tokens with three planted facts at three depths, graded by exact checkers | long-document recall |
Why not greedy sampling for workload tests
Greedy (temperature 0, top-k 1) promises identical output between arms. On this engine it does not deliver that: with speculation as the only difference, output diverged on the first turn. Speculation verifies several tokens per forward pass, so the arithmetic batches differently and a near-tie token choice can flip. Workload tests therefore compare decode rates under the model-card sampler. Fixed-length synthetic sweeps still use greedy with a pinned output length, where the sampler cannot change how much work is done.
Results
Machine-readable evidence is under results/; each test names its
directory below. results/CONFIGS.md lists the exact
server configuration of every one of the 42 server starts, generated from the
saved artifacts.
The lookup table belongs in system RAM
Most model weights feed large matrix multiplications. The PLE table is different: for each token the model fetches a few small rows by address, with no matrix multiply.
flowchart LR
G["87.2 GiB GGUF<br/>176.94B params"] --> S{"-ot per_layer_token_embd=CPU"}
S -->|"matrix-multiply weights · 60.7 GiB"| V["GPU VRAM<br/>+ 10.3 GiB KV at 262K"]
S -->|"PLE lookup table · 27.2 GiB"| R["System RAM<br/>row fetch by address"]
| Part | Params | Size | Fast placement |
|---|---|---|---|
| Expert weights | ~120 B | 60.7 GiB | GPU VRAM |
| PLE lookup table | ~51 B | 27.2 GiB | System RAM (CPU) |
| 262,144-token context | — | 10.3 GiB | GPU VRAM |
How it runs: four server starts in A-B-B-A order; the only change is
per_layer_token_embd=CPU or =CUDA0. One warm-up and three measured requests
at a 2,048-token prompt, context 32,768 in both arms (the GPU placement does not
fit 262,144 with all expert layers on the card).
| PLE placement | GPU memory | Host memory | Prefill tok/s | Decode tok/s |
|---|---|---|---|---|
| System RAM / CPU | 63,407 MiB | 27.2 GiB | 1,967.9 | 108.5 |
| CUDA0 / GPU | 90,927 MiB | 0.4 GiB | 575.7 | 1.95 |
Decode is 55.6× slower with the table on the GPU; prefill 3.4× slower. The memory columns prove the placement moved. Decode pays a per-step CPU↔GPU cost on every token, so it slows 55.6×; prefill batches many tokens per step and slows only 3.4×.
results/corrections/20260830T145932Z_PLE-01/
What it runs like on the card you own
VRAM is software-limited to reproduce smaller cards' capacity, not their bandwidth. Expert layers move to system RAM until the model and that tier's largest servable context fit.
| Usable VRAM | Closest setup | Expert layers in RAM | Loading | Prefill 2K | Decode 2K | Long-context decode |
|---|---|---|---|---|---|---|
| None | CPU only | all | mmap | 183 | 8.3 | — |
| 8 GiB | 3060 / 4060 | 48 of 48 | mmap | 232 | 35.7 | — (16K max) |
| 16 GiB | 4060 Ti / 5060 Ti | 45 of 48 | mmap | 249 | 37.9 | 20.6 @ 123K |
| 24 GiB | 3090 / 4090 | 42 of 48 | mmap | 260 | 39.0 | 14.9 @ 245K |
| 32 GiB | 5090 | 36 of 48 | mmap | 292 | 42.2 | 15.4 @ 245K |
| 48 GiB | 2× 3090 | 23 of 48 | RAM resident | 747 | 51.7 | 17.0 @ 245K |
| 96 GiB | this card | 0 of 48 | RAM resident | 1,955 | 109.1 | 21.6 @ 245K |
Not every tier can use the same loading mode. The 8–32 GiB tiers offload so
many expert layers that resident loading would need more system RAM than this
machine has, so they use mmap. Only 48 and 96 GiB run --load-mode none.
The tiers converge as the prompt grows. At 2,048 tokens the 96 GiB tier decodes 2.8× faster than the 24 GiB tier; at 245,760 tokens the lead is 1.45×. Long context costs every tier, and the fastest tier most.
Prefill is what the VRAM actually buys. At a 2K prompt the 96 GiB tier processes prompts 8.4x faster than 8 GiB, against 3.1x for decode. Prompt processing runs every weight through the GPU, so resident layers do compute-bound work; decode only streams the ~2.4B active expert parameters per token, which system RAM can feed. Your GPU buys reading speed; your RAM decides whether the model runs at all.
report.html has the per-tier charts, all 38 measured points with TTFT, and the
llama-bench cross-check. results/tier_full/, results/cpu_only/.
16 GiB is omitted from the two line charts for legibility; it tracks 24 GiB within 4%. Five is also the most steps the blue ordinal ramp holds while keeping adjacent tiers distinguishable.
Loading mode: mmap or RAM resident
How it runs: the 48 GiB tier again, identical tensor placement, context and microbatch — only the loading method changes. mmap runs cold and again warm.
| Prompt tokens | RAM resident | mmap 1st | mmap 2nd | 2nd vs resident |
|---|---|---|---|---|
| 2,048 | 746.7 | 394.9 | 405.8 | 54% |
| 8,192 | 747.2 | 407.4 | 392.3 | 52% |
| 32,768 | 723.9 | 405.9 | 404.3 | 56% |
| 131,072 | 618.5 | 365.5 | 366.2 | 59% |
The ladder shows a 2.6× prefill step between 32 and 48 GiB. Two things change there: VRAM and loading mode. Separated: resident loading is 1.87×, more VRAM is 1.39×, and 1.39 × 1.87 = 2.60 — the whole step. Decode is unaffected by loading mode (ratio 0.998).
Before buying more VRAM, check whether the machine has enough free system RAM
to use --load-mode none.
results/mmap_control_p1/, results/mmap_control_p2/,
results/corrections/20260830T151444Z_LOAD-01/
Microbatch size
How it runs: only -ub changes — 256, 512, 1,024, 2,048 — ascending then
descending, fresh server each time, context 32,768, no expert offload.
| Microbatch | Prefill tok/s | Decode tok/s | GPU memory | vs 512 |
|---|---|---|---|---|
| 256 | 1,555.5 | 108.66 | 63,231 MiB | −21.1% |
| 512 | 1,972.3 | 108.50 | 63,407 MiB | baseline |
| 1,024 | 2,324.1 | 109.07 | 63,759 MiB | +17.8% |
| 2,048 | 2,579.3 | 109.02 | 64,465 MiB | +30.8% |
Prefill-only: decode spans 0.8% across the sweep. Returns diminish (+26.8%, +17.8%, +11.0%), so most of the gain is in by 1,024. The cost is 1,058 MiB from 512 to 2,048 — free on this card, but on a small card that memory competes with context and expert layers.
results/corrections/20260830T180949Z_UB-01/
n-gram speculation
How it runs: the same three-turn coding conversation in thinking mode with the model-card sampler; four pairs with alternating order, fresh server per arm, output text checked per arm. Score = total generated tokens ÷ total decode time.
| Configuration | Run 1 | Run 2 | Run 3 | Run 4 | Mean |
|---|---|---|---|---|---|
| Baseline | 79.7 | 91.1 | 86.8 | 81.5 | 84.8 |
| ngram-mod | 89.3 | 89.6 | 91.9 | 91.5 | 90.6 |
| Draft acceptance | 43.2% | 41.6% | 35.1% | 28.2% | — |
About +7% (84.8 → 90.6 tok/s), 95% CI on the difference +0.6 to +11.0 tok/s. Real but not large, and four runs per arm leave it imprecise. No DFlash or MTP draft model exists for this model; this is n-gram speculation only.
results/corrections/20260830T171252Z_SPEC-01-rate/,
results/corrections/20260830T182917Z_SPEC-01-rate/
One request does not saturate the GPU
Tensor-pipe activity runs 0.9% (8 GiB) to 13.3% (96 GiB); SM activity reaches 69% at 96 GiB. Neither the tensor pipeline nor the memory interface saturates.
Concurrency: two KV-cache layouts at the same total context (131,072) and the same 16 slots — one shared pool, or 8,192 tokens per slot. Two server starts per layout, three sweeps each, so every cell is the mean of six samples.
| Requests at once | Unified KV | Non-unified KV |
|---|---|---|
| 1 | 58.4 ± 0.4 | 56.2 ± 2.9 |
| 2 | 68.6 ± 0.3 | 71.6 ± 1.2 |
| 4 | 71.7 ± 1.8 | 82.2 ± 1.3 |
| 8 | 70.4 ± 2.2 | 87.1 ± 2.5 |
| 16 | 62.3 ± 3.0 | 90.3 ± 1.1 |
The shape matters more than the ratio: unified peaks around 4 concurrent then declines; non-unified keeps climbing to 16, where it is 1.45× faster in aggregate. At one or two requests the layouts match within noise — the difference only appears under load. Individual requests slow either way, from ~104 tok/s at one to 10–12 tok/s at sixteen.
results/corrections/20260830T193552Z_CONC-01/
Preserved reasoning — an early look
Both arms run in thinking mode with the model-card sampler. The flag controls one thing: whether earlier turns' reasoning is sent back in later prompts. The model still generates reasoning every turn in both arms.
| Keep prior reasoning | Drop prior reasoning | |
|---|---|---|
| Prompt tokens recomputed | 267 | 18,403 |
| Prompt tokens from cache | 132,972 | 18,183 |
| Turn-5 prompt length | 63,223 | 18,387 |
| Decode, turn 1 → 5 | 110.2 → 48.9 | 96.0 → 65.5 |
Keeping reasoning makes the history append-only, so the server recomputes almost nothing — 69× fewer prompt tokens. But the prompt grows to 63,223 tokens by turn 5 and decode ends 25% lower. One run per arm, so this is a direction, not a magnitude. More measurement is planned; the result will go in the comments under the video.
results/corrections/20260830T200958Z_THINK-01/
Long-document recall after server reuse
How it runs: three facts are hidden in a long generated document — an access code, a number a later sentence corrects, and a date among decoys — at three depths. The model is asked to find each one. Then one different large request goes to the same server. Then the same questions are asked again. Exact checkers grade every answer, and the checkers were first proven able to fail.
| Document length | Before other work | After other work |
|---|---|---|
| 32,768 (1 and 4 slots) | 36/36 | 36/36 |
| 131,072 | 9/9 | 9/9 |
| 245,760 | 9/9 | 9/9 |
| Total | 54/54 | 54/54 |
Every answer stayed correct. An upstream project reported recall errors in a similar situation on a different GPU backend; that behavior did not appear here on CUDA.
results/slot_reuse/
Quant comparison
| UD-IQ4_XS | UD-Q4_K_XL | |
|---|---|---|
| Size | 87.2 GiB | 103.7 GiB |
| Decode @2K | 109.1 | 105.4 |
| Configured context | 262,144 | 32,768 |
| Largest tested prompt | 245,760 | 24,576 |
Q4_K_XL costs 3.4% decode for 19% more model and reduces the context this card can hold. Its real context ceiling was not probed. Output quality was not measured for either quantization.
results/q4kxl/
The configuration that matters
-ot per_layer_token_embd=CPU   # the 27 GiB lookup table.
                               # On the GPU instead: 55.6x slower.
--load-mode none               # copy host-side weights into RAM instead of mmap:
                               # 1.87x prefill here. Needs room in system RAM.
--tensor-read-lazy off         # 'auto' silently streams any tensor >4 GiB from
                               # disk. The largest PLE tensor is ~25 GiB.
--n-cpu-moe N                  # expert layers kept in system RAM.
                               # 0 at 96 GiB VRAM; all 48 at 8 GiB VRAM.
-ub 2048                       # +30.8% prefill vs 512 for +1,058 MiB, measured.
                               # Use 1024 (+17.8%, +352 MiB) if VRAM is tighter.
--parallel 1                   # one user. For 8+ concurrent users prefer the
                               # non-unified KV layout.
Benchmarks — run them yourself
./benchmark/tier_full.sh              # the hardware ladder
./benchmark/mmap_control_v2.sh        # loading mode, cold and warm
./benchmark/cpu_only.sh               # no GPU at all
./benchmark/slot_reuse_long.sh        # long-document recall
uv run benchmark/slot_reuse.py --selftest     # checkers must be able to fail

./benchmark/correction_run_v2.sh --execute --plan-id CORRECTION-R1 --only PLE-01
./benchmark/correction_run_v2.sh --execute --plan-id CORRECTION-R1 --only UB-01
./benchmark/spec01_rate.sh --execute --plan-id CORRECTION-R1
./benchmark/conc01.sh   --execute --plan-id CORRECTION-R1
./benchmark/think01.sh  --execute --plan-id CORRECTION-R1
Each controller prints its plan and exits unless given --execute and the plan
id. Every sweep calls gpu_settle() between arms: it waits for the previous
arm's VRAM to be released and for the card to cool, then holds a floor delay.
What this does not prove
- Capping VRAM reproduces capacity, not bandwidth. A 24 GiB cap on this Blackwell card overstates a real 3090 (~1.6 TB/s vs 936 GB/s). The 5090 row is the one fair proxy; multi-GPU rows are an optimistic upper bound.
- Most long-context cells are a single run. Short-prompt arms repeat to 0.2% decode and 0.7% prefill, but a 245,760-token cell costs ~18 minutes and ran once.
- The mmap penalty is measured, not explained. The two mmap passes agree within 0.5%, so the file cache is not the obvious cause. A background download ran during that control at ~54 MiB/s; both passes shared it.
- The recall test restarts the server once per document length. Only the first probe after each start runs on a never-used server.
- The speculation gain is ~+7% with a wide interval (+0.6 to +11.0 tok/s, 95%) from four runs per arm. Draft acceptance also declined across runs, 43% → 28%, unexplained.
- The preserved-reasoning comparison is one run per arm — direction and mechanism, not a settled magnitude.
- The microbatch sweep covered one configuration: context 32,768, no expert offload, this card.
- Quant quality was never measured. IQ4_XS versus Q4_K_XL is speed and reach only.
Repo layout
scripts/download_models.sh   sequential, resumable, sha256-verified. aria2c, not
                             `hf download`, which cannot resume.
scripts/serve.sh             quant name -> cache path -> server.
docker/best.*.yaml           one standalone compose file per winning
                             configuration, every value written out and the model
                             paths pinned. `docker compose -f <file> up -d`.
docker/                      one compose file per engine: docker-compose.yaml
                             (llama.cpp), .sglang.yaml, .freetoken.yaml, plus the
                             FreeToken image and the no-speculation override.
benchmark/                   the first report's harnesses. See benchmark/README.md.
bench/                       the second report's harness: run.sh and the engine
                             library, the workload .conf files, the accuracy and
                             boot/cache/greedy arms, and the report generators
                             (report_data.py -> build_report.py, make_charts.py).
artifacts/                   the saved runs the second report reads. See
                             artifacts/README.md for the map and the void list.
results/                     saved evidence for the first report, and the tier
                             experiment's verdicts and cgroup traces.
assets/                      the charts for both reports, as dark PNG files.
report.html                  first report: one engine, why the model fits.
engine_benchmark_report.html second report: three engines, self-contained.
pyproject.toml, uv.lock      the pinned Python environment (uv).
References
Model and weights:
- Qwen3.8-Flash-Next: https://huggingface.co/Qwen/Qwen3.8-Flash-Next
- Official announcement: https://qwen.ai/blog?id=qwen3.8-flash-next
- Official repo: https://github.com/QwenLM/Qwen3.8-Flash-Next/
- Unsloth GGUFs: https://huggingface.co/unsloth/Qwen3.8-Flash-Next-GGUF
- llama.cpp qwen4exp support, merged as
6c84c7d5d; first tagged buildb10658 - Independent quality benchmarks: https://artificialanalysis.ai/models/qwen3-8-flash-next
- SGLang cookbook, RTX PRO 6000 recipes (both checkpoints; the RadixArk one is measured here): https://docs.sglang.io/cookbook/autoregressive/Qwen/Qwen3.8-Flash-Next#hw=rtx6000&variant=default&quant=nvfp4&strategy=low-latency&nodes=single&pleOffload=on
Architecture and prior art:
- Qwen Team — On the Design of Qwen3.8-Next Architecture: Evaluation, Efficiency,
and Training Stability (2026) —
tech_report.pdf.
Source for the GDN equations, Qwen Sparse Attention, the gated residual, and
the 51.2B-parameter n-gram embedding table — the tensor llama.cpp names
per_layer_token_embdand this study calls the PLE table. - SGLang team — Qwen3.8-Flash-Next: Day-0 Support in SGLang (2026-08-26) — https://www.lmsys.org/blog/2026-08-26-qwen-flash-next. The host-RAM PLE path on datacenter GPUs: weights 83.91 → 60.45 GiB per GPU (−23.46 GiB), KV capacity 1.84M → 3.28M tokens (+78.54%), throughput −0.07%. This study measures the same placement question on one consumer-class card.
- Yang, Kautz & Hatamizadeh — Gated Delta Networks: Improving Mamba2 with Delta Rule (ICLR 2025) — https://arxiv.org/abs/2412.06464. Background for the gated delta rule: decay plus targeted memory correction. 36 of this model's 48 blocks are gated-delta-net layers.
Previous studies in this series:
- DeepSeek V4 Flash + DSpark: https://github.com/lukaLLM/deepseek-v4-flash-dspark-rtx6000pro
- Qwen 27B speculative decoding: https://github.com/lukaLLM/DFlash_Qwen3.6_27B_LlamaCPP
Similar repos
Languages
HTML
61.8%
Shell
20.6%
Python
16.6%