
A benchmark tool for line-of-code counters. Ensures fair and equal work, records the machine's and the environment's state, and can provide useful insights like syscalls, memory usage etc.
Rust
0
87 commits
updated Sep 13, 2026
See what people are saying (1)
README
linebench


A benchmark harness for line counters. Every counter on the same tree, on equal work, with the state of the machine recorded beside every number: the background load, the power scheme, the antivirus, the commit the corpus sits on, and a control run at both ends that says whether the machine moved while it measured.
| counter | wall | vs fastest | user cpu | system cpu | parallelism | lines/s | files | lines |
|---|---|---|---|---|---|---|---|---|
| counter a | 270 ms ± 20 | 1.00x | 1.87 s | 1.73 s | 13.33 | 133.3M | 63,700 | 36,000,000 |
| counter b | 420 ms ± 24 | 1.56x ± 0.14 | 2.90 s | 2.60 s | 13.10 | 85.7M | 63,700 | 36,000,000 |
| counter c | 564 ms ± 28 | 2.09x ± 0.19 | 3.30 s | 4.47 s | 13.78 | 63.8M | 63,700 | 36,000,000 |
The shape of the answer over a tree the size of the Linux kernel, names left out and numbers rounded. The runs worth reading are the ones each counter publishes in its own repository.
The counters are data, one counters/<name>.toml each, and linebench never builds one: it
fetches the release, hashes it, and writes the hash into the record. Today it knows cloc,
mezura, scc and tokei.
Contents
- Install
- Your first run
- The commands
- Three ways to use it
- Reading the numbers
- Equal work and the machine
- Where results go
- Settings
- Counters and corpora
- Tests
- Licence
Install
cargo install linebench
Or take the archive for your system from the
releases page.
Every counter and corpus definition is built into the binary.
It needs git, hyperfine, curl or wget, and tar on PATH. The last two come with every Unix, and Windows 10 and 11 carry both. cargo is needed only for a counter that publishes no binaries and has to be built (tokei), and perl for one that ships as a script (cloc on Linux and macOS).
| system | command |
|---|---|
| Debian, Ubuntu | sudo apt install hyperfine |
| Fedora, RHEL | sudo dnf install hyperfine |
| Arch | sudo pacman -S hyperfine |
| openSUSE | sudo zypper install hyperfine |
| Alpine | apk add hyperfine |
| Windows | winget install sharkdp.hyperfine |
| macOS | brew install hyperfine |
| anywhere else | cargo install hyperfine |
Your first run
linebench fetch --counters all --corpus cpython
linebench status
linebench check cpython
linebench noise cpython
sudo linebench run cpython
The first line downloads the four counters and clones one of the shipped corpora at its pinned
commit.
The second says what arrived and where.
The third proves the machine can measure: every counter runs once and its counts are checked
against the corpus.
The fourth measures the noise: the background cpu, the spread of a few runs, and whether the
machine is steady enough to benchmark.
The fifth measures, elevated so the power scheme can be set for it.
linebench keeps a directory of its own on every machine, made on first use: %APPDATA%\linebench
on Windows, ~/Library/Application Support/linebench on macOS, ~/.local/share/linebench on
Linux.
By default, the binaries land in counters/ under it, the checkouts in corpora/<name>,
linebench.conf sits beside them, copied from linebench.conf.example, and results go to
results/ in the directory you run from. Each of those can be moved with a flag, an environment
variable or a line in the conf, and Settings has the table.
Corpora take space: 190 MB for cpython, 990 MB for the jdk and 2.0 GB for the kernel, all three shallow clones.
Keep the corpus and the counters on a local disk. Measuring across /mnt from WSL, or over a
network share, measures the mount.
The commands
linebench --help lists every flag, and --help after a command prints that command alone.
fetch
linebench fetch --counters all --corpus all
linebench fetch --counters tokei
linebench fetch --corpus all --corpus-path /data/corpora
Downloads the counter binaries and clones the corpora. Each counter comes at the version its
definition declares, each corpus at the commit its definition pins. With neither named it refuses
and lists what there is. What arrived, and its sha256, goes into linebench-fetched.toml beside
the binaries, and a second fetch answers "already here" for what matches.
On Linux and macOS it refuses to run as root, so the files it writes belong to you. An elevated
Windows terminal is the same user with the same %APPDATA%, so there it runs. Where there is no
ordinary user, as on a CI runner, --allow-elevated lifts the refusal.
fetch asks the GitHub API which files a release holds, and anonymous calls are limited per
address, a limit shared CI runners hit. A token in GITHUB_TOKEN or GH_TOKEN lifts it. The
token goes to that one call, and downloads are made without it.
linebench fetch --counters all --latest
--latest takes the newest release of each counter and pins that version in the manifest. The pin
holds on this machine until the definition reaches or passes it, when every command says the pin
is set aside. A plain fetch keeps the pin. To drop it, remove the counter's entry from
linebench-fetched.toml and fetch again.
status
linebench status
What this machine holds and where. It only reads.
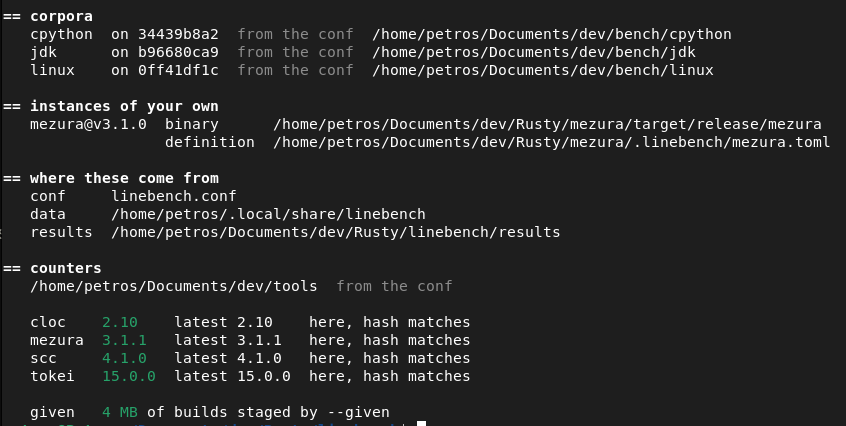
A version is green while the channel publishes nothing newer and yellow when it does. The line
under a corpus says which commit its checkout sits on, and 13 name clashes on the kernel is a
filesystem that keeps one name of a pair differing only in case, xt_CONNMARK.h and
xt_connmark.h, so git calls those files changed for as long as the checkout lives. The three
paths at the top are where every line below them came from. Every [given] entry in the conf is
listed too, with the build and the definition it names and whether they are there, since nothing
fetches those and status is the only place that says they exist.
check
linebench check linux
linebench check cpython --counters cloc,mezura,scc,tokei
linebench check linux,cpython
linebench check all
Answers "is this machine ready to measure". Every instance runs once per table against the real corpus, the counts are read back and held against the corpus, and hyperfine and git are tried:
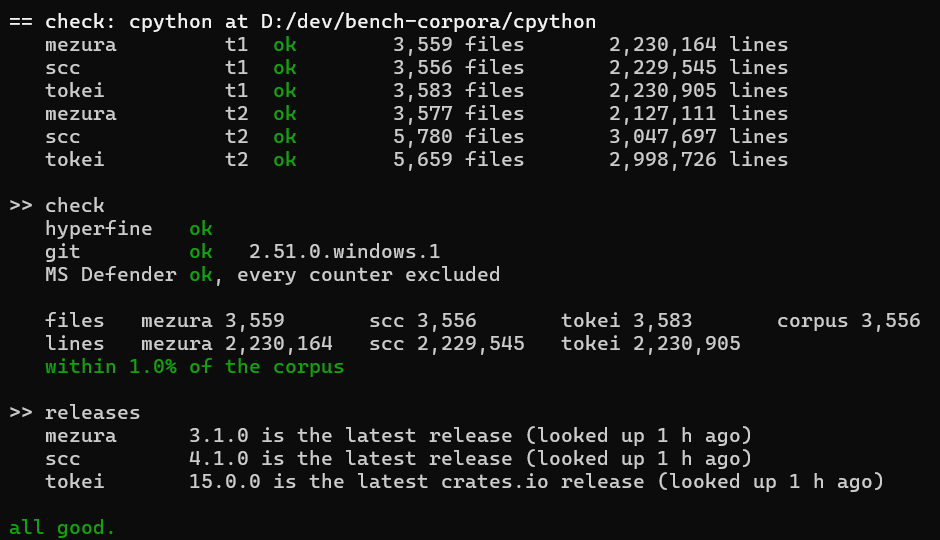
The corpus number is the reference: the file count the corpus definition declares for its
commit, files = 3556 above, so "who is off" has an answer with one instance as much as with two.
Lines have no such reference and are compared between instances. The tolerance belongs to the
corpus, tolerance = "1%", since how many odd files a tree holds is a property of the tree.
A count of zero fails, and so does one outside the tolerance: the definition names a language the
tree does not have, or selects fewer files than the others. This is what catches a definition that
turns off too little: cloc on Linux matches an extension by its exact case, so --include-ext=s
skipped the 1,350 .S files of the kernel and came out 2.2% under the corpus.
The releases lines say whether the version each definition pins is still the newest published,
one lookup per counter on the channel it fetches from. Answers are cached six hours beside the
binaries. A lookup that fails prints why, in yellow, and the check passes all the same. Nothing is
fetched here. Over a list of corpora the block is printed once, after the last of them, and covers
every counter any corpus ran, since the answer does not change from one corpus to the next.
A list, linux,cpython, or all for every corpus this machine holds, is checked one corpus at a
time, each under a heading of its own.
noise
linebench noise linux
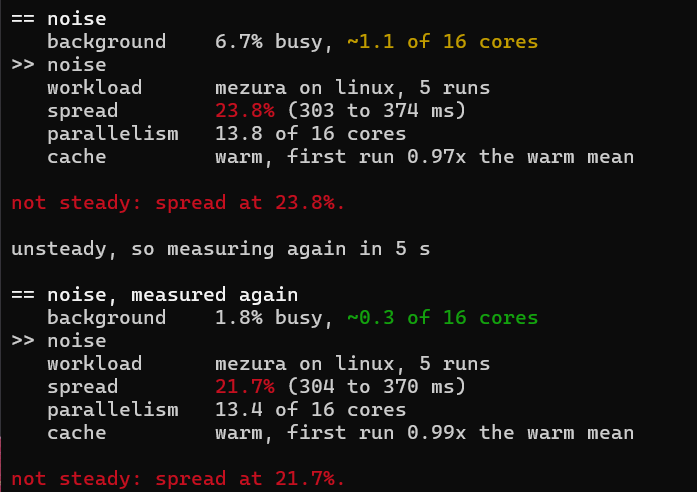
Answers "is this machine steady enough to benchmark right now". It samples the system-wide cpu for
seven seconds with nothing of ours running, then runs the control five times, the first one cold
on purpose: about fifteen seconds with mezura on the kernel, minutes with cloc. --runs changes
how many.
| steady | relatively steady | somewhat unsteady | not steady | |
|---|---|---|---|---|
| background | < 0.75 cores | 0.75 to 1.5 | 1.5 to 3 | 3 cores and up |
| spread | < 5% | 5 to 10% | 10 to 15% | 15% and up |
--control picks the instance it times, --runs how many times and --settle the quiet before
each. The first two verdicts exit 0 and the last two exit 1, so a script can gate on it. An
unsteady verdict is measured once more after five seconds, background sample included, and the
second verdict is the one that counts. A real run samples the background the same way and records
it.
run
sudo linebench run linux
linebench run linux --counters mezura,scc,tokei
linebench run cpython --runs 20 --warmup 5 --settle 5
linebench run linux --against 20260904-130000
sudo linebench run linux,cpython
sudo linebench run all
The measurement. What it prints is Reading the numbers, where it lands is Where results go.
On Windows open the terminal with "Run as administrator", elsewhere use sudo. Elevated, it sets
the cpu governor to performance (Linux) or the power scheme to High performance (Windows) and
puts it back when the run ends, whether it finishes, fails or is interrupted with Ctrl-C. Before
it changes anything it prints the command that puts it back by hand, for a run that gets killed
outright. Unelevated it prints what it would have changed and asks before doing any work: --yes
answers that question, --no-prep skips the whole thing even when elevated, and with no terminal
attached it carries on.
--runs, --warmup and --settle are hyperfine's, per command. --against <stamp> adds a
second comparison block read against that one run. --keep-raw holds on to each counter's JSON
and plain output, which a plain run deletes once the counts are read.
Several corpora in one command, linebench run linux,cpython or linebench run all, are measured
one after the other in the same process. The machine is prepared once and put back when the last
one ends, each corpus keeps its own run directory and its own record, and every summary is printed
again together at the end. all is every corpus definition with a checkout on this machine, and
the ones missing are named in a line of their own. A corpus that fails is named and the rest carry
on, and the exit code is 2 when one of them did. --against takes one corpus, since a stamp
belongs to one.
An instance is a definition, a binary and a name in the table. By default every counter definition
is one instance, named after itself, and so is every [given] entry in the conf. --counters
picks a subset and fixes the order.
The control is the instance timed alone at the start and at the end. Its shift is read as the
machine's own movement, and it is also what noise times. control = "mezura" in the conf names
it for every run on the machine, --control for one run, and with neither it is the first
instance named, which with no --counters is the first definition alphabetically that the corpus
does not skip, today mezura. Keep the control the same across the runs you want compared: "since
the last run" reads every change against the control's own shift, and that shift is known only
when an earlier run timed the same control build.
insights
linebench insights linux
Measurements that each need executions of their own, kept out of a run because they would lengthen and disturb it. What each system can answer:
| insight | Linux | Windows | macOS |
|---|---|---|---|
| the floor | yes | yes | yes |
| peak memory and the curve | yes, /proc/<pid>/status | yes, GetProcessMemoryInfo | no samples yet |
| the counts of system calls | yes, strace -c -f | no | no |
The floor is what a counter costs before it has counted anything. Three timings per instance,
thirty runs and no settle: the version answer, <counter> --version, and the two ready floors,
the run's own t1 and t2 flags over a directory holding no files, made in the temp directory and
removed when the command ends.
== floor summary
   instance  --version      ready t1       ready t2
   mezura    10.9 ms ± 1.0  16.7 ms ± 1.1  16.5 ms ± 1.1
   scc       21.3 ms ± 1.7  18.7 ms ± 1.8  19.2 ms ± 2.3
   tokei     5.5 ms ± 0.6   11.2 ms ± 0.8  11.1 ms ± 1.2

   --version       the binary answering its version flag and quitting
   ready t1, t2    the same binary over a target with no files, its report printed
The ready floor is everything a counter does with nothing to count, its empty report included,
and no run subtracts it. The two columns of one row say how much of a floor is the runtime it
ships on: tokei answers its version in 5.5 of the 11.2 it needs to be ready, cloc in 141 of its
167, because a Perl interpreter comes up before any of cloc's own code. Down a column they say
less, since each counter stops answering --version at a point of its own. Two instances sharing
one binary give the same version command, so it is timed once and printed on both rows. The times
are wall clock and the table carries no cpu columns.
The memory is one execution per instance over the corpus with the t1 flags, outside hyperfine
and untimed. linebench starts the counter and asks the system every 2 ms what it holds:
GetProcessMemoryInfo on Windows, /proc/<pid>/status on Linux. The peak is exact, from
PeakWorkingSetSize and VmHWM, so a peak between two samples survives.
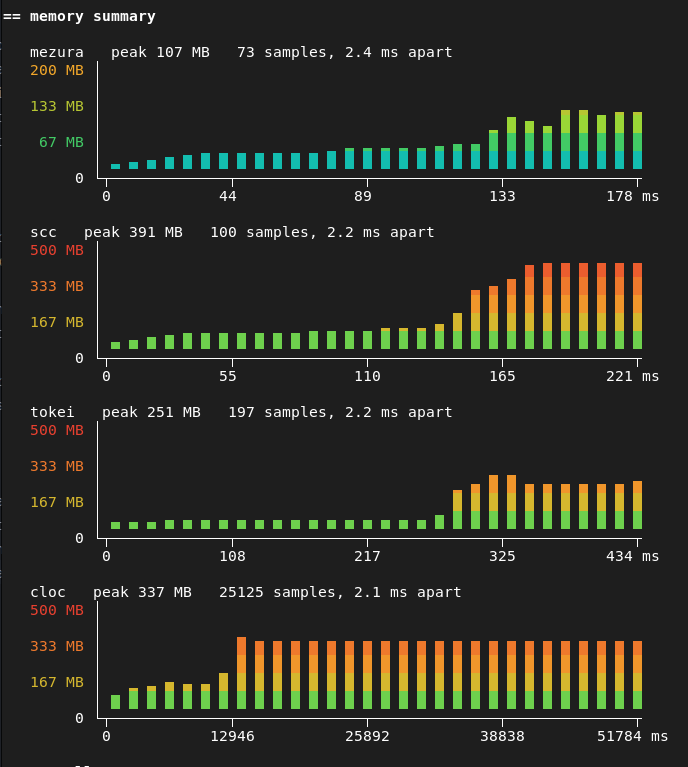
Each panel has an axis top of its own, the first of 10, 20, 50, 100, 200, 500 MB or 1 GB the peak fits under, so heights compare directly only between panels with the same top, and the peak printed above each one is what to compare. The time axis includes the polling and a cold start, so it runs longer than a timed run.
The system calls are strace -c -f once per instance, grouped into families, with the calls
of a family under it and what each one answered with an error:
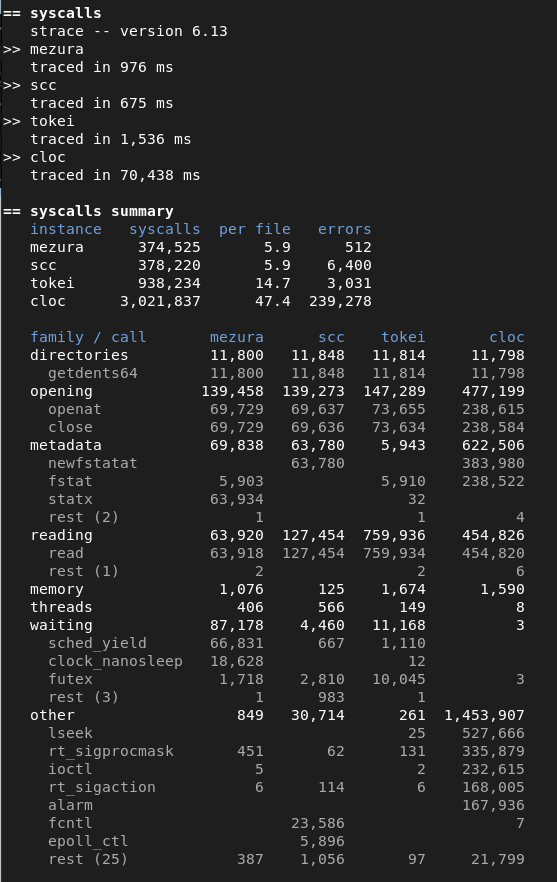
--counters picks the instances and their order, and --yes carries on when a tool a section
needs is missing. --only floor,memory,syscalls names which of the three to measure, in any
combination, and with nothing named all three run. A part left out is named as left out in the
record and on the page, so an empty section is never read as a measurement that found nothing.
A session lands in results/insights/<corpus>/<system>/<stamp>/. insights.json carries its own
machine block, the antivirus state, the corpus with its commit and the instances measured, so it
stands on its own, and the hyperfine exports sit beside it. insights.md is the same session for a
reader: the machine, the corpus and the three tables above as they were printed. An --args
instance or a build of yours sends the session under results/insights/local/.
report
linebench report
linebench report --verify
Builds results/README.md out of every record under results/. A run writes it too, so report
is for after a directory was moved, copied in from another machine, or deleted. --verify builds
the page, says whether the one on disk is that page, names the lines that differ, and writes
nothing.
verify
linebench verify results/linux/windows/20260911-014803
linebench verify results/insights/linux/linux/20260911-021742
Reads a run back and holds its numbers against each other: every measurement against itself, the
derived columns against the ones they come from, the counts against their sum, equal work
re-judged, and the csv files rebuilt from the record. Where the hyperfine exports were published
too, every statistic is recomputed from the time of every single execution. The path is a run
directory, or the run.json inside it.
What one insights command wrote is read the same way. Name its directory, or the insights.json
inside it, and the floor is held against itself and against its exports, every memory curve
against the peak the system reported independently of the samples, every traced instance against
the calls it listed, and every number against the instances the session says it measured. A part
--only left out and measured all the same fails too.
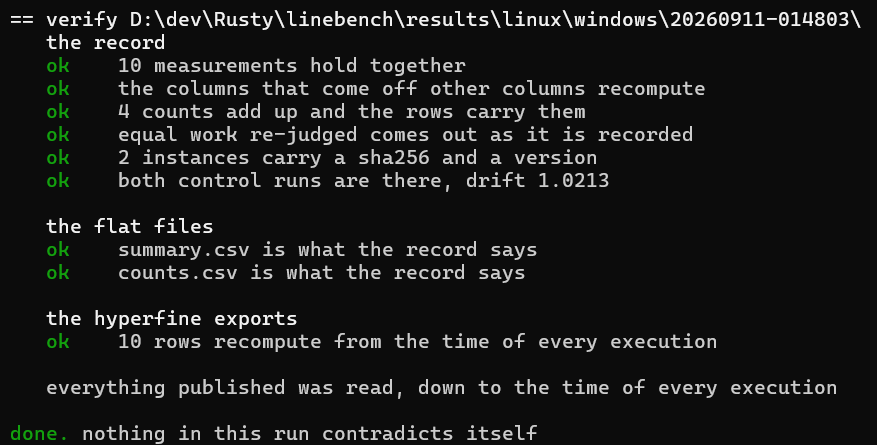
It prints what it could not read. A check that fails exits 1, and a missing file is reported as a gap and does not.
Three ways to use it
A tree of your own
Any directory, with --extensions naming the file extensions every counter is pointed at, so that
all of them do the same work:
linebench check /home/me/dev/myproject --extensions rs,toml
linebench run /home/me/dev/myproject --extensions rs,toml
The run is recorded as unpinned and named after the directory, and the counters' counts are
compared with each other, since there is no declared file count to hold them against. --extensions
is refused beside a corpus name, because a definition carries its own.
To measure a tree again and again, give it a corpus definition of its own, myproject.toml:
name       = "myproject"
extensions = ["rs", "toml"]
tolerance  = "1%"
linebench run myproject --add ./myproject.toml
Leave commit and files out to measure the tree as it stands. With remote and commit filled
in, fetch --corpus myproject clones it at that commit and every command refuses a checkout that
sits anywhere else.
A definition also puts it among the rest: linebench run linux,myproject --add ./myproject.toml
measures both in one go, and all takes it along once add in the conf names the file.
A counter of your own
One file, counters/<name>.toml, and --add reads it beside the built-in ones. The keys are in
Counters and corpora below:
linebench check cpython --add ./mycounter.toml
linebench run cpython --add ./mycounter.toml
--add takes a file or a directory of them, and repeats. A definition named like a built-in one
takes its place, and a line says so. add = ["<path>"] in the conf does the same for every run on
the machine.
A counter that publishes no release fetches nothing, so point linebench at the binary you have:
linebench run cpython --add ./mycounter.toml --given mycounter=/usr/local/bin/mycounter
A build of your own
A build of yours is an instance of its own, named <counter>@<tag>, so it stands in the table
beside the release it came from:
linebench run linux --counters mezura,mezura@dev --given mezura@dev=D:\dev\mezura\target\release\mezura.exe
The given binary is copied under given/<instance>/ in the counters directory before anything
reads it, fresh on every run, because the file cargo built measures slower than a plain copy of
itself and because the same name in the same directory is what gets the same antivirus treatment.
The copy is hashed and asked its version, and the record says given with the tag as its label.
It runs under the counter's own definition, or under one of its own when the flags of your build differ from the release's:
linebench run linux --counters mezura,mezura@dev --given mezura@dev=<path> --definition mezura@dev=D:\dev\mezura\.linebench\mezura.toml
Both fit in the conf, so the dev loop carries no flags:
[given."mezura@dev"]
binary     = "D:/dev/mezura/target/release/mezura.exe"
definition = "D:/dev/mezura/.linebench/mezura.toml"
An instance can carry arguments of its own, --args mezura@c16="--threads 4 16" for one run or
args = ["--threads", "4", "16"] in its [given] entry. They go right after the target, before
the languages and the same-work flags, in every invocation of that instance. With no binary of its
own the instance runs the release binary, so a [given] entry holding only args measures the
release with those arguments beside the release as it is. Arguments make an instance of their own,
so the name carries a tag.
A run holding any given instance is written under results/local/ and the page gives such runs
headings of their own, under the release ones, with the same sections. A [given] entry in the
conf joins every run that names no --counters, so for a run meant for the release tables comment
it out or name the release instances with --counters.
Reading the numbers
Each run measures two tables. Same work pins every instance to the corpus's languages and its own same-work flags, and the file and line counts beside the times, checked against the corpus, prove the work was the same. Out of the box runs every instance bare, so the ratio mixes speed with how much each one chose to do.
Every table is measured twice, once in each command order, and the numbers pool the two. How far
the orders disagreed is a trust check on the page. The control, the same binary timed at the start
and the end, gives the drift, and drift is the first thing to read.
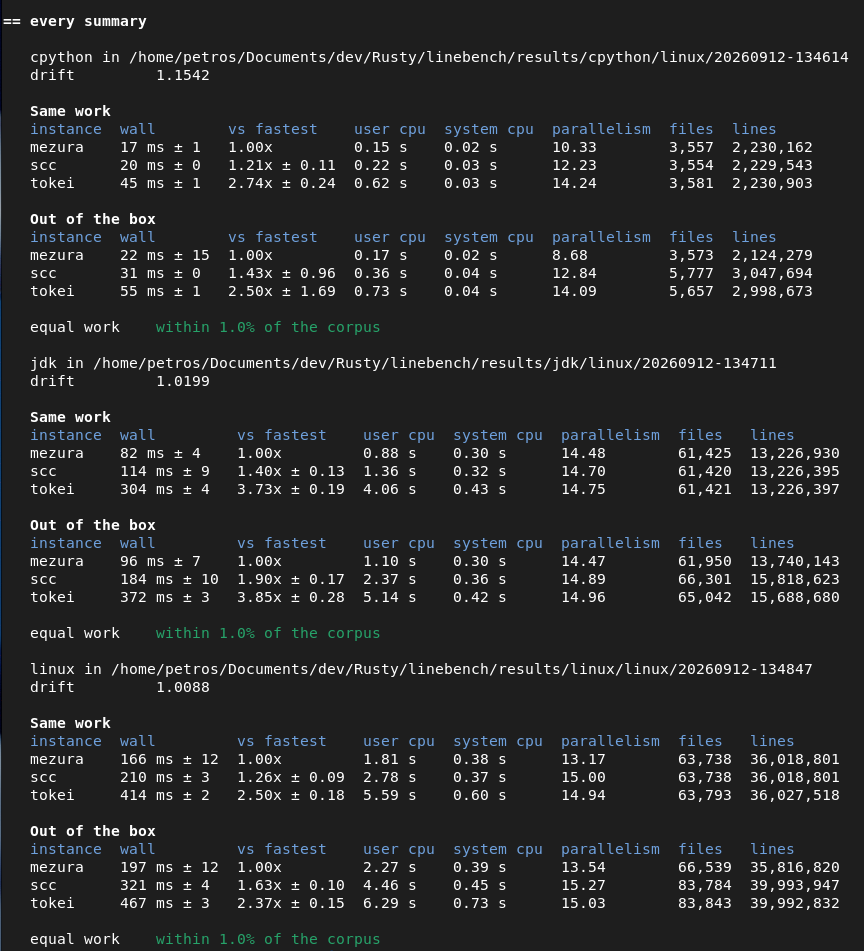
The ± on vs fastest is the σ of the ratio, taken from the two walls' σ by the propagation of uncertainty for a quotient of independent quantities, σ_r = r · √((σ_a/μ_a)² + (σ_f/μ_f)²), the formula hyperfine prints its own "times faster" with. Each wall's σ is the pooled one, both orders together, so the order effect is in the ratio's σ too. It is one σ, about two thirds of the probability: a ratio whose interval reaches 1.00 is within the noise of the fastest, and one whose interval stays clear of 1.00 is apart by at least that much. The fastest row prints a plain 1.00x.
At the end of a run, and on the page, since the last run compares every instance's same-work
time with its own newest earlier measurement on the same machine, at the same corpus commit and
with the corpus on the same disk, whatever else that run held. Earlier runs set aside for another
cpu, commit or disk are listed with the reason, and an instance with no earlier measurement gets
its row all the same. The heading says "same builds" when no compared instance's binary changed. A
changed one carries version 4.0.0 -> 4.1.0 on its line, or build a81c2e5 -> 9b7e4d0 when the
version stayed the same, as a rebuilt dev build does, and it is compared all the same.
The ± on each change is the σ of the ratio now/then by the same propagation, fed with each mean's own σ: a mean of n runs is known to σ/√n, and the two orders are pooled with half their gap kept whole. The run-to-run σ the tables print would be five times too wide for a question about two means. The control's shift is printed the same way as the machine's own movement, and "the machine itself moved" is said when that shift sits outside its own ±. A change is judged against it: "within the noise" means the change minus the machine's shift is inside the combined σ of the two, so a run with the same binaries on a quieter machine reads as within the noise on every line. A control that drifted 4% cannot know the machine's shift to better than about 2%, and the ± on its line says so. Everything else that differed between the two runs is listed, from the power scheme to the drift and the equal-work verdict.
--against <stamp> adds a second block under it, read against that one run whatever came between,
for the sum of a series of changes. The stamp is the run's directory name, as done. prints it.
Same rows and rules, with the machine's shift taken over the same span. A run on another platform,
over another corpus, on another cpu, commit or disk, or recorded after this one, is named as not
comparable with the reason, and a run that would be published cannot name a local one. The block
goes to the terminal and to notes.md, and stays off the page.
Equal work and the machine
Two counters are comparable while they do the same work and the machine treats them the same. Three things guard that.
The counts. Every table carries the files and lines each counter reported, held against the file count the corpus declares. Outside the tolerance the run still goes on, and the record and the page say what was found, because the times remain information, only no longer a comparison of equal work.
The JSON. --expect-identical mezura=mezura@dev (pairs, comma separated), a flag of run,
checks that two instances of one counter printed the same JSON, in both tables, before any timing
starts. The fields the definition lists as volatile (a timestamp, its version, its own timing)
are set aside, lists of objects are compared regardless of their order, and the first difference is
named with both values. The verdict is printed, kept in the record and shown on the page, and a run
where the two differ exits 1 once everything is written: the times still stand, the claim that the
work was the same does not.
The antivirus. On Windows the record carries the Defender state: real-time protection, and per
instance whether its process and its binary are excluded. Unequal exclusions refuse the run,
because files opened by an excluded process are never scanned and the comparison would measure who
escaped the antivirus. --allow-unequal-exclusions measures anyway and marks the record, the notes
and the page. Reading the lists needs an elevated shell, and unelevated the record says
needs admin.
The counters directory belongs to fetch for the same reason: a binary in it whose hash is not the
one fetch wrote is refused, with the two ways out, fetch again or measure it as a given instance.
Where results go
No official benchmarks live in this repository. There is one example run under
example-run/, and the variability between machines is too great for it to
say anything about yours. It is the same machine under two systems, Windows and native Linux: the
three shipped corpora and an insights session on each, plus a local run putting the mezura release
that fetch downloaded that day against a newer working build of it. Every section speaks for the
day it was measured and says nothing about where the counters stand today.
Each counter that uses linebench publishes results of its own in its own repository, which is where to see how the numbers move between machines.
results/
├── README.md
├── linux/linux/20260904-120000/
├── linux/windows/20260904-130000/
├── local/linux/windows/20260904-140000/
└── insights/linux/windows/20260904-150000/
One directory per corpus, then per platform, then per run, named by its UTC timestamp. Nothing is
ever overwritten. results/README.md is the page, rewritten after every run and on demand with
report: one section per machine, and under it the newest run over each corpus with its two tables
and its trust checks, biggest corpus first, then every run once there is more than one, the local
builds under headings of their own, and the methodology and the terms.
Inside a run directory, run.json is the record, self-contained and the one that is read back.
summary.csv and counts.csv are the same numbers flat, <phase>.json and <phase>.md are
hyperfine's own output, transcript.txt is everything the run printed, and notes.md is the
checklist to fill in by hand, with the since block under it. out/ holds every counter's JSON and
is deleted once the counts are read. Inside an insights directory, insights.json is the session,
insights.md the same session to read, and hyperfine's own output sits beside them for the floor
phase.
Settings
A flag beats an environment variable, which beats linebench.conf in the data directory. Every
flag belongs to the commands whose help names it, and a command refuses one that is not its own.
--dry-run, --help and --version go with anything.
| what | flag | environment | in the conf | default |
|---|---|---|---|---|
| what gets counted | the argument, a corpus name or a directory | LINEBENCH_TARGET | ||
| where the corpora sit | --corpus-path <dir>, a directory each under it, or one corpus's own checkout | a [corpora] entry, the checkout itself | corpora/<name> in the data directory | |
| what to count in a directory | --extensions rs,c | |||
| the counter binaries | --counters-dir <dir> | LINEBENCH_COUNTERS | counters = "<dir>" | counters/ in linebench's own directory |
| where results go | --out <dir> | LINEBENCH_OUT | out = "<dir>" | results/ in the current directory |
what insights measures | --only floor,memory,syscalls | all three | ||
| definitions of your own | --add <path>, repeatable | add = ["<path>", ...] | ||
| the control | --control <instance> | control = "<instance>" | the first instance named | |
| counters left out on this machine | skip = ["cloc"] | cloc | ||
| write nothing, anywhere | --dry-run | off |
control = "mezura"
skip    = ["cloc"]

[corpora]
linux = "D:/corpora/linux"
skip leaves counters out of every default set on this machine, whatever the corpus: check and
run leave them out and say so, and naming one in --counters runs it. fetch ignores it, since
a counter is downloaded only when asked for by name. A corpus definition carries a [skip] of its
own, per system, for a counter too slow over that one tree.
--dry-run goes with any command and leaves nothing behind. What the command would write, the
record, the page, the notes, the transcript, the hyperfine exports and any build staged by
--given, goes to the temp folder and is deleted at the end. No release is looked up and nothing
is downloaded, so a fetch only names what it would have taken. The machine is prepared as always,
so a dry run takes as long as the real one.
With no target named, a command that needs one refuses and prints the two forms it takes.
Counters and corpora
A counter is counters/<name>.toml. Its keys mirror the linejudge adapter where the idea is the
same (name, repository, version-flag, [acquisition], the [read] paths), so a block copies
between the two files unchanged:
name         = "scc"
repository   = "https://github.com/boyter/scc"
version-flag = "--version"

[acquisition]
channel = "github-release-asset"
name    = "boyter/scc"
version = "4.1.0"

[run]
args           = ["{target}"]
json           = ["--format", "json"]
languages      = ["-i", "{extensions}"]
same-work      = ["--no-gitignore", "--no-ignore", "--no-scc-ignore", "-c", "--no-cocomo",
                  "--no-config"]
same-work-note = "ignore files off, complexity and cost estimates off, no config file read"
scrub-env      = ["SCC_CONFIG_PATH"]

[read]
each     = "[]"
files    = "Count"
lines    = "Lines"
code     = "Code"
comments = "Comment"
blanks   = "Blank"
| key | what it says |
|---|---|
args | the command that gets timed, with {target} where the directory goes |
json | appended only for the capture that reads the counts |
languages | carries {extensions}, or {names} for a counter that spells languages by name |
[language-names] | that counter's name for each extension, matched whatever the case |
extension-case | exact for a counter that matches case, so {extensions} is spelled s,S; the default is any |
same-work | what the same-work table adds |
same-work-note | what the results page prints for it |
volatile | the fields of the JSON that differ between two runs, in the [read] path syntax, so --expect-identical can set them aside |
scrub-env | variables removed from the counter's environment |
[read] | where the counts sit in the counter's own JSON |
output | a compiled reader for JSON the paths cannot reach, tokei-json today, in place of [read] |
The shipped [language-names] covers the extensions the shipped corpora name, and a corpus of
your own carrying another extension adds a line for it. Every bucket in [read] beyond code and
comments is read by name, so one block covers a counter that prints blanks in one mode and
extra in another, and the buckets have to add up to lines.
The channels are github-release-asset (the file for this system and architecture is picked by the
words in its name, and the published checksums are checked), github-release-file (a file named
outright per system, [acquisition.file], stored under the counter's own name plus the release
file's extension, so the process the antivirus sees stays cloc.exe across versions), and
crates-io (built with cargo, and the rustc that built it goes into the record). A counter that
ships as a script runs through its own first line once fetch has marked it runnable, and needs its
interpreter on the machine, or check says so. A counter that is a script on Windows is the one
case this format does not cover yet.
A corpus is corpora/<name>.toml:
name       = "linux"
remote     = "https://github.com/torvalds/linux.git"
commit     = "0ff41df1cb268fc69e703a08a57ee14ae967d0ca"
files      = 63779
extensions = ["c", "h", "s", "asm", "py", "pl", "pm", "rs", "sh"]
tolerance  = "1%"

[skip]
windows = ["cloc"]
linux   = ["cloc"]
macos   = ["cloc"]
Only what differs between one tree and another lives here. How each counter spells these extensions
and what it turns off is in its own definition. A definition with a commit is checked before
every run and every check, and a checkout on anything else is refused. files is the number of
files carrying those extensions in the tree of that commit, git ls-tree -r HEAD, a number no
index, working tree or gitignore can move: check over a definition with a commit and no files
counts them and prints the line to paste, and run refuses until it is there. [skip] names, per
system, the counters left out of the default set over this corpus, with WSL counting as linux: cloc
takes far longer over these trees than the other three, about 90 s per run over the kernel, so a
plain run would be mostly it. All three shipped corpora leave it out on every system, and a
name in --counters runs it anyway. Leave commit blank to measure a tree as it stands.
remote is needed only to fetch.
Both directories are built into the binary, and --add joins a definition of your own to them.
Tests
cargo test --all-features
cargo clippy --all-targets --all-features -- -D warnings
cargo fmt --check
CI runs the three on Linux, Windows and macOS, then fetches the four counters and the cpython
corpus and runs check over it, so a definition that cannot be fetched, run or read on one of the
three systems fails the build. No timing is read there.
Licence
MIT or Apache-2.0, at your option.
Contributors

85 commits

2 commits
Similar repos


Languages
Rust
100.0%
A benchmark tool for line-of-code counters. Ensures fair and equal work, records the machine's and the environment's state, and can provide useful insights like syscalls, memory usage etc.
Rust
0
87 commits
updated Sep 13, 2026
See what people are saying (1)
README
linebench
A benchmark harness for line counters. Every counter on the same tree, on equal work, with the state of the machine recorded beside every number: the background load, the power scheme, the antivirus, the commit the corpus sits on, and a control run at both ends that says whether the machine moved while it measured.
| counter | wall | vs fastest | user cpu | system cpu | parallelism | lines/s | files | lines |
|---|---|---|---|---|---|---|---|---|
| counter a | 270 ms ± 20 | 1.00x | 1.87 s | 1.73 s | 13.33 | 133.3M | 63,700 | 36,000,000 |
| counter b | 420 ms ± 24 | 1.56x ± 0.14 | 2.90 s | 2.60 s | 13.10 | 85.7M | 63,700 | 36,000,000 |
| counter c | 564 ms ± 28 | 2.09x ± 0.19 | 3.30 s | 4.47 s | 13.78 | 63.8M | 63,700 | 36,000,000 |
The shape of the answer over a tree the size of the Linux kernel, names left out and numbers rounded. The runs worth reading are the ones each counter publishes in its own repository.
The counters are data, one counters/<name>.toml each, and linebench never builds one: it
fetches the release, hashes it, and writes the hash into the record. Today it knows cloc,
mezura, scc and tokei.
Contents
- Install
- Your first run
- The commands
- Three ways to use it
- Reading the numbers
- Equal work and the machine
- Where results go
- Settings
- Counters and corpora
- Tests
- Licence
Install
cargo install linebench
Or take the archive for your system from the
releases page.
Every counter and corpus definition is built into the binary.
It needs git, hyperfine, curl or wget, and tar on PATH. The last two come with every Unix, and Windows 10 and 11 carry both. cargo is needed only for a counter that publishes no binaries and has to be built (tokei), and perl for one that ships as a script (cloc on Linux and macOS).
| system | command |
|---|---|
| Debian, Ubuntu | sudo apt install hyperfine |
| Fedora, RHEL | sudo dnf install hyperfine |
| Arch | sudo pacman -S hyperfine |
| openSUSE | sudo zypper install hyperfine |
| Alpine | apk add hyperfine |
| Windows | winget install sharkdp.hyperfine |
| macOS | brew install hyperfine |
| anywhere else | cargo install hyperfine |
Your first run
linebench fetch --counters all --corpus cpython
linebench status
linebench check cpython
linebench noise cpython
sudo linebench run cpython
The first line downloads the four counters and clones one of the shipped corpora at its pinned
commit.
The second says what arrived and where.
The third proves the machine can measure: every counter runs once and its counts are checked
against the corpus.
The fourth measures the noise: the background cpu, the spread of a few runs, and whether the
machine is steady enough to benchmark.
The fifth measures, elevated so the power scheme can be set for it.
linebench keeps a directory of its own on every machine, made on first use: %APPDATA%\linebench
on Windows, ~/Library/Application Support/linebench on macOS, ~/.local/share/linebench on
Linux.
By default, the binaries land in counters/ under it, the checkouts in corpora/<name>,
linebench.conf sits beside them, copied from linebench.conf.example, and results go to
results/ in the directory you run from. Each of those can be moved with a flag, an environment
variable or a line in the conf, and Settings has the table.
Corpora take space: 190 MB for cpython, 990 MB for the jdk and 2.0 GB for the kernel, all three shallow clones.
Keep the corpus and the counters on a local disk. Measuring across /mnt from WSL, or over a
network share, measures the mount.
The commands
linebench --help lists every flag, and --help after a command prints that command alone.
fetch
linebench fetch --counters all --corpus all
linebench fetch --counters tokei
linebench fetch --corpus all --corpus-path /data/corpora
Downloads the counter binaries and clones the corpora. Each counter comes at the version its
definition declares, each corpus at the commit its definition pins. With neither named it refuses
and lists what there is. What arrived, and its sha256, goes into linebench-fetched.toml beside
the binaries, and a second fetch answers "already here" for what matches.
On Linux and macOS it refuses to run as root, so the files it writes belong to you. An elevated
Windows terminal is the same user with the same %APPDATA%, so there it runs. Where there is no
ordinary user, as on a CI runner, --allow-elevated lifts the refusal.
fetch asks the GitHub API which files a release holds, and anonymous calls are limited per
address, a limit shared CI runners hit. A token in GITHUB_TOKEN or GH_TOKEN lifts it. The
token goes to that one call, and downloads are made without it.
linebench fetch --counters all --latest
--latest takes the newest release of each counter and pins that version in the manifest. The pin
holds on this machine until the definition reaches or passes it, when every command says the pin
is set aside. A plain fetch keeps the pin. To drop it, remove the counter's entry from
linebench-fetched.toml and fetch again.
status
linebench status
What this machine holds and where. It only reads.
A version is green while the channel publishes nothing newer and yellow when it does. The line
under a corpus says which commit its checkout sits on, and 13 name clashes on the kernel is a
filesystem that keeps one name of a pair differing only in case, xt_CONNMARK.h and
xt_connmark.h, so git calls those files changed for as long as the checkout lives. The three
paths at the top are where every line below them came from. Every [given] entry in the conf is
listed too, with the build and the definition it names and whether they are there, since nothing
fetches those and status is the only place that says they exist.
check
linebench check linux
linebench check cpython --counters cloc,mezura,scc,tokei
linebench check linux,cpython
linebench check all
Answers "is this machine ready to measure". Every instance runs once per table against the real corpus, the counts are read back and held against the corpus, and hyperfine and git are tried:
The corpus number is the reference: the file count the corpus definition declares for its
commit, files = 3556 above, so "who is off" has an answer with one instance as much as with two.
Lines have no such reference and are compared between instances. The tolerance belongs to the
corpus, tolerance = "1%", since how many odd files a tree holds is a property of the tree.
A count of zero fails, and so does one outside the tolerance: the definition names a language the
tree does not have, or selects fewer files than the others. This is what catches a definition that
turns off too little: cloc on Linux matches an extension by its exact case, so --include-ext=s
skipped the 1,350 .S files of the kernel and came out 2.2% under the corpus.
The releases lines say whether the version each definition pins is still the newest published,
one lookup per counter on the channel it fetches from. Answers are cached six hours beside the
binaries. A lookup that fails prints why, in yellow, and the check passes all the same. Nothing is
fetched here. Over a list of corpora the block is printed once, after the last of them, and covers
every counter any corpus ran, since the answer does not change from one corpus to the next.
A list, linux,cpython, or all for every corpus this machine holds, is checked one corpus at a
time, each under a heading of its own.
noise
linebench noise linux
Answers "is this machine steady enough to benchmark right now". It samples the system-wide cpu for
seven seconds with nothing of ours running, then runs the control five times, the first one cold
on purpose: about fifteen seconds with mezura on the kernel, minutes with cloc. --runs changes
how many.
| steady | relatively steady | somewhat unsteady | not steady | |
|---|---|---|---|---|
| background | < 0.75 cores | 0.75 to 1.5 | 1.5 to 3 | 3 cores and up |
| spread | < 5% | 5 to 10% | 10 to 15% | 15% and up |
--control picks the instance it times, --runs how many times and --settle the quiet before
each. The first two verdicts exit 0 and the last two exit 1, so a script can gate on it. An
unsteady verdict is measured once more after five seconds, background sample included, and the
second verdict is the one that counts. A real run samples the background the same way and records
it.
run
sudo linebench run linux
linebench run linux --counters mezura,scc,tokei
linebench run cpython --runs 20 --warmup 5 --settle 5
linebench run linux --against 20260904-130000
sudo linebench run linux,cpython
sudo linebench run all
The measurement. What it prints is Reading the numbers, where it lands is Where results go.
On Windows open the terminal with "Run as administrator", elsewhere use sudo. Elevated, it sets
the cpu governor to performance (Linux) or the power scheme to High performance (Windows) and
puts it back when the run ends, whether it finishes, fails or is interrupted with Ctrl-C. Before
it changes anything it prints the command that puts it back by hand, for a run that gets killed
outright. Unelevated it prints what it would have changed and asks before doing any work: --yes
answers that question, --no-prep skips the whole thing even when elevated, and with no terminal
attached it carries on.
--runs, --warmup and --settle are hyperfine's, per command. --against <stamp> adds a
second comparison block read against that one run. --keep-raw holds on to each counter's JSON
and plain output, which a plain run deletes once the counts are read.
Several corpora in one command, linebench run linux,cpython or linebench run all, are measured
one after the other in the same process. The machine is prepared once and put back when the last
one ends, each corpus keeps its own run directory and its own record, and every summary is printed
again together at the end. all is every corpus definition with a checkout on this machine, and
the ones missing are named in a line of their own. A corpus that fails is named and the rest carry
on, and the exit code is 2 when one of them did. --against takes one corpus, since a stamp
belongs to one.
An instance is a definition, a binary and a name in the table. By default every counter definition
is one instance, named after itself, and so is every [given] entry in the conf. --counters
picks a subset and fixes the order.
The control is the instance timed alone at the start and at the end. Its shift is read as the
machine's own movement, and it is also what noise times. control = "mezura" in the conf names
it for every run on the machine, --control for one run, and with neither it is the first
instance named, which with no --counters is the first definition alphabetically that the corpus
does not skip, today mezura. Keep the control the same across the runs you want compared: "since
the last run" reads every change against the control's own shift, and that shift is known only
when an earlier run timed the same control build.
insights
linebench insights linux
Measurements that each need executions of their own, kept out of a run because they would lengthen and disturb it. What each system can answer:
| insight | Linux | Windows | macOS |
|---|---|---|---|
| the floor | yes | yes | yes |
| peak memory and the curve | yes, /proc/<pid>/status | yes, GetProcessMemoryInfo | no samples yet |
| the counts of system calls | yes, strace -c -f | no | no |
The floor is what a counter costs before it has counted anything. Three timings per instance,
thirty runs and no settle: the version answer, <counter> --version, and the two ready floors,
the run's own t1 and t2 flags over a directory holding no files, made in the temp directory and
removed when the command ends.
== floor summary
   instance  --version      ready t1       ready t2
   mezura    10.9 ms ± 1.0  16.7 ms ± 1.1  16.5 ms ± 1.1
   scc       21.3 ms ± 1.7  18.7 ms ± 1.8  19.2 ms ± 2.3
   tokei     5.5 ms ± 0.6   11.2 ms ± 0.8  11.1 ms ± 1.2

   --version       the binary answering its version flag and quitting
   ready t1, t2    the same binary over a target with no files, its report printed
The ready floor is everything a counter does with nothing to count, its empty report included,
and no run subtracts it. The two columns of one row say how much of a floor is the runtime it
ships on: tokei answers its version in 5.5 of the 11.2 it needs to be ready, cloc in 141 of its
167, because a Perl interpreter comes up before any of cloc's own code. Down a column they say
less, since each counter stops answering --version at a point of its own. Two instances sharing
one binary give the same version command, so it is timed once and printed on both rows. The times
are wall clock and the table carries no cpu columns.
The memory is one execution per instance over the corpus with the t1 flags, outside hyperfine
and untimed. linebench starts the counter and asks the system every 2 ms what it holds:
GetProcessMemoryInfo on Windows, /proc/<pid>/status on Linux. The peak is exact, from
PeakWorkingSetSize and VmHWM, so a peak between two samples survives.
Each panel has an axis top of its own, the first of 10, 20, 50, 100, 200, 500 MB or 1 GB the peak fits under, so heights compare directly only between panels with the same top, and the peak printed above each one is what to compare. The time axis includes the polling and a cold start, so it runs longer than a timed run.
The system calls are strace -c -f once per instance, grouped into families, with the calls
of a family under it and what each one answered with an error:
--counters picks the instances and their order, and --yes carries on when a tool a section
needs is missing. --only floor,memory,syscalls names which of the three to measure, in any
combination, and with nothing named all three run. A part left out is named as left out in the
record and on the page, so an empty section is never read as a measurement that found nothing.
A session lands in results/insights/<corpus>/<system>/<stamp>/. insights.json carries its own
machine block, the antivirus state, the corpus with its commit and the instances measured, so it
stands on its own, and the hyperfine exports sit beside it. insights.md is the same session for a
reader: the machine, the corpus and the three tables above as they were printed. An --args
instance or a build of yours sends the session under results/insights/local/.
report
linebench report
linebench report --verify
Builds results/README.md out of every record under results/. A run writes it too, so report
is for after a directory was moved, copied in from another machine, or deleted. --verify builds
the page, says whether the one on disk is that page, names the lines that differ, and writes
nothing.
verify
linebench verify results/linux/windows/20260911-014803
linebench verify results/insights/linux/linux/20260911-021742
Reads a run back and holds its numbers against each other: every measurement against itself, the
derived columns against the ones they come from, the counts against their sum, equal work
re-judged, and the csv files rebuilt from the record. Where the hyperfine exports were published
too, every statistic is recomputed from the time of every single execution. The path is a run
directory, or the run.json inside it.
What one insights command wrote is read the same way. Name its directory, or the insights.json
inside it, and the floor is held against itself and against its exports, every memory curve
against the peak the system reported independently of the samples, every traced instance against
the calls it listed, and every number against the instances the session says it measured. A part
--only left out and measured all the same fails too.
It prints what it could not read. A check that fails exits 1, and a missing file is reported as a gap and does not.
Three ways to use it
A tree of your own
Any directory, with --extensions naming the file extensions every counter is pointed at, so that
all of them do the same work:
linebench check /home/me/dev/myproject --extensions rs,toml
linebench run /home/me/dev/myproject --extensions rs,toml
The run is recorded as unpinned and named after the directory, and the counters' counts are
compared with each other, since there is no declared file count to hold them against. --extensions
is refused beside a corpus name, because a definition carries its own.
To measure a tree again and again, give it a corpus definition of its own, myproject.toml:
name       = "myproject"
extensions = ["rs", "toml"]
tolerance  = "1%"
linebench run myproject --add ./myproject.toml
Leave commit and files out to measure the tree as it stands. With remote and commit filled
in, fetch --corpus myproject clones it at that commit and every command refuses a checkout that
sits anywhere else.
A definition also puts it among the rest: linebench run linux,myproject --add ./myproject.toml
measures both in one go, and all takes it along once add in the conf names the file.
A counter of your own
One file, counters/<name>.toml, and --add reads it beside the built-in ones. The keys are in
Counters and corpora below:
linebench check cpython --add ./mycounter.toml
linebench run cpython --add ./mycounter.toml
--add takes a file or a directory of them, and repeats. A definition named like a built-in one
takes its place, and a line says so. add = ["<path>"] in the conf does the same for every run on
the machine.
A counter that publishes no release fetches nothing, so point linebench at the binary you have:
linebench run cpython --add ./mycounter.toml --given mycounter=/usr/local/bin/mycounter
A build of your own
A build of yours is an instance of its own, named <counter>@<tag>, so it stands in the table
beside the release it came from:
linebench run linux --counters mezura,mezura@dev --given mezura@dev=D:\dev\mezura\target\release\mezura.exe
The given binary is copied under given/<instance>/ in the counters directory before anything
reads it, fresh on every run, because the file cargo built measures slower than a plain copy of
itself and because the same name in the same directory is what gets the same antivirus treatment.
The copy is hashed and asked its version, and the record says given with the tag as its label.
It runs under the counter's own definition, or under one of its own when the flags of your build differ from the release's:
linebench run linux --counters mezura,mezura@dev --given mezura@dev=<path> --definition mezura@dev=D:\dev\mezura\.linebench\mezura.toml
Both fit in the conf, so the dev loop carries no flags:
[given."mezura@dev"]
binary     = "D:/dev/mezura/target/release/mezura.exe"
definition = "D:/dev/mezura/.linebench/mezura.toml"
An instance can carry arguments of its own, --args mezura@c16="--threads 4 16" for one run or
args = ["--threads", "4", "16"] in its [given] entry. They go right after the target, before
the languages and the same-work flags, in every invocation of that instance. With no binary of its
own the instance runs the release binary, so a [given] entry holding only args measures the
release with those arguments beside the release as it is. Arguments make an instance of their own,
so the name carries a tag.
A run holding any given instance is written under results/local/ and the page gives such runs
headings of their own, under the release ones, with the same sections. A [given] entry in the
conf joins every run that names no --counters, so for a run meant for the release tables comment
it out or name the release instances with --counters.
Reading the numbers
Each run measures two tables. Same work pins every instance to the corpus's languages and its own same-work flags, and the file and line counts beside the times, checked against the corpus, prove the work was the same. Out of the box runs every instance bare, so the ratio mixes speed with how much each one chose to do.
Every table is measured twice, once in each command order, and the numbers pool the two. How far
the orders disagreed is a trust check on the page. The control, the same binary timed at the start
and the end, gives the drift, and drift is the first thing to read.
The ± on vs fastest is the σ of the ratio, taken from the two walls' σ by the propagation of uncertainty for a quotient of independent quantities, σ_r = r · √((σ_a/μ_a)² + (σ_f/μ_f)²), the formula hyperfine prints its own "times faster" with. Each wall's σ is the pooled one, both orders together, so the order effect is in the ratio's σ too. It is one σ, about two thirds of the probability: a ratio whose interval reaches 1.00 is within the noise of the fastest, and one whose interval stays clear of 1.00 is apart by at least that much. The fastest row prints a plain 1.00x.
At the end of a run, and on the page, since the last run compares every instance's same-work
time with its own newest earlier measurement on the same machine, at the same corpus commit and
with the corpus on the same disk, whatever else that run held. Earlier runs set aside for another
cpu, commit or disk are listed with the reason, and an instance with no earlier measurement gets
its row all the same. The heading says "same builds" when no compared instance's binary changed. A
changed one carries version 4.0.0 -> 4.1.0 on its line, or build a81c2e5 -> 9b7e4d0 when the
version stayed the same, as a rebuilt dev build does, and it is compared all the same.
The ± on each change is the σ of the ratio now/then by the same propagation, fed with each mean's own σ: a mean of n runs is known to σ/√n, and the two orders are pooled with half their gap kept whole. The run-to-run σ the tables print would be five times too wide for a question about two means. The control's shift is printed the same way as the machine's own movement, and "the machine itself moved" is said when that shift sits outside its own ±. A change is judged against it: "within the noise" means the change minus the machine's shift is inside the combined σ of the two, so a run with the same binaries on a quieter machine reads as within the noise on every line. A control that drifted 4% cannot know the machine's shift to better than about 2%, and the ± on its line says so. Everything else that differed between the two runs is listed, from the power scheme to the drift and the equal-work verdict.
--against <stamp> adds a second block under it, read against that one run whatever came between,
for the sum of a series of changes. The stamp is the run's directory name, as done. prints it.
Same rows and rules, with the machine's shift taken over the same span. A run on another platform,
over another corpus, on another cpu, commit or disk, or recorded after this one, is named as not
comparable with the reason, and a run that would be published cannot name a local one. The block
goes to the terminal and to notes.md, and stays off the page.
Equal work and the machine
Two counters are comparable while they do the same work and the machine treats them the same. Three things guard that.
The counts. Every table carries the files and lines each counter reported, held against the file count the corpus declares. Outside the tolerance the run still goes on, and the record and the page say what was found, because the times remain information, only no longer a comparison of equal work.
The JSON. --expect-identical mezura=mezura@dev (pairs, comma separated), a flag of run,
checks that two instances of one counter printed the same JSON, in both tables, before any timing
starts. The fields the definition lists as volatile (a timestamp, its version, its own timing)
are set aside, lists of objects are compared regardless of their order, and the first difference is
named with both values. The verdict is printed, kept in the record and shown on the page, and a run
where the two differ exits 1 once everything is written: the times still stand, the claim that the
work was the same does not.
The antivirus. On Windows the record carries the Defender state: real-time protection, and per
instance whether its process and its binary are excluded. Unequal exclusions refuse the run,
because files opened by an excluded process are never scanned and the comparison would measure who
escaped the antivirus. --allow-unequal-exclusions measures anyway and marks the record, the notes
and the page. Reading the lists needs an elevated shell, and unelevated the record says
needs admin.
The counters directory belongs to fetch for the same reason: a binary in it whose hash is not the
one fetch wrote is refused, with the two ways out, fetch again or measure it as a given instance.
Where results go
No official benchmarks live in this repository. There is one example run under
example-run/, and the variability between machines is too great for it to
say anything about yours. It is the same machine under two systems, Windows and native Linux: the
three shipped corpora and an insights session on each, plus a local run putting the mezura release
that fetch downloaded that day against a newer working build of it. Every section speaks for the
day it was measured and says nothing about where the counters stand today.
Each counter that uses linebench publishes results of its own in its own repository, which is where to see how the numbers move between machines.
results/
├── README.md
├── linux/linux/20260904-120000/
├── linux/windows/20260904-130000/
├── local/linux/windows/20260904-140000/
└── insights/linux/windows/20260904-150000/
One directory per corpus, then per platform, then per run, named by its UTC timestamp. Nothing is
ever overwritten. results/README.md is the page, rewritten after every run and on demand with
report: one section per machine, and under it the newest run over each corpus with its two tables
and its trust checks, biggest corpus first, then every run once there is more than one, the local
builds under headings of their own, and the methodology and the terms.
Inside a run directory, run.json is the record, self-contained and the one that is read back.
summary.csv and counts.csv are the same numbers flat, <phase>.json and <phase>.md are
hyperfine's own output, transcript.txt is everything the run printed, and notes.md is the
checklist to fill in by hand, with the since block under it. out/ holds every counter's JSON and
is deleted once the counts are read. Inside an insights directory, insights.json is the session,
insights.md the same session to read, and hyperfine's own output sits beside them for the floor
phase.
Settings
A flag beats an environment variable, which beats linebench.conf in the data directory. Every
flag belongs to the commands whose help names it, and a command refuses one that is not its own.
--dry-run, --help and --version go with anything.
| what | flag | environment | in the conf | default |
|---|---|---|---|---|
| what gets counted | the argument, a corpus name or a directory | LINEBENCH_TARGET | ||
| where the corpora sit | --corpus-path <dir>, a directory each under it, or one corpus's own checkout | a [corpora] entry, the checkout itself | corpora/<name> in the data directory | |
| what to count in a directory | --extensions rs,c | |||
| the counter binaries | --counters-dir <dir> | LINEBENCH_COUNTERS | counters = "<dir>" | counters/ in linebench's own directory |
| where results go | --out <dir> | LINEBENCH_OUT | out = "<dir>" | results/ in the current directory |
what insights measures | --only floor,memory,syscalls | all three | ||
| definitions of your own | --add <path>, repeatable | add = ["<path>", ...] | ||
| the control | --control <instance> | control = "<instance>" | the first instance named | |
| counters left out on this machine | skip = ["cloc"] | cloc | ||
| write nothing, anywhere | --dry-run | off |
control = "mezura"
skip    = ["cloc"]

[corpora]
linux = "D:/corpora/linux"
skip leaves counters out of every default set on this machine, whatever the corpus: check and
run leave them out and say so, and naming one in --counters runs it. fetch ignores it, since
a counter is downloaded only when asked for by name. A corpus definition carries a [skip] of its
own, per system, for a counter too slow over that one tree.
--dry-run goes with any command and leaves nothing behind. What the command would write, the
record, the page, the notes, the transcript, the hyperfine exports and any build staged by
--given, goes to the temp folder and is deleted at the end. No release is looked up and nothing
is downloaded, so a fetch only names what it would have taken. The machine is prepared as always,
so a dry run takes as long as the real one.
With no target named, a command that needs one refuses and prints the two forms it takes.
Counters and corpora
A counter is counters/<name>.toml. Its keys mirror the linejudge adapter where the idea is the
same (name, repository, version-flag, [acquisition], the [read] paths), so a block copies
between the two files unchanged:
name         = "scc"
repository   = "https://github.com/boyter/scc"
version-flag = "--version"

[acquisition]
channel = "github-release-asset"
name    = "boyter/scc"
version = "4.1.0"

[run]
args           = ["{target}"]
json           = ["--format", "json"]
languages      = ["-i", "{extensions}"]
same-work      = ["--no-gitignore", "--no-ignore", "--no-scc-ignore", "-c", "--no-cocomo",
                  "--no-config"]
same-work-note = "ignore files off, complexity and cost estimates off, no config file read"
scrub-env      = ["SCC_CONFIG_PATH"]

[read]
each     = "[]"
files    = "Count"
lines    = "Lines"
code     = "Code"
comments = "Comment"
blanks   = "Blank"
| key | what it says |
|---|---|
args | the command that gets timed, with {target} where the directory goes |
json | appended only for the capture that reads the counts |
languages | carries {extensions}, or {names} for a counter that spells languages by name |
[language-names] | that counter's name for each extension, matched whatever the case |
extension-case | exact for a counter that matches case, so {extensions} is spelled s,S; the default is any |
same-work | what the same-work table adds |
same-work-note | what the results page prints for it |
volatile | the fields of the JSON that differ between two runs, in the [read] path syntax, so --expect-identical can set them aside |
scrub-env | variables removed from the counter's environment |
[read] | where the counts sit in the counter's own JSON |
output | a compiled reader for JSON the paths cannot reach, tokei-json today, in place of [read] |
The shipped [language-names] covers the extensions the shipped corpora name, and a corpus of
your own carrying another extension adds a line for it. Every bucket in [read] beyond code and
comments is read by name, so one block covers a counter that prints blanks in one mode and
extra in another, and the buckets have to add up to lines.
The channels are github-release-asset (the file for this system and architecture is picked by the
words in its name, and the published checksums are checked), github-release-file (a file named
outright per system, [acquisition.file], stored under the counter's own name plus the release
file's extension, so the process the antivirus sees stays cloc.exe across versions), and
crates-io (built with cargo, and the rustc that built it goes into the record). A counter that
ships as a script runs through its own first line once fetch has marked it runnable, and needs its
interpreter on the machine, or check says so. A counter that is a script on Windows is the one
case this format does not cover yet.
A corpus is corpora/<name>.toml:
name       = "linux"
remote     = "https://github.com/torvalds/linux.git"
commit     = "0ff41df1cb268fc69e703a08a57ee14ae967d0ca"
files      = 63779
extensions = ["c", "h", "s", "asm", "py", "pl", "pm", "rs", "sh"]
tolerance  = "1%"

[skip]
windows = ["cloc"]
linux   = ["cloc"]
macos   = ["cloc"]
Only what differs between one tree and another lives here. How each counter spells these extensions
and what it turns off is in its own definition. A definition with a commit is checked before
every run and every check, and a checkout on anything else is refused. files is the number of
files carrying those extensions in the tree of that commit, git ls-tree -r HEAD, a number no
index, working tree or gitignore can move: check over a definition with a commit and no files
counts them and prints the line to paste, and run refuses until it is there. [skip] names, per
system, the counters left out of the default set over this corpus, with WSL counting as linux: cloc
takes far longer over these trees than the other three, about 90 s per run over the kernel, so a
plain run would be mostly it. All three shipped corpora leave it out on every system, and a
name in --counters runs it anyway. Leave commit blank to measure a tree as it stands.
remote is needed only to fetch.
Both directories are built into the binary, and --add joins a definition of your own to them.
Tests
cargo test --all-features
cargo clippy --all-targets --all-features -- -D warnings
cargo fmt --check
CI runs the three on Linux, Windows and macOS, then fetches the four counters and the cpython
corpus and runs check over it, so a definition that cannot be fetched, run or read on one of the
three systems fails the build. No timing is read there.
Licence
MIT or Apache-2.0, at your option.
Similar repos
Contributors
85 commits
2 commits
Languages
Rust
100.0%