
README
sentinel-imx-sys
A lightweight log-anomaly detection daemon for the NXP i.MX 8M Plus (Yocto / Debian), plus a self-contained Docker build + model-training environment.
The daemon (sentinel-imxd) listens to the systemd journal (kernel messages
plus userspace service logs) and D-Bus system-bus signals, sanitizes each line
into a stable template, encodes it into
a fixed INT8 [1, 64] vector, optionally runs a TensorFlow Lite autoencoder
on the Vivante NPU via the VX external delegate, and — when the reconstruction
loss (MSE) exceeds a threshold — runs an external alert script.
Solution overview
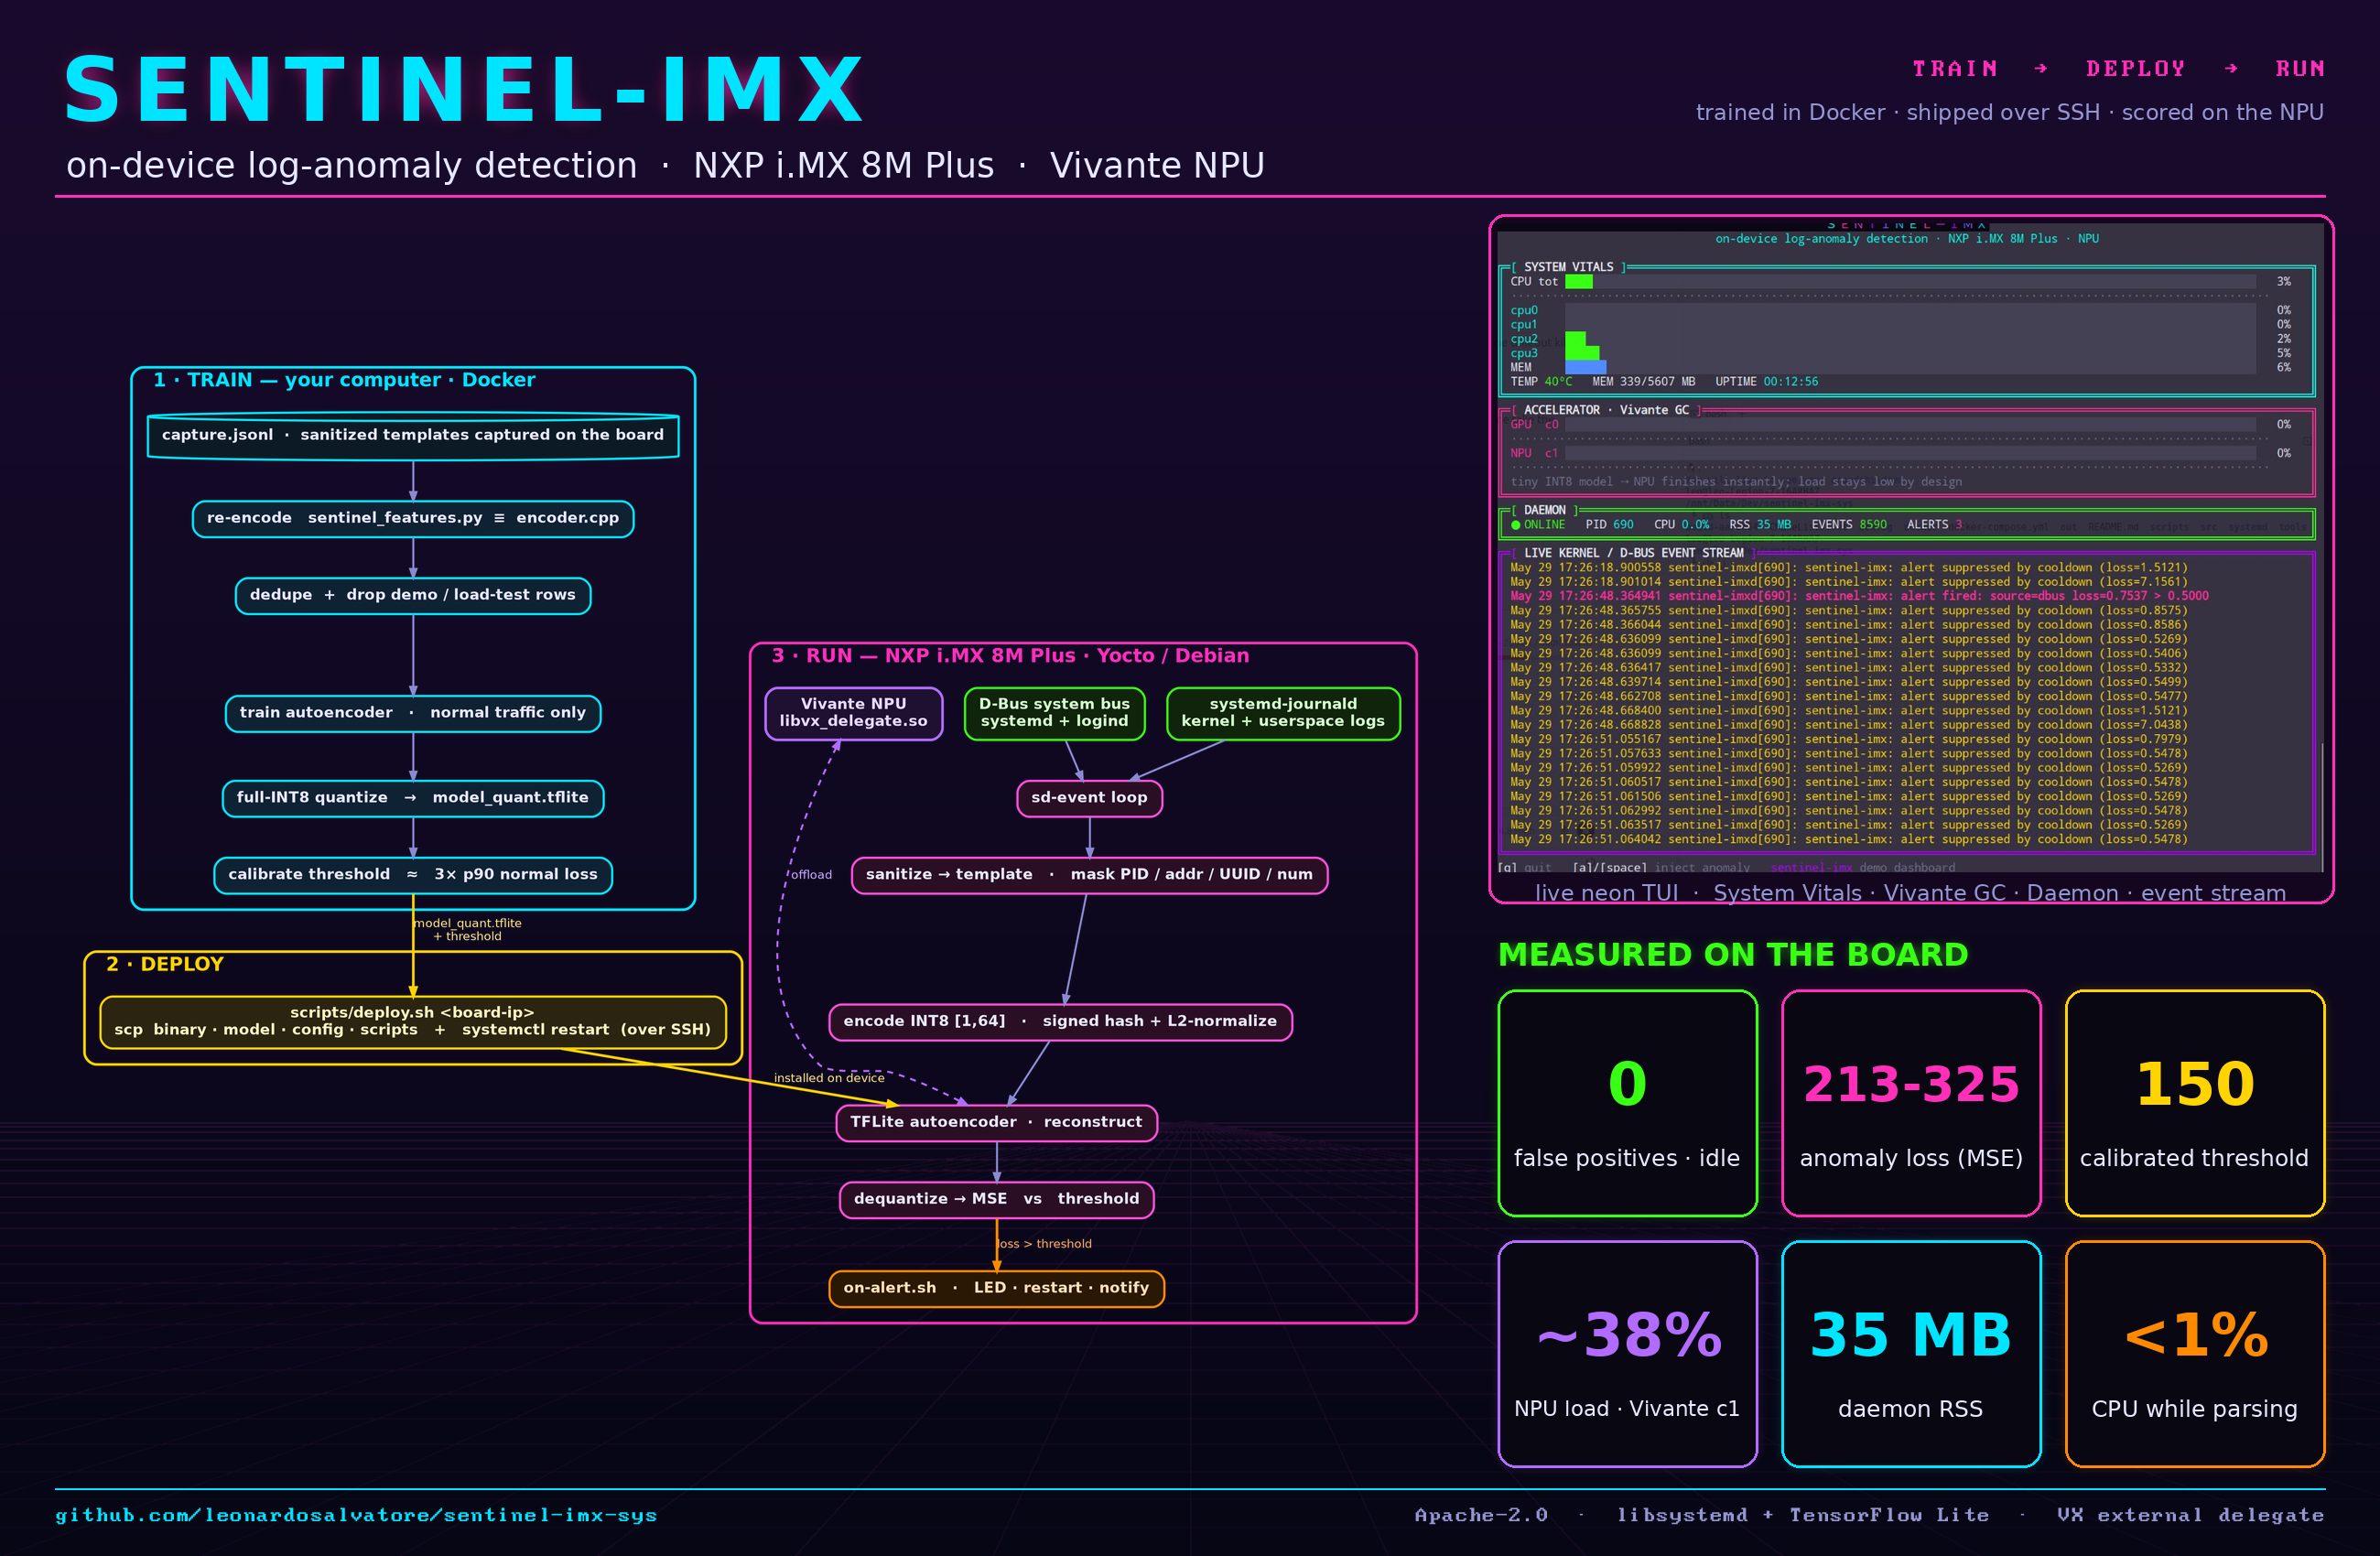
The whole story on one page — train on your computer (in Docker), deploy over SSH,
and detect on the board's NPU. Regenerate it any time with
scripts/make-diagram.sh
(PDF).
Want the why? The technical brief
Why standard log parsing fails on embedded boards
makes the case for on-device anomaly detection over rule-based / cloud log
parsing. Regenerate it with python3 docs/make_whitepaper.py.
Demo
https://www.youtube.com/watch?v=d_EssCpTC4E
Architecture
System architecture
Everything runs on the device. Journal (kernel + userspace) and D-Bus events
flow through a single sd-event loop, get turned into a normalized INT8 feature
vector, and are scored by a TensorFlow Lite autoencoder that is offloaded to the
Vivante NPU. A high reconstruction error triggers a user-supplied action script.
Kernel messages arrive via journald (which is the canonical /dev/kmsg
consumer) rather than a second raw reader; entries with _TRANSPORT=kernel are
still tagged source=kmsg, while other journal entries are tagged
source=journal. One tradeoff: journald rate-limits (RateLimitBurst), so a
severe printk storm can be dropped in the journal where a raw kmsg reader would
still see it until the ring buffer wraps.
flowchart LR
subgraph board["i.MX 8M Plus · Yocto / Debian"]
direction LR
subgraph src["Event sources"]
direction TB
journal["systemd-journald<br/>kernel + userspace logs"]
dbus["D-Bus system bus<br/>systemd + logind"]
end
subgraph daemon["sentinel-imxd · systemd service"]
direction TB
loop["sd-event loop"]
san["Sanitize → template<br/>mask PID / addr / UUID / num"]
enc["Encode → INT8 [1,64]<br/>signed hash + L2 normalize"]
inf["TFLite autoencoder<br/>reconstruct"]
mse["Dequantize → MSE<br/>compare to threshold"]
loop --> san --> enc --> inf --> mse
end
npu["Vivante NPU<br/>libvx_delegate.so"]
cap[("capture.jsonl<br/>training data")]
alert["on-alert.sh<br/>LED · restart · notify"]
journal --> loop
dbus --> loop
enc -. append .-> cap
inf <-->|offload| npu
mse -->|"loss > threshold"| alert
end
Training & detection workflow
The daemon captures normal traffic; you train a model from it on the host (in the Docker environment) using the same encoder the daemon runs, then deploy the model and its calibrated threshold back to the board. Detection is a per-event reconstruction-error check against that threshold.
flowchart TB
subgraph collect["1 · Collect on board"]
direction TB
runcap["Run daemon in capture / auto mode"]
jsonl[("capture.jsonl<br/>sanitized templates")]
runcap --> jsonl
end
subgraph train["2 · Train on host · Docker"]
direction TB
reenc["Re-encode templates<br/>sentinel_features.py ≡ encoder.cpp"]
prep["Dedupe + drop demo / load-test rows"]
ae["Train autoencoder<br/>normal traffic only"]
quant["Full-INT8 quantize<br/>→ model_quant.tflite"]
calib["Calibrate threshold<br/>≈ 3× p90 normal loss"]
reenc --> prep --> ae --> quant --> calib
end
subgraph detect["3 · Detect on board · per event"]
direction TB
line["New log line"]
enc2["Sanitize + encode INT8 [1,64]"]
recon["NPU autoencoder reconstruct"]
loss["MSE input vs output"]
decide{"loss > threshold?"}
fire["Alert → on-alert.sh"]
ignore["Ignore · keep capturing"]
line --> enc2 --> recon --> loss --> decide
decide -->|yes| fire
decide -->|no| ignore
end
jsonl -->|copy off board| reenc
quant -->|deploy model| recon
calib -->|set threshold| decide
What it does, in plain terms
Embedded Linux boxes are noisy: the kernel and system services emit a constant stream of log lines. Most are routine; a few (a failing eMMC, an OOM kill, a USB device misbehaving, an unexpected service crash) are early warnings. Watching those by hand doesn't scale, and shipping every log to the cloud is often impossible or undesirable on an edge device.
sentinel-imx-sys learns what normal logs look like for your device, then
flags the abnormal ones on the device, in real time, at near-zero cost — and
runs a script of your choosing when something looks wrong. No cloud, no log
shipping, data stays local.
It's an autoencoder for logs: it's trained only on normal traffic, so when it sees something unfamiliar it reconstructs it poorly (high error = anomaly).
Each event is reduced to a template (PIDs/addresses/UUIDs/numbers masked), hashed
into a 64-bin signed histogram, and L2-normalized before it hits the model.
That normalization matters: without it the reconstruction error just tracks how
many tokens a line has, so the model ranks events by length and a short kernel
BUG: line looks more "normal" than routine chatter. Projecting every event onto
the unit sphere makes the score reflect the token pattern — novelty, not size.
Design highlights
- Capture-first. With no model present (
mode=auto), the daemon just records sanitized/encoded events to a JSONL file — use it to collect training data on the real board, then train and drop inmodel_quant.tflite. - Actions are yours. Alerts don't do anything hard-coded; they exec a configurable bash script with rich context in the environment.
- Minimal dependencies. Only
libsystemd(sd-event + sd-bus + sd-journal) and TensorFlow Lite. No Boost, no JSON library (JSON is written/parsed by hand). - NPU acceleration. Uses
/usr/lib/libvx_delegate.soas a TFLite external delegate;USE_GPU_INFERENCE=0steers it to the NPU rather than the 3D GPU.
Repository layout
CMakeLists.txt            Cross/native build
docker-compose.yml        One-command dev environment
docker/                   SDK download + cross-build + training image
config/sentinel-imx.conf  Runtime configuration
systemd/                  Service unit
scripts/on-alert.sh       Alert hook stub (customize this)
scripts/sentinel-tui.py   Neon '80s dashboard for demos (run on the board)
scripts/demo.sh           One-screen tmux live demo (run on the board)
scripts/npu-bench.sh      CPU-vs-NPU latency benchmark (run on the board)
scripts/npu-load.py       NPU load generator (drives the load meter for demos)
tools/                    Host-side training + capture export (+ diag_loss.py)
tools/sentinel_features.py  Python mirror of the C++ sanitize+encode pipeline
src/                      Daemon sources
LICENSE / NOTICE          Apache-2.0
Build (self-contained, via Docker)
NXP's public EVK downloads are flashable .wic images, not an application SDK.
The container instead installs the public standard Scarthgap (Yocto 5.0 LTS)
aarch64 SDK — the same Yocto series as NXP LF 6.6.52 — giving the cross
toolchain in the familiar board-SDK layout. (The standard toolchain is used
rather than the extensible -ext- one, which refuses to install as root.)
TensorFlow Lite is fetched from the NXP git fork at configure time;
libvx_delegate.so lives on the target at runtime.
# 1. Build the image (downloads the SDK + libsystemd, installs TF for training)
docker compose build

# 2. Cross-compile the daemon -> ./out/sentinel-imxd (aarch64)
docker compose run --rm dev ./docker/scripts/build.sh

# 3. Train a model from captured data -> ./out/model_quant.tflite
docker compose run --rm dev ./docker/scripts/train.sh data/capture.jsonl

# ...or, with no capture file, train on synthetic data (placeholder model):
docker compose run --rm dev ./docker/scripts/train.sh
Build outputs land in
./out/owned by root (the container runs as root). Runsudo chown -R "$USER:$USER" out build-aarch64if you need to edit them from the host.
If you have a real NXP SDK installer, drop it in docker/sdk/*.sh; it takes
precedence over the public poky toolchain (and already contains libtensorflow-lite
and the i.MX tuning).
To skip the heavy TensorFlow Lite build (capture-only daemon):
docker compose run --rm dev ./docker/scripts/build.sh -DSENTINEL_ENABLE_TFLITE=OFF
Native build on the board
On an i.MX image that already ships libsystemd and libtensorflow-lite:
cmake -S . -B build -DSENTINEL_ENABLE_TFLITE=ON
cmake --build build -j
sudo cmake --install build
Deploy
# Copy the cross-built binary + assets to the board, then:
sudo install -m0755 out/sentinel-imxd /usr/bin/sentinel-imxd
sudo install -Dm0644 config/sentinel-imx.conf /etc/sentinel-imx/sentinel-imx.conf
sudo install -Dm0644 systemd/sentinel-imx.service /usr/lib/systemd/system/sentinel-imx.service
sudo install -Dm0755 scripts/on-alert.sh /usr/libexec/sentinel-imx/on-alert.sh
sudo install -Dm0644 out/model_quant.tflite /usr/share/sentinel-imx/model_quant.tflite   # optional
sudo systemctl daemon-reload
sudo systemctl enable --now sentinel-imx.service
Configuration
See config/sentinel-imx.conf. Every key can be
overridden by a SENTINEL_<KEY> environment variable. Key options:
| Key | Default | Meaning |
|---|---|---|
mode | auto | auto / capture / infer |
model_path | /usr/share/sentinel-imx/model_quant.tflite | TFLite autoencoder |
delegate_path | /usr/lib/libvx_delegate.so | Vivante VX external delegate |
threshold | 45 | MSE anomaly threshold (model-specific; the trainer suggests one in out/threshold.txt) |
alert_script | /usr/libexec/sentinel-imx/on-alert.sh | Program run on anomaly |
alert_cooldown_sec | 10 | Min seconds between alerts |
capture_path | /var/lib/sentinel-imx/capture.jsonl | JSONL training data |
journal / dbus | true / true | Enable event sources (journal = systemd journal, kernel + userspace) |
dbus_match | (built-in defaults) | Repeatable D-Bus match rule |
Alert script environment
on-alert.sh receives: SENTINEL_LOSS, SENTINEL_THRESHOLD, SENTINEL_SOURCE
(kmsg/journal/dbus), SENTINEL_TEMPLATE, SENTINEL_RAW (truncated).
Live demo (on the board)
Option A — neon dashboard (best for recording)
scripts/sentinel-tui.py is a dependency-free ('80s synthwave) full-screen
dashboard: animated banner, per-core CPU bars + sparklines, Vivante GPU/NPU
load, memory/temp/uptime, the daemon's live vitals, and a colorized live event
stream. Keys on camera:
a/space— inject a synthetic anomaly (watch the alert fire in the stream)n— toggle NPU stress: loops the large showcase model on the NPU so the accelerator meter (core c1) climbs to ~40–80% while the GPU (core c0) stays flat — a live, honest proof that the work lands on the NPU. Copy the showcase model + load generator to the board first (see below).q— quit
# copy the dashboard, load generator, and showcase model once:
scp scripts/sentinel-tui.py scripts/npu-load.py root@<board>:/usr/local/bin/
scp out/model_showcase.tflite root@<board>:/usr/share/sentinel-imx/
# then run over an SSH TTY so keys work:
ssh -t root@<board> 'python3 /usr/local/bin/sentinel-tui.py'
Option B — tmux four-pane split
scripts/demo.sh splits your terminal into a single screen that tells the whole
story — run it on the board (needs tmux):
./demo.sh
- top-left — live detections (
journalctl -u sentinel-imx -f) - top-right — NPU proof: the daemon is a registered client of the Vivante NPU driver and its model tensors are resident in NPU video memory
- bottom-left —
topfiltered to the daemon (CPU stays tiny) - bottom-right — a pre-typed fault injector; press Enter to fire one:
echo "kernel BUG: unable to handle kernel paging request at 00000000" > /dev/kmsg
The narrative: inject a scary kernel message → an alert fires instantly → CPU barely moves → because the model is running through the NPU delegate.
Proving the NPU is engaged
The i.MX NPU load gauge (/sys/kernel/debug/gc/load) stays near 0% for the
production workload — a tiny INT8 autoencoder finishes each inference almost
instantly (even ~6000 inferences/sec only registers ~3%), so there are no
sustained "busy cycles" to show. That's the efficiency story, not a bug. Two
ways to prove the NPU is really doing the work:
Live (visual). Press n in the dashboard, or run the load generator
directly. It loops the large showcase model on the NPU and the meter climbs to
~40–80% on core c1 (the NPU) while core c0 (the 3D GPU) stays at 0%:
USE_GPU_INFERENCE=0 python3 scripts/npu-load.py \
    /usr/share/sentinel-imx/model_showcase.tflite
watch -n1 cat /sys/kernel/debug/gc/load     # core 1 (NPU) rises; core 0 stays 0
Static (binding + residency). Regardless of load:
# 1. The daemon is bound to the Vivante NPU/GPU driver:
cat /sys/kernel/debug/gc/clients            # -> lists sentinel-imxd

# 2. Its model tensors are resident in NPU (VIP) video memory:
grep -A5 sentinel-imxd /sys/kernel/debug/gc/database

# 3. The journal shows the graph was delegated:
journalctl -u sentinel-imx | grep -i delegate
#   -> using external delegate /usr/lib/libvx_delegate.so (NPU)
Performance: CPU vs NPU (measured on i.MX 8M Plus)
Measured with NXP's benchmark_model (INT8), and via the running daemon:
| Metric | Value |
|---|---|
| Daemon idle CPU | ~0.3% |
| End-to-end CPU per event (parse → encode → infer → capture) | ~0.25 ms |
| Resident memory (RSS) | ~37 MB |
| Production model (4.1K MACs) — CPU (1× A53) | ~2.3 µs / inference |
| Production model (4.1K MACs) — NPU (VX delegate) | ~110 µs / inference |
| Showcase model (8.8M MACs) — CPU (4 threads) | ~1130 µs / inference |
| Showcase model (8.8M MACs) — NPU (VX delegate) | ~1180 µs / inference (+3.35 s first-run compile) |
Honest takeaway: for this workload the CPU is the right choice. The i.MX NPU (VIP8000) is built for large convolutional/vision tensors; small INT8 MLP/autoencoder inferences are dominated by per-invoke dispatch and weight-DMA overhead, so the NPU is far slower for the tiny production model and only break-even for a deliberately heavy one. The daemon supports the NPU delegate (and it works — the graph is fully delegated) so you can drop in a heavier model later, but out of the box the anomaly signal simply doesn't need it, which is why the daemon is so cheap to run.
Reproduce the comparison on your board:
# tiny production model (CPU wins big)
./npu-bench.sh /usr/share/sentinel-imx/model_quant.tflite

# heavy showcase model (train it first: train.sh --arch large)
./npu-bench.sh /tmp/model_showcase.tflite
Training your own model
- Run in
capture(orautowithout a model) to collectcapture.jsonl. - Copy it off the board into
./data/capture.jsonl. docker compose run --rm dev ./docker/scripts/train.sh data/capture.jsonl.- Copy
out/model_quant.tfliteto the board, setthresholdfromout/threshold.txtin the config, and restart the service.
The model is a small autoencoder (64 -> 32 -> 64, INT8 in/out). Training
re-encodes the captured templates with the exact same normalized encoder the
daemon uses (tools/sentinel_features.py mirrors src/encoder.cpp), so training
matches inference byte-for-byte. Two details make the scores meaningful:
- Deduplication (
--dedupe, on by default intrain.sh): each distinct normal template is learned once, so a handful of very frequent patterns (e.g. session churn) can't dominate and leave rare-but-normal messages under-learned. - Excludes synthetic/demo traffic: templates containing
demo-inject,npuload, orloadtestare dropped, so the model never learns the very anomalies you inject (or the benchmark load generators) as "normal".
After export the trainer runs the quantized model over the normal set, prints the
loss distribution, and writes a suggested threshold (~3x the p90 steady-state
floor) to out/threshold.txt. tools/diag_loss.py prints normal-vs-anomaly
losses if you want to eyeball the separation before deploying.
Training runs under the Keras 2 API (tf-keras, selected via
TF_USE_LEGACY_KERAS=1): TensorFlow 2.16 defaults to Keras 3, whose graph the
full-int8 TFLite quantizer cannot lower. The dev image installs tf-keras and
the training script sets the flag automatically — no action needed.
Pass --arch large for a deliberately heavy (~8.8M MAC) autoencoder with the
same INT8 [1,64] interface — useful only for the NPU-vs-CPU benchmark, not for
production:
docker compose run --rm dev ./docker/scripts/train.sh   # small (default)
docker compose run --rm --entrypoint bash dev -lc \
  'python3 tools/train_autoencoder.py --synthetic --arch large --output out/model_showcase.tflite'
Capture file format
One JSON object per line:
{"ts":1725270000,"source":"kmsg","template":"usb <NUM>-<NUM> new high-speed usb device number <NUM> using <HEX>","vector":[3,-1,0, ...]}
tools/export_capture.py converts this to a NumPy (N, 64) int8 array.
Log rotation
The daemon appends forever. Add a logrotate snippet if needed:
/var/lib/sentinel-imx/capture.jsonl {
    weekly
    rotate 4
    missingok
    notifempty
    copytruncate
}
License
Apache-2.0 — see LICENSE and NOTICE. Contributions
welcome; see CONTRIBUTING.md.
TensorFlow Lite (NXP fork) is fetched at build time and the Vivante VX delegate lives on the target device; neither is redistributed here.
Contributors

8 commits
See what people are saying
Similar repos


Languages
Python
39.5%
C++
39.1%
Shell
16.5%
CMake
4.9%
README
sentinel-imx-sys
A lightweight log-anomaly detection daemon for the NXP i.MX 8M Plus (Yocto / Debian), plus a self-contained Docker build + model-training environment.
The daemon (sentinel-imxd) listens to the systemd journal (kernel messages
plus userspace service logs) and D-Bus system-bus signals, sanitizes each line
into a stable template, encodes it into
a fixed INT8 [1, 64] vector, optionally runs a TensorFlow Lite autoencoder
on the Vivante NPU via the VX external delegate, and — when the reconstruction
loss (MSE) exceeds a threshold — runs an external alert script.
Solution overview
The whole story on one page — train on your computer (in Docker), deploy over SSH,
and detect on the board's NPU. Regenerate it any time with
scripts/make-diagram.sh
(PDF).
Want the why? The technical brief
Why standard log parsing fails on embedded boards
makes the case for on-device anomaly detection over rule-based / cloud log
parsing. Regenerate it with python3 docs/make_whitepaper.py.
Demo
https://www.youtube.com/watch?v=d_EssCpTC4E
Architecture
System architecture
Everything runs on the device. Journal (kernel + userspace) and D-Bus events
flow through a single sd-event loop, get turned into a normalized INT8 feature
vector, and are scored by a TensorFlow Lite autoencoder that is offloaded to the
Vivante NPU. A high reconstruction error triggers a user-supplied action script.
Kernel messages arrive via journald (which is the canonical /dev/kmsg
consumer) rather than a second raw reader; entries with _TRANSPORT=kernel are
still tagged source=kmsg, while other journal entries are tagged
source=journal. One tradeoff: journald rate-limits (RateLimitBurst), so a
severe printk storm can be dropped in the journal where a raw kmsg reader would
still see it until the ring buffer wraps.
flowchart LR
subgraph board["i.MX 8M Plus · Yocto / Debian"]
direction LR
subgraph src["Event sources"]
direction TB
journal["systemd-journald<br/>kernel + userspace logs"]
dbus["D-Bus system bus<br/>systemd + logind"]
end
subgraph daemon["sentinel-imxd · systemd service"]
direction TB
loop["sd-event loop"]
san["Sanitize → template<br/>mask PID / addr / UUID / num"]
enc["Encode → INT8 [1,64]<br/>signed hash + L2 normalize"]
inf["TFLite autoencoder<br/>reconstruct"]
mse["Dequantize → MSE<br/>compare to threshold"]
loop --> san --> enc --> inf --> mse
end
npu["Vivante NPU<br/>libvx_delegate.so"]
cap[("capture.jsonl<br/>training data")]
alert["on-alert.sh<br/>LED · restart · notify"]
journal --> loop
dbus --> loop
enc -. append .-> cap
inf <-->|offload| npu
mse -->|"loss > threshold"| alert
end
Training & detection workflow
The daemon captures normal traffic; you train a model from it on the host (in the Docker environment) using the same encoder the daemon runs, then deploy the model and its calibrated threshold back to the board. Detection is a per-event reconstruction-error check against that threshold.
flowchart TB
subgraph collect["1 · Collect on board"]
direction TB
runcap["Run daemon in capture / auto mode"]
jsonl[("capture.jsonl<br/>sanitized templates")]
runcap --> jsonl
end
subgraph train["2 · Train on host · Docker"]
direction TB
reenc["Re-encode templates<br/>sentinel_features.py ≡ encoder.cpp"]
prep["Dedupe + drop demo / load-test rows"]
ae["Train autoencoder<br/>normal traffic only"]
quant["Full-INT8 quantize<br/>→ model_quant.tflite"]
calib["Calibrate threshold<br/>≈ 3× p90 normal loss"]
reenc --> prep --> ae --> quant --> calib
end
subgraph detect["3 · Detect on board · per event"]
direction TB
line["New log line"]
enc2["Sanitize + encode INT8 [1,64]"]
recon["NPU autoencoder reconstruct"]
loss["MSE input vs output"]
decide{"loss > threshold?"}
fire["Alert → on-alert.sh"]
ignore["Ignore · keep capturing"]
line --> enc2 --> recon --> loss --> decide
decide -->|yes| fire
decide -->|no| ignore
end
jsonl -->|copy off board| reenc
quant -->|deploy model| recon
calib -->|set threshold| decide
What it does, in plain terms
Embedded Linux boxes are noisy: the kernel and system services emit a constant stream of log lines. Most are routine; a few (a failing eMMC, an OOM kill, a USB device misbehaving, an unexpected service crash) are early warnings. Watching those by hand doesn't scale, and shipping every log to the cloud is often impossible or undesirable on an edge device.
sentinel-imx-sys learns what normal logs look like for your device, then
flags the abnormal ones on the device, in real time, at near-zero cost — and
runs a script of your choosing when something looks wrong. No cloud, no log
shipping, data stays local.
It's an autoencoder for logs: it's trained only on normal traffic, so when it sees something unfamiliar it reconstructs it poorly (high error = anomaly).
Each event is reduced to a template (PIDs/addresses/UUIDs/numbers masked), hashed
into a 64-bin signed histogram, and L2-normalized before it hits the model.
That normalization matters: without it the reconstruction error just tracks how
many tokens a line has, so the model ranks events by length and a short kernel
BUG: line looks more "normal" than routine chatter. Projecting every event onto
the unit sphere makes the score reflect the token pattern — novelty, not size.
Design highlights
- Capture-first. With no model present (
mode=auto), the daemon just records sanitized/encoded events to a JSONL file — use it to collect training data on the real board, then train and drop inmodel_quant.tflite. - Actions are yours. Alerts don't do anything hard-coded; they exec a configurable bash script with rich context in the environment.
- Minimal dependencies. Only
libsystemd(sd-event + sd-bus + sd-journal) and TensorFlow Lite. No Boost, no JSON library (JSON is written/parsed by hand). - NPU acceleration. Uses
/usr/lib/libvx_delegate.soas a TFLite external delegate;USE_GPU_INFERENCE=0steers it to the NPU rather than the 3D GPU.
Repository layout
CMakeLists.txt            Cross/native build
docker-compose.yml        One-command dev environment
docker/                   SDK download + cross-build + training image
config/sentinel-imx.conf  Runtime configuration
systemd/                  Service unit
scripts/on-alert.sh       Alert hook stub (customize this)
scripts/sentinel-tui.py   Neon '80s dashboard for demos (run on the board)
scripts/demo.sh           One-screen tmux live demo (run on the board)
scripts/npu-bench.sh      CPU-vs-NPU latency benchmark (run on the board)
scripts/npu-load.py       NPU load generator (drives the load meter for demos)
tools/                    Host-side training + capture export (+ diag_loss.py)
tools/sentinel_features.py  Python mirror of the C++ sanitize+encode pipeline
src/                      Daemon sources
LICENSE / NOTICE          Apache-2.0
Build (self-contained, via Docker)
NXP's public EVK downloads are flashable .wic images, not an application SDK.
The container instead installs the public standard Scarthgap (Yocto 5.0 LTS)
aarch64 SDK — the same Yocto series as NXP LF 6.6.52 — giving the cross
toolchain in the familiar board-SDK layout. (The standard toolchain is used
rather than the extensible -ext- one, which refuses to install as root.)
TensorFlow Lite is fetched from the NXP git fork at configure time;
libvx_delegate.so lives on the target at runtime.
# 1. Build the image (downloads the SDK + libsystemd, installs TF for training)
docker compose build

# 2. Cross-compile the daemon -> ./out/sentinel-imxd (aarch64)
docker compose run --rm dev ./docker/scripts/build.sh

# 3. Train a model from captured data -> ./out/model_quant.tflite
docker compose run --rm dev ./docker/scripts/train.sh data/capture.jsonl

# ...or, with no capture file, train on synthetic data (placeholder model):
docker compose run --rm dev ./docker/scripts/train.sh
Build outputs land in
./out/owned by root (the container runs as root). Runsudo chown -R "$USER:$USER" out build-aarch64if you need to edit them from the host.
If you have a real NXP SDK installer, drop it in docker/sdk/*.sh; it takes
precedence over the public poky toolchain (and already contains libtensorflow-lite
and the i.MX tuning).
To skip the heavy TensorFlow Lite build (capture-only daemon):
docker compose run --rm dev ./docker/scripts/build.sh -DSENTINEL_ENABLE_TFLITE=OFF
Native build on the board
On an i.MX image that already ships libsystemd and libtensorflow-lite:
cmake -S . -B build -DSENTINEL_ENABLE_TFLITE=ON
cmake --build build -j
sudo cmake --install build
Deploy
# Copy the cross-built binary + assets to the board, then:
sudo install -m0755 out/sentinel-imxd /usr/bin/sentinel-imxd
sudo install -Dm0644 config/sentinel-imx.conf /etc/sentinel-imx/sentinel-imx.conf
sudo install -Dm0644 systemd/sentinel-imx.service /usr/lib/systemd/system/sentinel-imx.service
sudo install -Dm0755 scripts/on-alert.sh /usr/libexec/sentinel-imx/on-alert.sh
sudo install -Dm0644 out/model_quant.tflite /usr/share/sentinel-imx/model_quant.tflite   # optional
sudo systemctl daemon-reload
sudo systemctl enable --now sentinel-imx.service
Configuration
See config/sentinel-imx.conf. Every key can be
overridden by a SENTINEL_<KEY> environment variable. Key options:
| Key | Default | Meaning |
|---|---|---|
mode | auto | auto / capture / infer |
model_path | /usr/share/sentinel-imx/model_quant.tflite | TFLite autoencoder |
delegate_path | /usr/lib/libvx_delegate.so | Vivante VX external delegate |
threshold | 45 | MSE anomaly threshold (model-specific; the trainer suggests one in out/threshold.txt) |
alert_script | /usr/libexec/sentinel-imx/on-alert.sh | Program run on anomaly |
alert_cooldown_sec | 10 | Min seconds between alerts |
capture_path | /var/lib/sentinel-imx/capture.jsonl | JSONL training data |
journal / dbus | true / true | Enable event sources (journal = systemd journal, kernel + userspace) |
dbus_match | (built-in defaults) | Repeatable D-Bus match rule |
Alert script environment
on-alert.sh receives: SENTINEL_LOSS, SENTINEL_THRESHOLD, SENTINEL_SOURCE
(kmsg/journal/dbus), SENTINEL_TEMPLATE, SENTINEL_RAW (truncated).
Live demo (on the board)
Option A — neon dashboard (best for recording)
scripts/sentinel-tui.py is a dependency-free ('80s synthwave) full-screen
dashboard: animated banner, per-core CPU bars + sparklines, Vivante GPU/NPU
load, memory/temp/uptime, the daemon's live vitals, and a colorized live event
stream. Keys on camera:
a/space— inject a synthetic anomaly (watch the alert fire in the stream)n— toggle NPU stress: loops the large showcase model on the NPU so the accelerator meter (core c1) climbs to ~40–80% while the GPU (core c0) stays flat — a live, honest proof that the work lands on the NPU. Copy the showcase model + load generator to the board first (see below).q— quit
# copy the dashboard, load generator, and showcase model once:
scp scripts/sentinel-tui.py scripts/npu-load.py root@<board>:/usr/local/bin/
scp out/model_showcase.tflite root@<board>:/usr/share/sentinel-imx/
# then run over an SSH TTY so keys work:
ssh -t root@<board> 'python3 /usr/local/bin/sentinel-tui.py'
Option B — tmux four-pane split
scripts/demo.sh splits your terminal into a single screen that tells the whole
story — run it on the board (needs tmux):
./demo.sh
- top-left — live detections (
journalctl -u sentinel-imx -f) - top-right — NPU proof: the daemon is a registered client of the Vivante NPU driver and its model tensors are resident in NPU video memory
- bottom-left —
topfiltered to the daemon (CPU stays tiny) - bottom-right — a pre-typed fault injector; press Enter to fire one:
echo "kernel BUG: unable to handle kernel paging request at 00000000" > /dev/kmsg
The narrative: inject a scary kernel message → an alert fires instantly → CPU barely moves → because the model is running through the NPU delegate.
Proving the NPU is engaged
The i.MX NPU load gauge (/sys/kernel/debug/gc/load) stays near 0% for the
production workload — a tiny INT8 autoencoder finishes each inference almost
instantly (even ~6000 inferences/sec only registers ~3%), so there are no
sustained "busy cycles" to show. That's the efficiency story, not a bug. Two
ways to prove the NPU is really doing the work:
Live (visual). Press n in the dashboard, or run the load generator
directly. It loops the large showcase model on the NPU and the meter climbs to
~40–80% on core c1 (the NPU) while core c0 (the 3D GPU) stays at 0%:
USE_GPU_INFERENCE=0 python3 scripts/npu-load.py \
    /usr/share/sentinel-imx/model_showcase.tflite
watch -n1 cat /sys/kernel/debug/gc/load     # core 1 (NPU) rises; core 0 stays 0
Static (binding + residency). Regardless of load:
# 1. The daemon is bound to the Vivante NPU/GPU driver:
cat /sys/kernel/debug/gc/clients            # -> lists sentinel-imxd

# 2. Its model tensors are resident in NPU (VIP) video memory:
grep -A5 sentinel-imxd /sys/kernel/debug/gc/database

# 3. The journal shows the graph was delegated:
journalctl -u sentinel-imx | grep -i delegate
#   -> using external delegate /usr/lib/libvx_delegate.so (NPU)
Performance: CPU vs NPU (measured on i.MX 8M Plus)
Measured with NXP's benchmark_model (INT8), and via the running daemon:
| Metric | Value |
|---|---|
| Daemon idle CPU | ~0.3% |
| End-to-end CPU per event (parse → encode → infer → capture) | ~0.25 ms |
| Resident memory (RSS) | ~37 MB |
| Production model (4.1K MACs) — CPU (1× A53) | ~2.3 µs / inference |
| Production model (4.1K MACs) — NPU (VX delegate) | ~110 µs / inference |
| Showcase model (8.8M MACs) — CPU (4 threads) | ~1130 µs / inference |
| Showcase model (8.8M MACs) — NPU (VX delegate) | ~1180 µs / inference (+3.35 s first-run compile) |
Honest takeaway: for this workload the CPU is the right choice. The i.MX NPU (VIP8000) is built for large convolutional/vision tensors; small INT8 MLP/autoencoder inferences are dominated by per-invoke dispatch and weight-DMA overhead, so the NPU is far slower for the tiny production model and only break-even for a deliberately heavy one. The daemon supports the NPU delegate (and it works — the graph is fully delegated) so you can drop in a heavier model later, but out of the box the anomaly signal simply doesn't need it, which is why the daemon is so cheap to run.
Reproduce the comparison on your board:
# tiny production model (CPU wins big)
./npu-bench.sh /usr/share/sentinel-imx/model_quant.tflite

# heavy showcase model (train it first: train.sh --arch large)
./npu-bench.sh /tmp/model_showcase.tflite
Training your own model
- Run in
capture(orautowithout a model) to collectcapture.jsonl. - Copy it off the board into
./data/capture.jsonl. docker compose run --rm dev ./docker/scripts/train.sh data/capture.jsonl.- Copy
out/model_quant.tfliteto the board, setthresholdfromout/threshold.txtin the config, and restart the service.
The model is a small autoencoder (64 -> 32 -> 64, INT8 in/out). Training
re-encodes the captured templates with the exact same normalized encoder the
daemon uses (tools/sentinel_features.py mirrors src/encoder.cpp), so training
matches inference byte-for-byte. Two details make the scores meaningful:
- Deduplication (
--dedupe, on by default intrain.sh): each distinct normal template is learned once, so a handful of very frequent patterns (e.g. session churn) can't dominate and leave rare-but-normal messages under-learned. - Excludes synthetic/demo traffic: templates containing
demo-inject,npuload, orloadtestare dropped, so the model never learns the very anomalies you inject (or the benchmark load generators) as "normal".
After export the trainer runs the quantized model over the normal set, prints the
loss distribution, and writes a suggested threshold (~3x the p90 steady-state
floor) to out/threshold.txt. tools/diag_loss.py prints normal-vs-anomaly
losses if you want to eyeball the separation before deploying.
Training runs under the Keras 2 API (tf-keras, selected via
TF_USE_LEGACY_KERAS=1): TensorFlow 2.16 defaults to Keras 3, whose graph the
full-int8 TFLite quantizer cannot lower. The dev image installs tf-keras and
the training script sets the flag automatically — no action needed.
Pass --arch large for a deliberately heavy (~8.8M MAC) autoencoder with the
same INT8 [1,64] interface — useful only for the NPU-vs-CPU benchmark, not for
production:
docker compose run --rm dev ./docker/scripts/train.sh   # small (default)
docker compose run --rm --entrypoint bash dev -lc \
  'python3 tools/train_autoencoder.py --synthetic --arch large --output out/model_showcase.tflite'
Capture file format
One JSON object per line:
{"ts":1725270000,"source":"kmsg","template":"usb <NUM>-<NUM> new high-speed usb device number <NUM> using <HEX>","vector":[3,-1,0, ...]}
tools/export_capture.py converts this to a NumPy (N, 64) int8 array.
Log rotation
The daemon appends forever. Add a logrotate snippet if needed:
/var/lib/sentinel-imx/capture.jsonl {
    weekly
    rotate 4
    missingok
    notifempty
    copytruncate
}
License
Apache-2.0 — see LICENSE and NOTICE. Contributions
welcome; see CONTRIBUTING.md.
TensorFlow Lite (NXP fork) is fetched at build time and the Vivante VX delegate lives on the target device; neither is redistributed here.
See what people are saying
Similar repos
Contributors
8 commits
Languages
Python
39.5%
C++
39.1%
Shell
16.5%
CMake
4.9%