
README







Inference Perf
Inference Perf is a production-scale GenAI inference performance benchmarking tool that allows you to benchmark and analyze the performance of inference deployments. It is agnostic of model servers and can be used to measure performance and compare different systems apples-to-apples.
It was founded as a part of the inference benchmarking and metrics standardization effort in wg-serving to standardize the benchmark tooling and the metrics used to measure inference performance across the Kubernetes and model server communities.
🏗️ Architecture
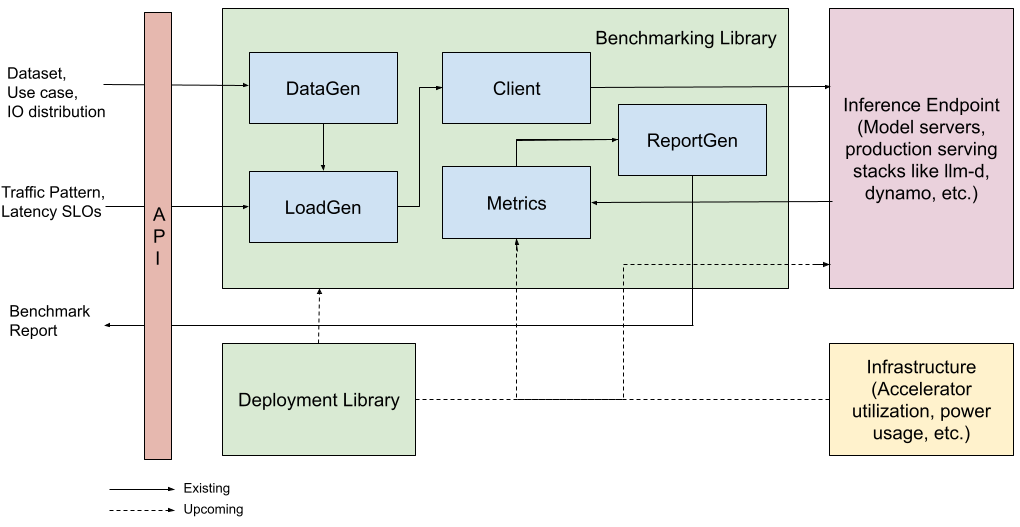
🌟 Key Capabilities
📊 Rich Metrics & Analysis
- Comprehensive Latency Metrics: TTFT, TPOT, ITL, and Normalized TPOT.
- Throughput Tracking: Input, Output, and Total tokens per second.
- Goodput Measurement: Measure rate of requests meeting your SLO constraints. See goodput.md.
- Automatic Visualization: Generate charts for QPS vs Latency/Throughput/Goodput. See analysis.md.
🧠 Smart Data Generation
- Real-world Datasets: Support for ShareGPT, CNN DailyMail, Infinity Instruct, Billsum, and the VisionArena image dataset.
- Synthetic & Random: Configure exact input/output distributions.
- Advanced Scenarios: Shared prefix and multi-turn chat conversations.
- Multimodal: Synthetic image, video, and audio payloads with per-modality reporting. Resolutions/profiles/durations are passed through as-is; pick values within your model's accepted range. See docs/config.md.
⏱️ Flexible Load Generation
- Load Patterns: Constant rate, Poisson arrival, and concurrent user simulation.
- Multi-Stage Runs: Define stages with varying rates and durations to find saturation points.
- Trace Replay: Replay real-world traces (e.g., Azure dataset) or OpenTelemetry traces with agentic tree-of-thought simulation and visualization.
🚀 High Scalability
- 10k+ QPS: Scalable to very high load due to optimized multi-process architecture.
- Automatic Saturation Detection: Find the limits of your system via sweeps.
🔌 Engine Agnostic
- Verified support for vLLM, SGLang, and TGI with server side aggregate metrics and time series metrics.
- Easily extensible to any OpenAI-compatible endpoint.
🚀 Quick Start
Run Locally
-
Install
inference-perf:pip install inference-perf -
Run a benchmark with a simple random workload:
inference-perf --server.type vllm --server.base_url http://localhost:8000 --data.type random --load.type constant --load.stages '[{"rate": 10, "duration": 60}]' --api.streaming true
Alternatively, you can run using a configuration file:
inference-perf --config_file config.yml
Sample Output
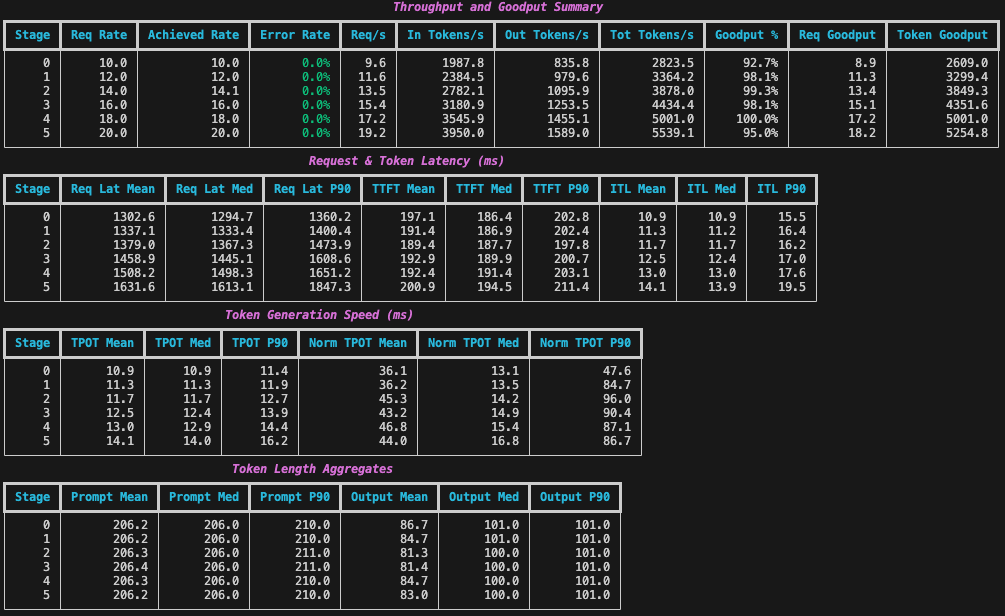
When you run inference-perf, it displays a rich summary table in the CLI:
Run in Docker
docker run -it --rm -v $(pwd)/config.yml:/workspace/config.yml quay.io/inference-perf/inference-perf
Run in Kubernetes
Refer to the guide in /deploy.
📚 Documentation Hub
Explore detailed documentation for specific topics:
| Topic | Description | Link |
|---|---|---|
| Configuration | Full YAML configuration schema and options. | config.md |
| CLI Flags | All command line flags: global options and configuration overrides. | cli_flags.md |
| Load Generation | Detailed explanation of load patterns and multi-worker setup. | loadgen.md |
| Collected Metrics | Definitions of TTFT, TPOT, ITL, etc. | metrics.md |
| Emitted Metrics | Prometheus metrics inference-perf exports about its own runtime. | runtime_metrics.md |
| Comparability | Configuring runs that are comparable with other benchmarking tools. | comparability.md |
| Goodput | How to measure requests meeting SLOs. | goodput.md |
| Reports | Understanding generated JSON reports. | reports.md |
| OTel Observability | Instrument benchmark runs with OpenTelemetry tracing to export to Jaeger, Tempo, etc. | otel_instrumentation.md |
| OTel Trace Replay | Data/load type for replaying production traces with complex dependency graphs. | otel_trace_replay.md |
| Synthetic Agentic (implementation in progress) | Data/load type for generating agentic workloads (tool loops, sub-agent fan-out, context growth) procedurally, without a recorded trace. | synthetic_agentic.md |
| Weka Trace Replay | Data/load type for replaying raw Weka agent traces via graph-based session execution. | weka_trace_replay.md |
| Conversation Replay | Data/load type for benchmarking concurrent multi-turn agentic conversations with configurable distributions. | conversation_replay.md |
| BR0.2 Reports | Always-emitted llm-d-benchmark BR0.2 partial per stage; designed for clean yq-merge with other producers. | br_v0_2.md |
| Analysis | Visualizations and plots for performance metrics. | analysis.md |
| E2E Tests | Contributor guide to the end-to-end test tier: running and extending it. | e2e_tests.md |
🤝 Contributing & Community
We welcome contributions! Please join us:
- Slack: #inference-perf channel in Kubernetes workspace.
- Community Meeting: Weekly on Thursdays alternating between 09:00 and 11:30 PDT.
- Code of Conduct: Governed by the Kubernetes Code of Conduct.
See CONTRIBUTING.md for details on how to get started.
Contributors
(top 30 of 62)


Similar repos


Languages
Python
99.3%
README
Inference Perf
Inference Perf is a production-scale GenAI inference performance benchmarking tool that allows you to benchmark and analyze the performance of inference deployments. It is agnostic of model servers and can be used to measure performance and compare different systems apples-to-apples.
It was founded as a part of the inference benchmarking and metrics standardization effort in wg-serving to standardize the benchmark tooling and the metrics used to measure inference performance across the Kubernetes and model server communities.
🏗️ Architecture
🌟 Key Capabilities
📊 Rich Metrics & Analysis
- Comprehensive Latency Metrics: TTFT, TPOT, ITL, and Normalized TPOT.
- Throughput Tracking: Input, Output, and Total tokens per second.
- Goodput Measurement: Measure rate of requests meeting your SLO constraints. See goodput.md.
- Automatic Visualization: Generate charts for QPS vs Latency/Throughput/Goodput. See analysis.md.
🧠 Smart Data Generation
- Real-world Datasets: Support for ShareGPT, CNN DailyMail, Infinity Instruct, Billsum, and the VisionArena image dataset.
- Synthetic & Random: Configure exact input/output distributions.
- Advanced Scenarios: Shared prefix and multi-turn chat conversations.
- Multimodal: Synthetic image, video, and audio payloads with per-modality reporting. Resolutions/profiles/durations are passed through as-is; pick values within your model's accepted range. See docs/config.md.
⏱️ Flexible Load Generation
- Load Patterns: Constant rate, Poisson arrival, and concurrent user simulation.
- Multi-Stage Runs: Define stages with varying rates and durations to find saturation points.
- Trace Replay: Replay real-world traces (e.g., Azure dataset) or OpenTelemetry traces with agentic tree-of-thought simulation and visualization.
🚀 High Scalability
- 10k+ QPS: Scalable to very high load due to optimized multi-process architecture.
- Automatic Saturation Detection: Find the limits of your system via sweeps.
🔌 Engine Agnostic
- Verified support for vLLM, SGLang, and TGI with server side aggregate metrics and time series metrics.
- Easily extensible to any OpenAI-compatible endpoint.
🚀 Quick Start
Run Locally
-
Install
inference-perf:pip install inference-perf -
Run a benchmark with a simple random workload:
inference-perf --server.type vllm --server.base_url http://localhost:8000 --data.type random --load.type constant --load.stages '[{"rate": 10, "duration": 60}]' --api.streaming true
Alternatively, you can run using a configuration file:
inference-perf --config_file config.yml
Sample Output
When you run inference-perf, it displays a rich summary table in the CLI:
Run in Docker
docker run -it --rm -v $(pwd)/config.yml:/workspace/config.yml quay.io/inference-perf/inference-perf
Run in Kubernetes
Refer to the guide in /deploy.
📚 Documentation Hub
Explore detailed documentation for specific topics:
| Topic | Description | Link |
|---|---|---|
| Configuration | Full YAML configuration schema and options. | config.md |
| CLI Flags | All command line flags: global options and configuration overrides. | cli_flags.md |
| Load Generation | Detailed explanation of load patterns and multi-worker setup. | loadgen.md |
| Collected Metrics | Definitions of TTFT, TPOT, ITL, etc. | metrics.md |
| Emitted Metrics | Prometheus metrics inference-perf exports about its own runtime. | runtime_metrics.md |
| Comparability | Configuring runs that are comparable with other benchmarking tools. | comparability.md |
| Goodput | How to measure requests meeting SLOs. | goodput.md |
| Reports | Understanding generated JSON reports. | reports.md |
| OTel Observability | Instrument benchmark runs with OpenTelemetry tracing to export to Jaeger, Tempo, etc. | otel_instrumentation.md |
| OTel Trace Replay | Data/load type for replaying production traces with complex dependency graphs. | otel_trace_replay.md |
| Synthetic Agentic (implementation in progress) | Data/load type for generating agentic workloads (tool loops, sub-agent fan-out, context growth) procedurally, without a recorded trace. | synthetic_agentic.md |
| Weka Trace Replay | Data/load type for replaying raw Weka agent traces via graph-based session execution. | weka_trace_replay.md |
| Conversation Replay | Data/load type for benchmarking concurrent multi-turn agentic conversations with configurable distributions. | conversation_replay.md |
| BR0.2 Reports | Always-emitted llm-d-benchmark BR0.2 partial per stage; designed for clean yq-merge with other producers. | br_v0_2.md |
| Analysis | Visualizations and plots for performance metrics. | analysis.md |
| E2E Tests | Contributor guide to the end-to-end test tier: running and extending it. | e2e_tests.md |
🤝 Contributing & Community
We welcome contributions! Please join us:
- Slack: #inference-perf channel in Kubernetes workspace.
- Community Meeting: Weekly on Thursdays alternating between 09:00 and 11:30 PDT.
- Code of Conduct: Governed by the Kubernetes Code of Conduct.
See CONTRIBUTING.md for details on how to get started.
Similar repos
Contributors
(top 30 of 62)
Languages
Python
99.3%