
Causal analysis for people who aren't data scientists: an Agent Skill for Claude
Python
0
8 commits
updated Sep 26, 2026
See what people are saying
README
causal-analyst



Causal analysis for people who aren't data scientists. An Agent Skill that lets Claude answer "did X actually cause Y?" from your data. You bring the question and what you know about your business. Claude does the modelling, checks how far to trust the answer, and hands back a one-page report. When the data can't answer the question, it says so.
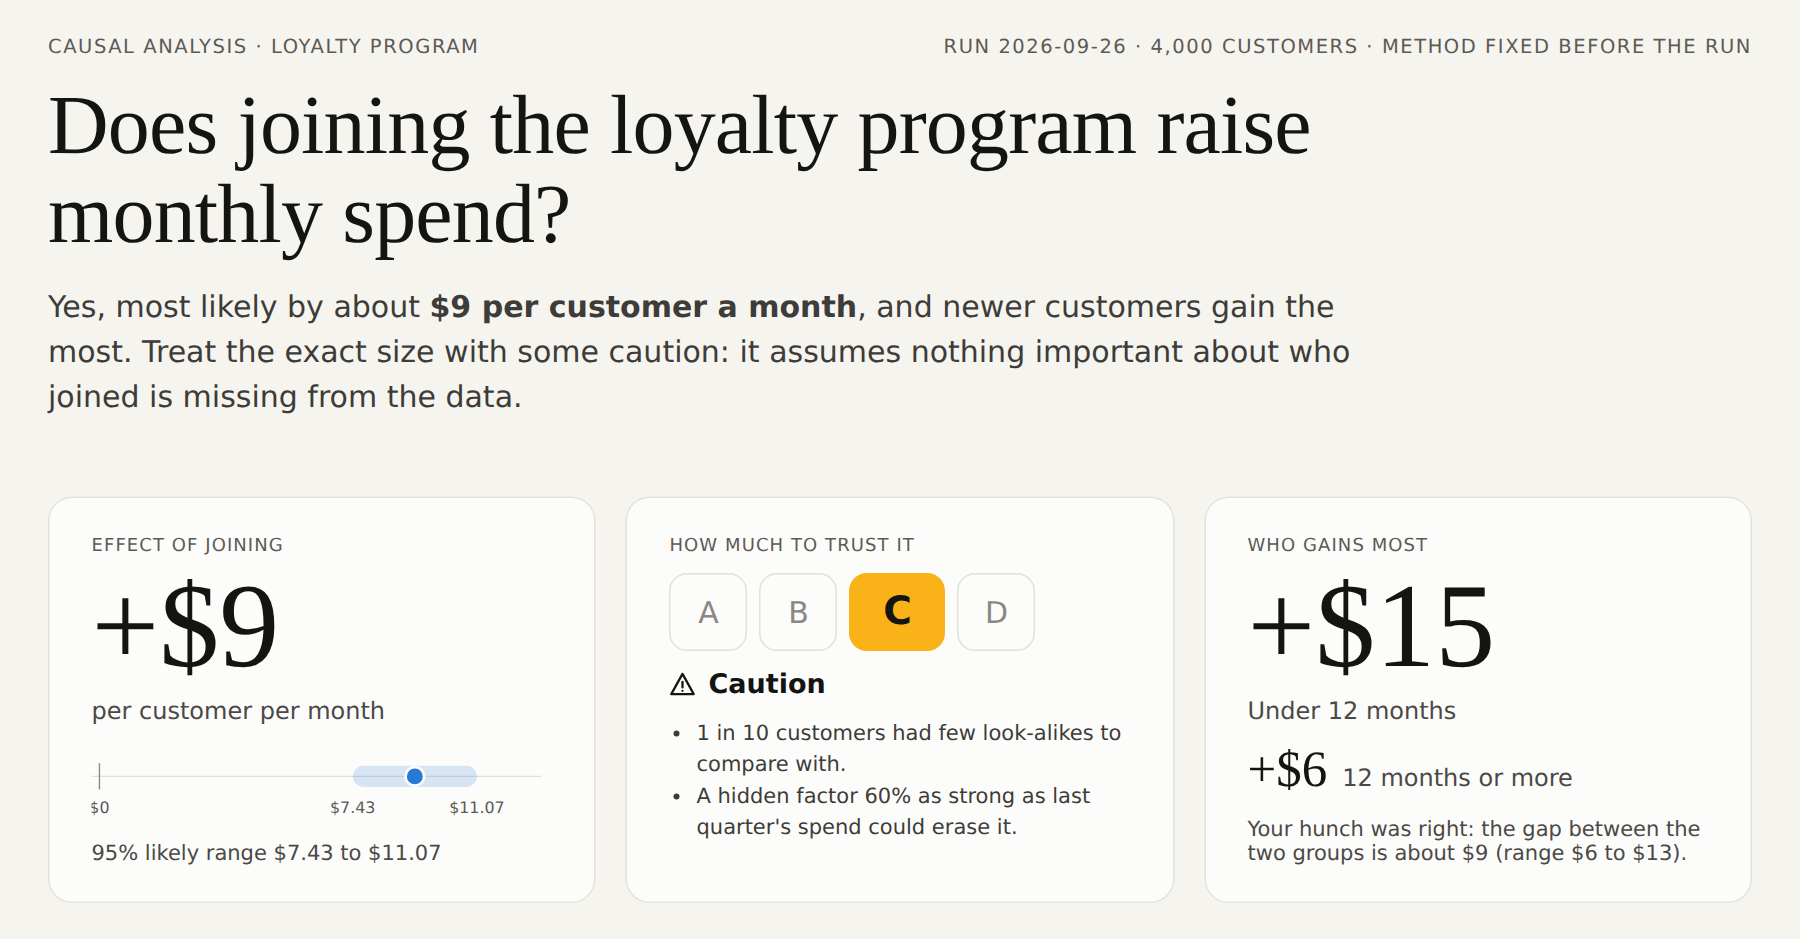
Live example reports: Loyalty program (grade C) · Sales calls (grade D, "can't tell") · AI training (grade B, three traps) · Quick start
Contents: Why this exists · What it's like to use · The report · Quick start · How it works · Does it work? · Which model to use · Data and privacy · Limitations and roadmap
Why this exists
Good causal analysis needs two kinds of knowledge that rarely sit in one person:
- Data science: which methods to use, how to check them, and what the numbers can and can't support.
- Domain knowledge: what happened before what, how people ended up getting the treatment, and what important factor isn't in the data.
The marketing lead knows that "points redeemed" only exists after someone joins, and that the program was pushed to big spenders. The data scientist knows that controlling for points will wreck the estimate, and that targeting big spenders creates a gap that isn't the program's doing. Usually it takes both people and a lot of back and forth. Often the domain expert simply ends up with a correlation.
This skill lets the domain expert work directly with Claude. Claude handles the modelling. It asks, in plain language, only the questions that need domain knowledge, turns the answers into a causal diagram the expert confirms, then runs and checks the analysis and explains the result. The expert supplies what only they know; the skill supplies the rest.
It also guards against the ways capable models go wrong. Frontier models already get the arithmetic right: in our tests plain Claude matched the skill's estimate on a clean case to within a few percent. The failures are judgment calls:
- Controlling for the wrong thing. Adjusting for "points redeemed" turns a +$10 effect into −$22.
- Answering a question the data can't support. If reps pick whom to call using a gut feel that isn't recorded, no amount of adjustment recovers the effect of a call.
- Choosing the method after seeing the results, and quietly drifting toward the hoped-for answer.
- Overstating certainty. Plain Claude twice gave confident ranges that missed the true answer.
So the workflow puts those judgments in the open. Controls are confirmed as recorded before the treatment. The expert signs off the diagram. The method is fixed in advance. There's an explicit "we can't tell" grade, and the risk from hidden factors is sized.
What it's like to use
You attach a file and ask in your own words. The skill takes it from there, stopping three times for your input.
You: [attaches customers.csv] Did our loyalty program actually raise monthly spend? We think newer customers benefit more.
1. Claude checks the data and points out anything odd before going further:
4,000 customers, 9 columns.
points_redeemedalmost perfectly predicts who joined, which usually means it's a result of joining. And 44% of non-members have some points, which shouldn't happen. I'll flag that.
2. It confirms what each column means. Column names mislead (is usage_idx measured before or after the training?), so Claude writes down its reading of every column and when it was recorded, and you correct it.
3. It asks what only you know, one question at a time, as clickable options:
Were income, tenure, age, city and last quarter's spend all recorded before customers joined? ○ Yes ○ Some were later ○ Not sure
Is there anything that affects both who joins and how much they spend that isn't in this file? ○ No ○ Yes: ___ ○ Not sure
Could past spending have driven who joined, rather than only the other way round? ○ Yes, big spenders were targeted ○ No ○ Not sure
4. You confirm the diagram and the plan. Claude draws how it thinks things work, you correct it, and the main method is fixed before anything runs. Where you weren't sure, Claude writes down the alternative diagrams too.
5. You get the report about a minute later. It gives the answer, how much to trust it and why, who benefits most, and the randomized test that would settle it.
The report
A self-contained HTML page: it works offline, on a phone, and prints cleanly. It reads top to bottom as a story. Here is the answer; here is what it stood on; here is how sure we are; here is what to do.
| # | Section | What it answers |
|---|---|---|
| 1 | Headline + trust grade (A–D) | What's the effect, how sure are we, who gains most |
| 2 | The data | How big it is, each column's role (action, outcome, control, left out), distributions, the first few rows |
| 3 | How we think it works | The causal diagram, in a picture and in words, and whether you confirmed it |
| 4 | Where the raw gap comes from | How much of the naive difference is who got the action vs the action itself |
| 5 | Methods side by side | Does the answer depend on the technique? |
| 6 | Meet the methods | A timeline and plain-English guide to each method family |
| 7 | What if our diagram is wrong? | The answer under alternative diagrams, and what the data itself suggests about the structure |
| 8 | Who benefits more | Effects for the groups you asked about, with ranges |
| 9 | Why the grade | Overlap, balance, hidden-factor strength, a planted-effect test on your own data, placebo and stability checks |
| 10 | What this rests on | Every assumption and its status; the trap that was avoided; data issues |
| 11 | Next steps and questions | A sized randomized test, and every assumption made on your behalf |
2 · The data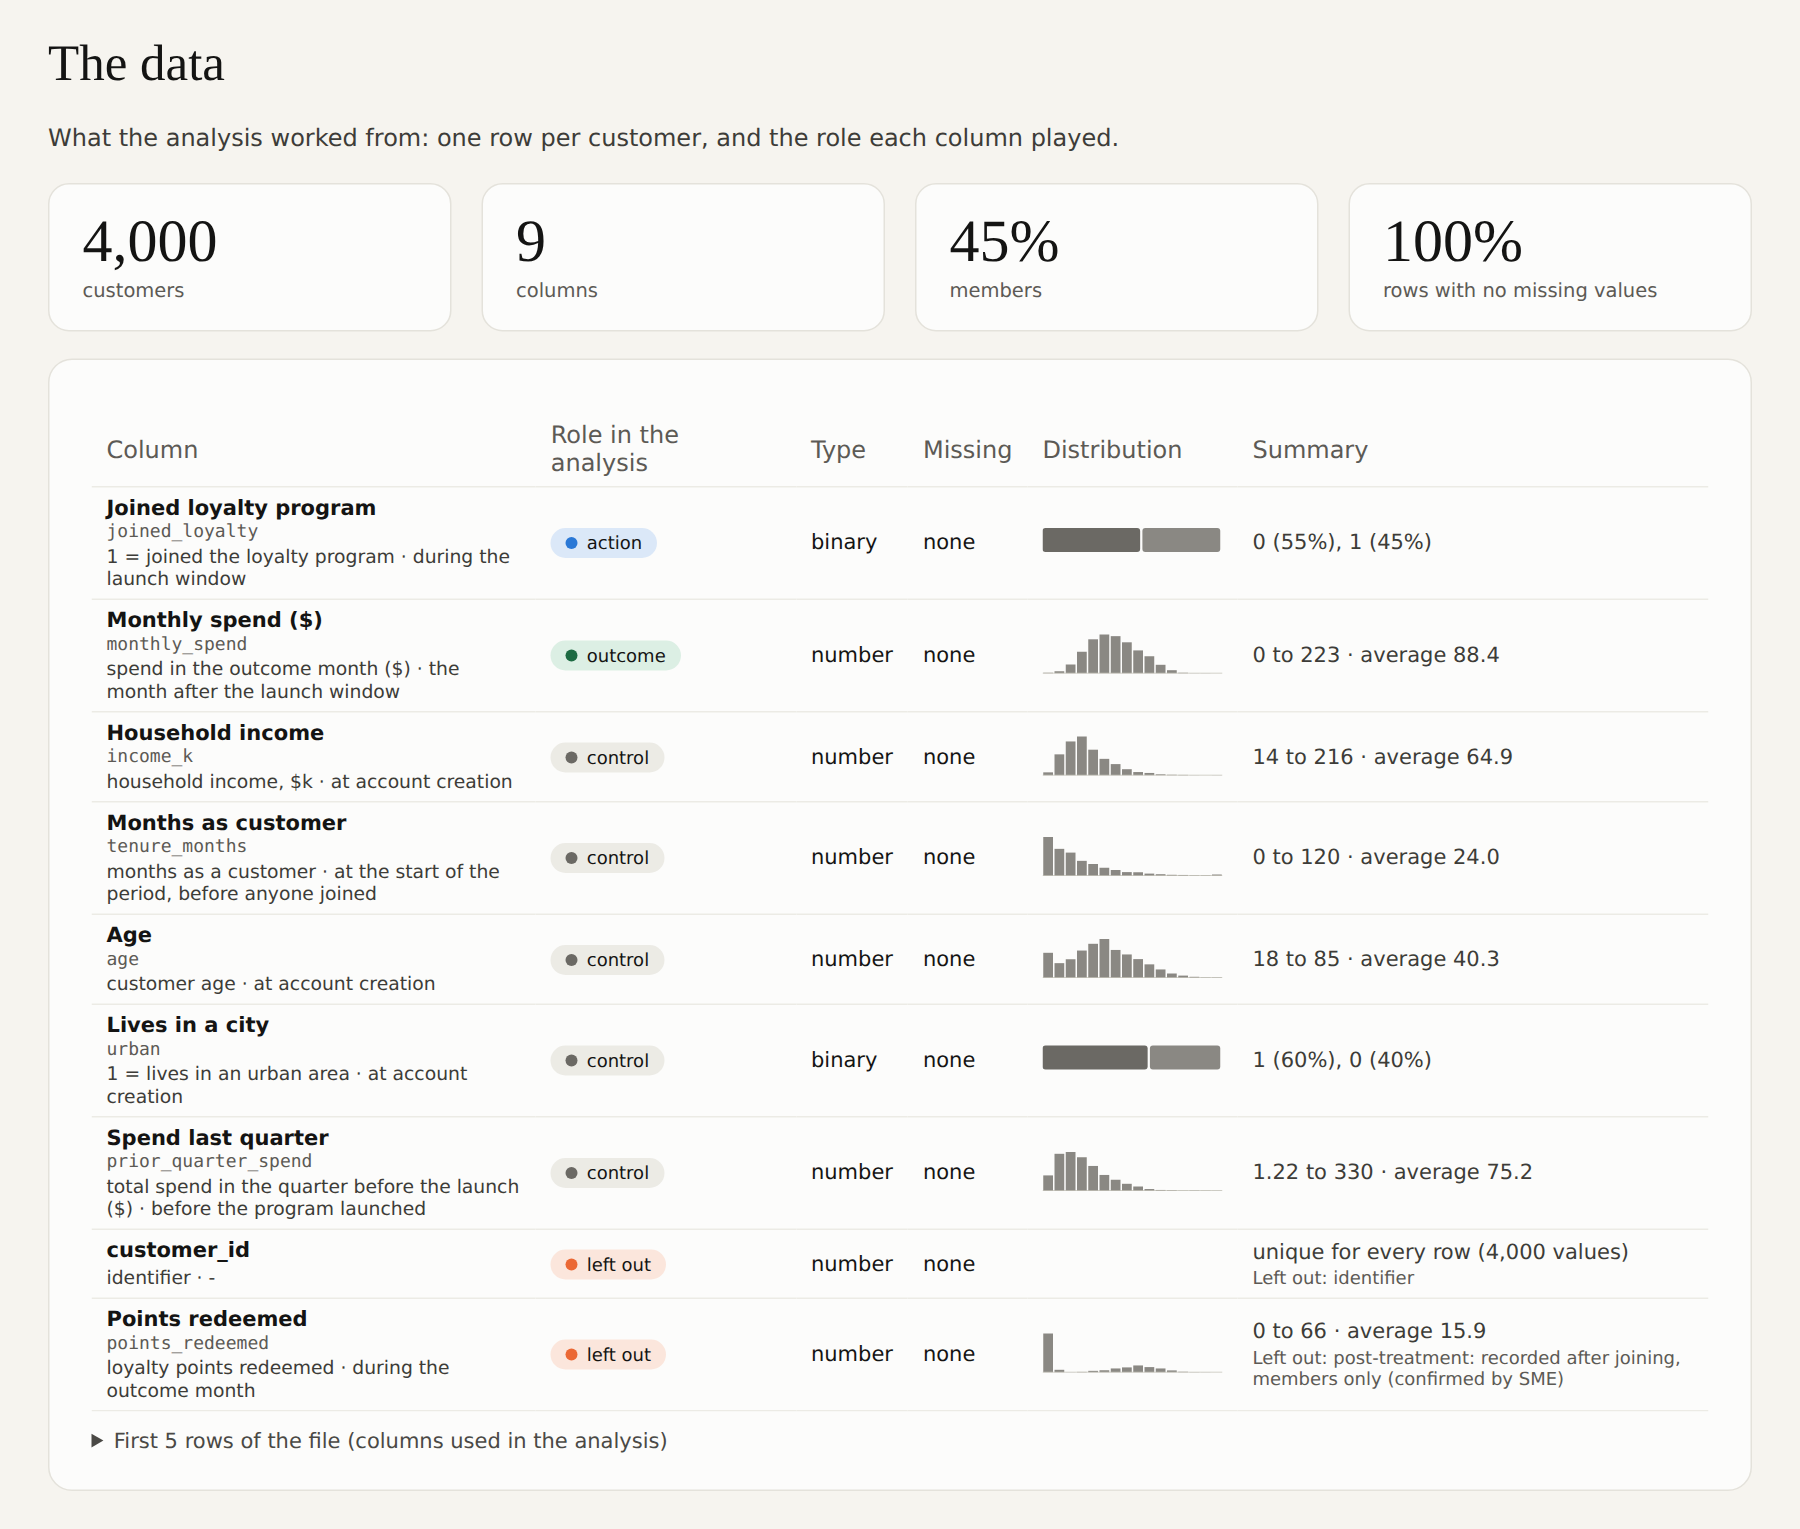 | 3 · How we think it works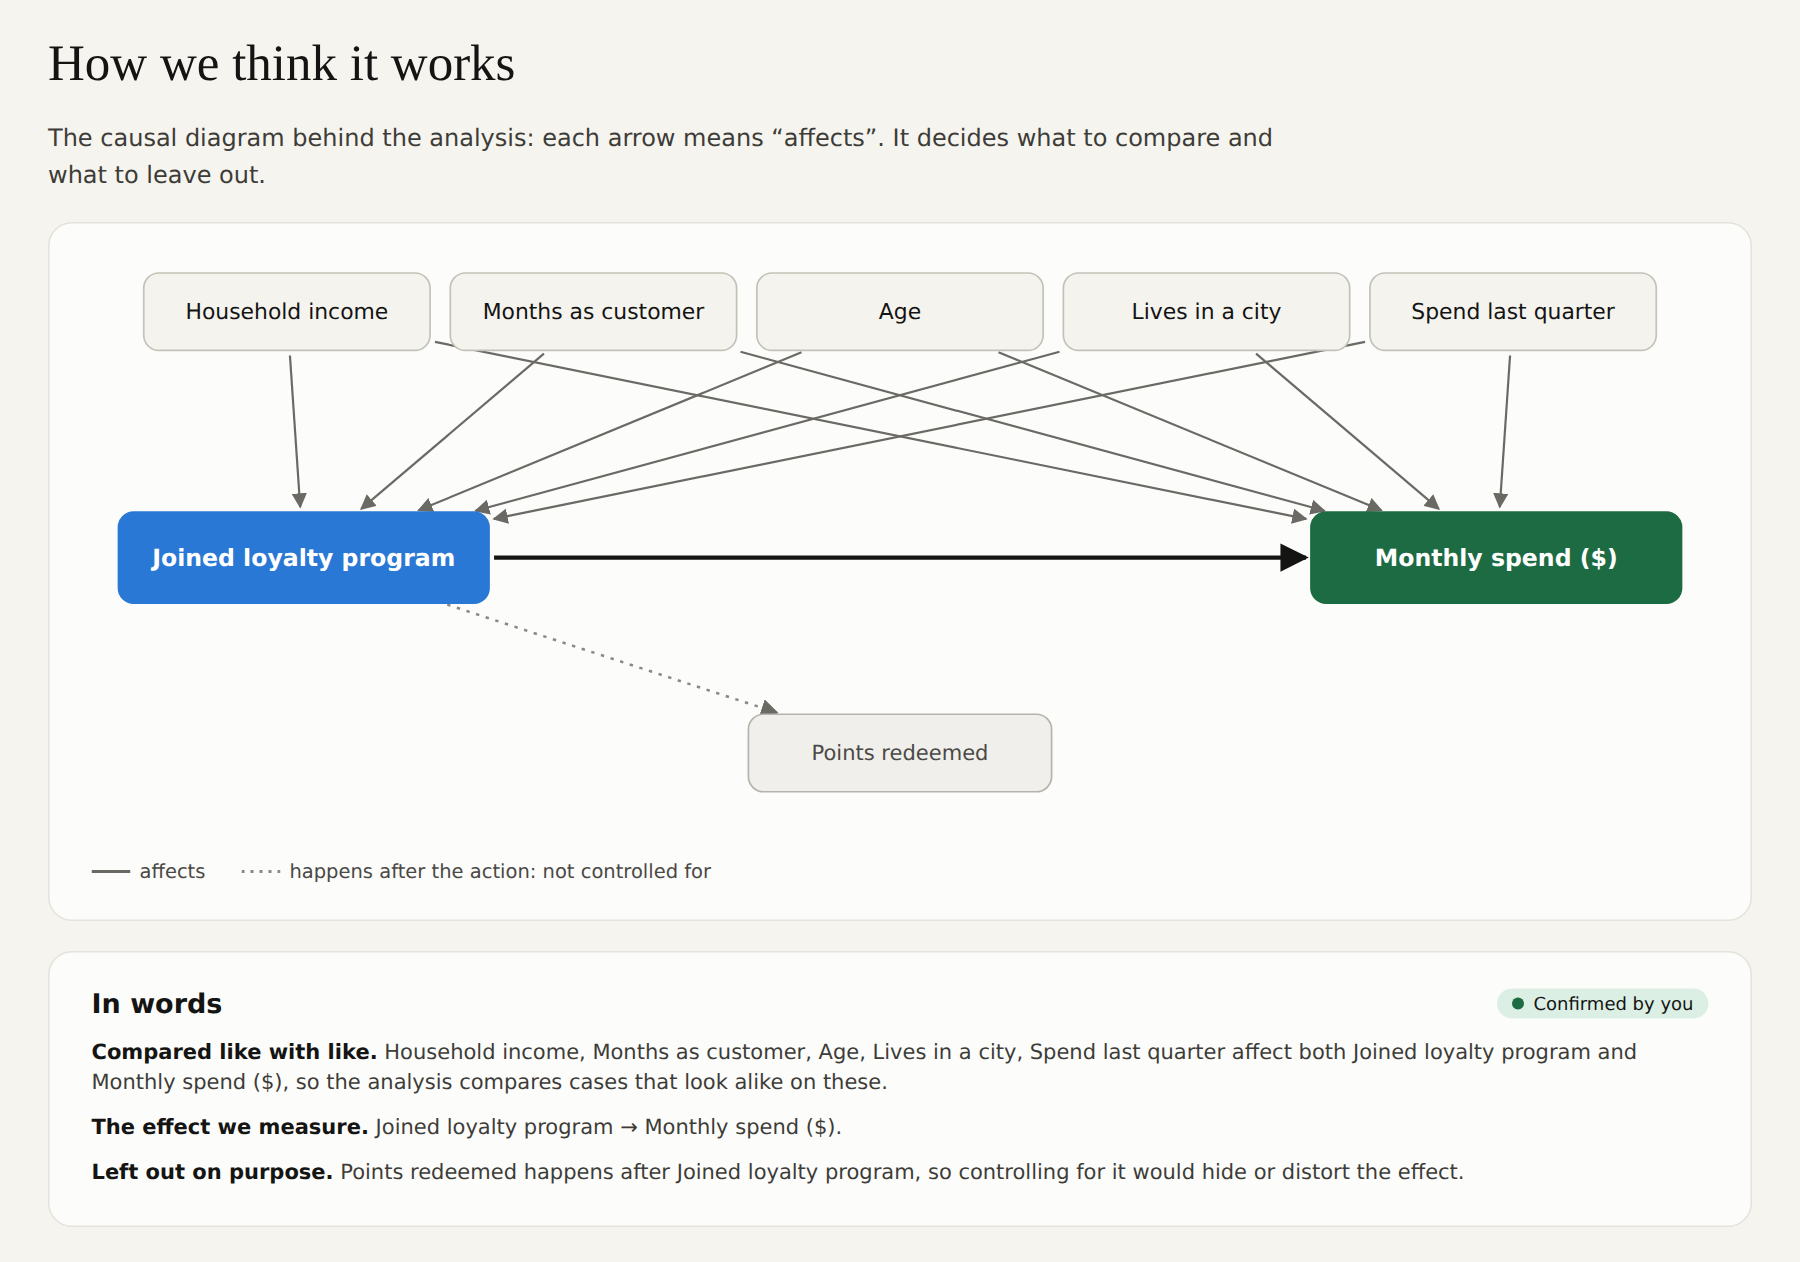 |
4 · Where the raw gap comes from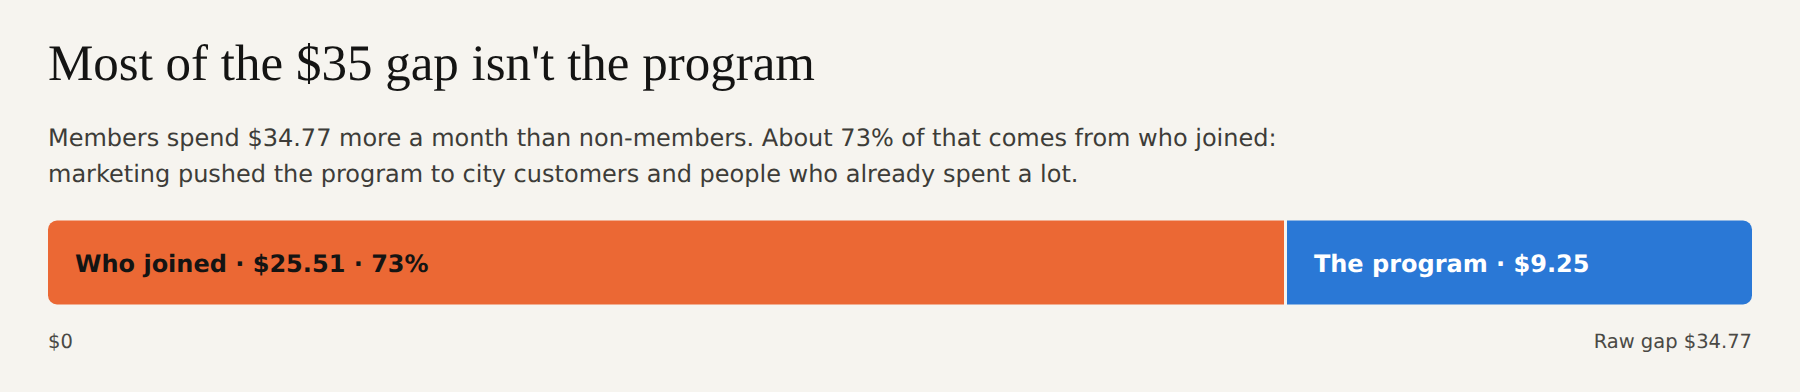 8 · Who benefits more 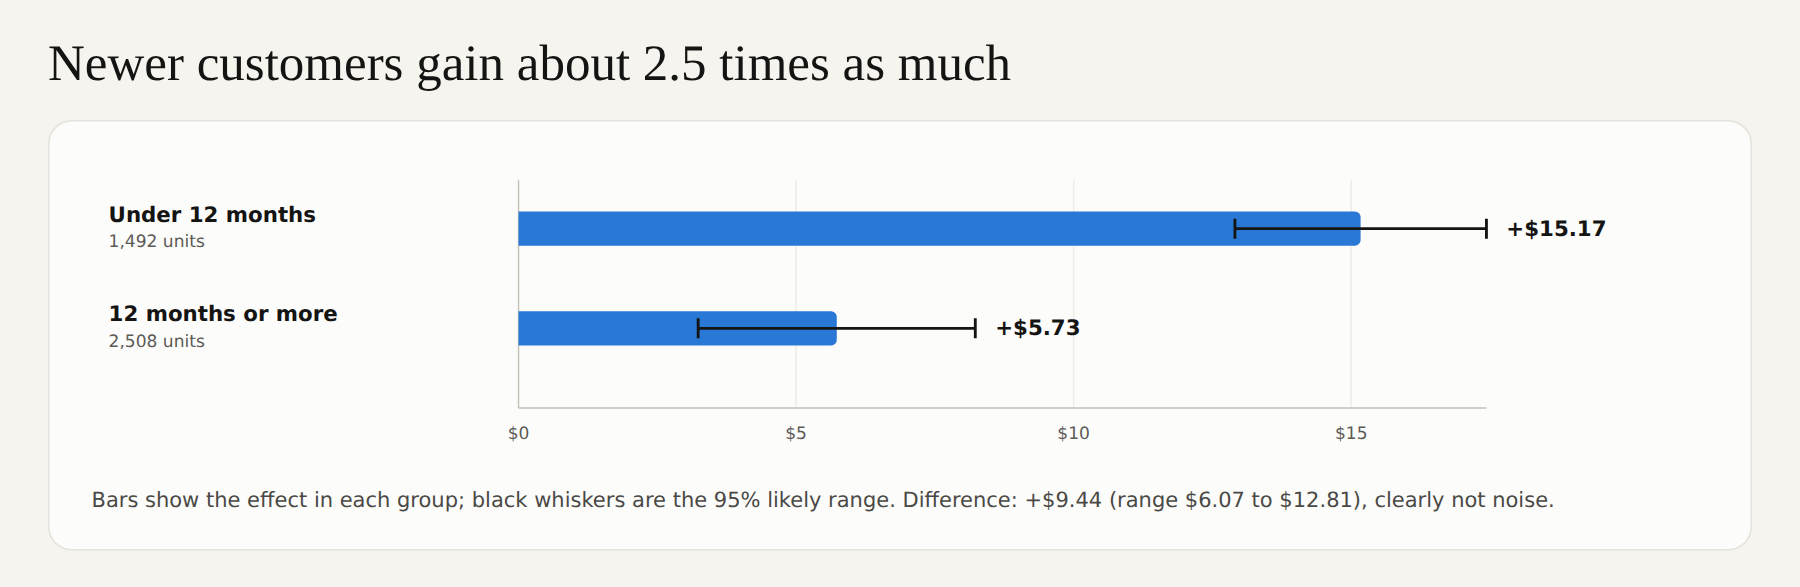 | 5 · Methods side by side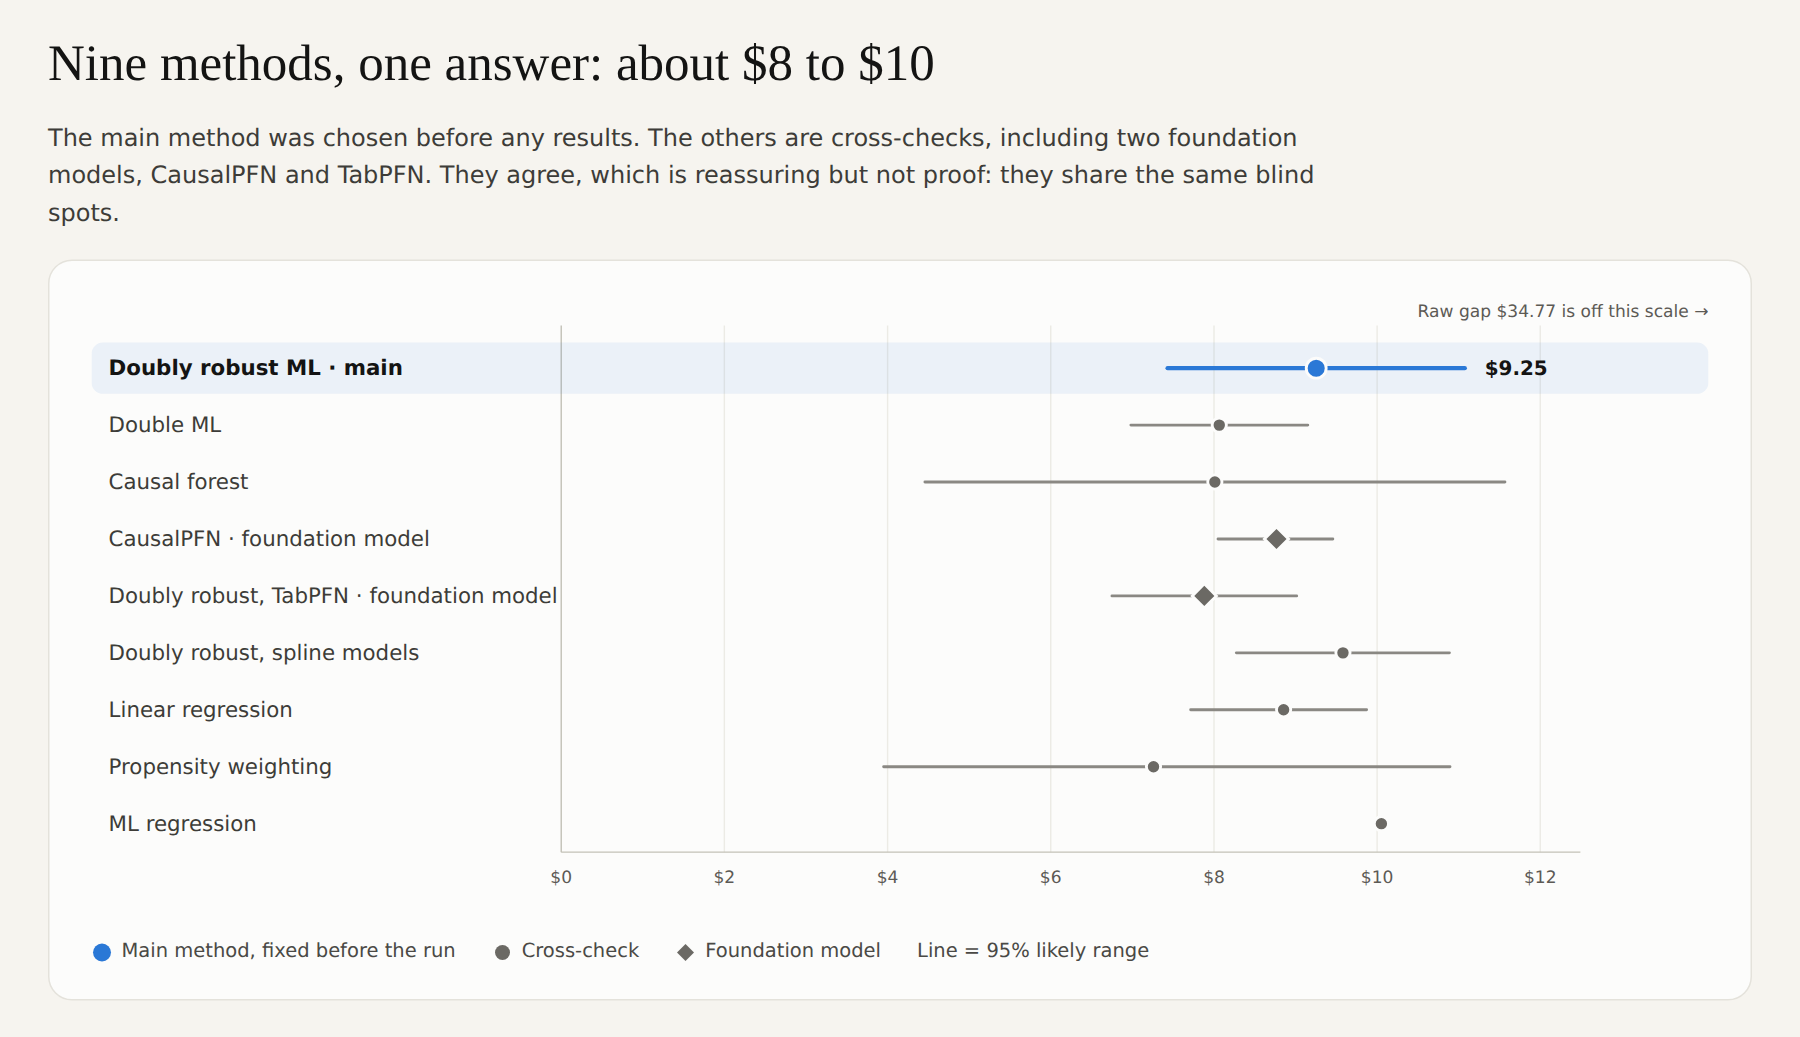 |
6 · Meet the methods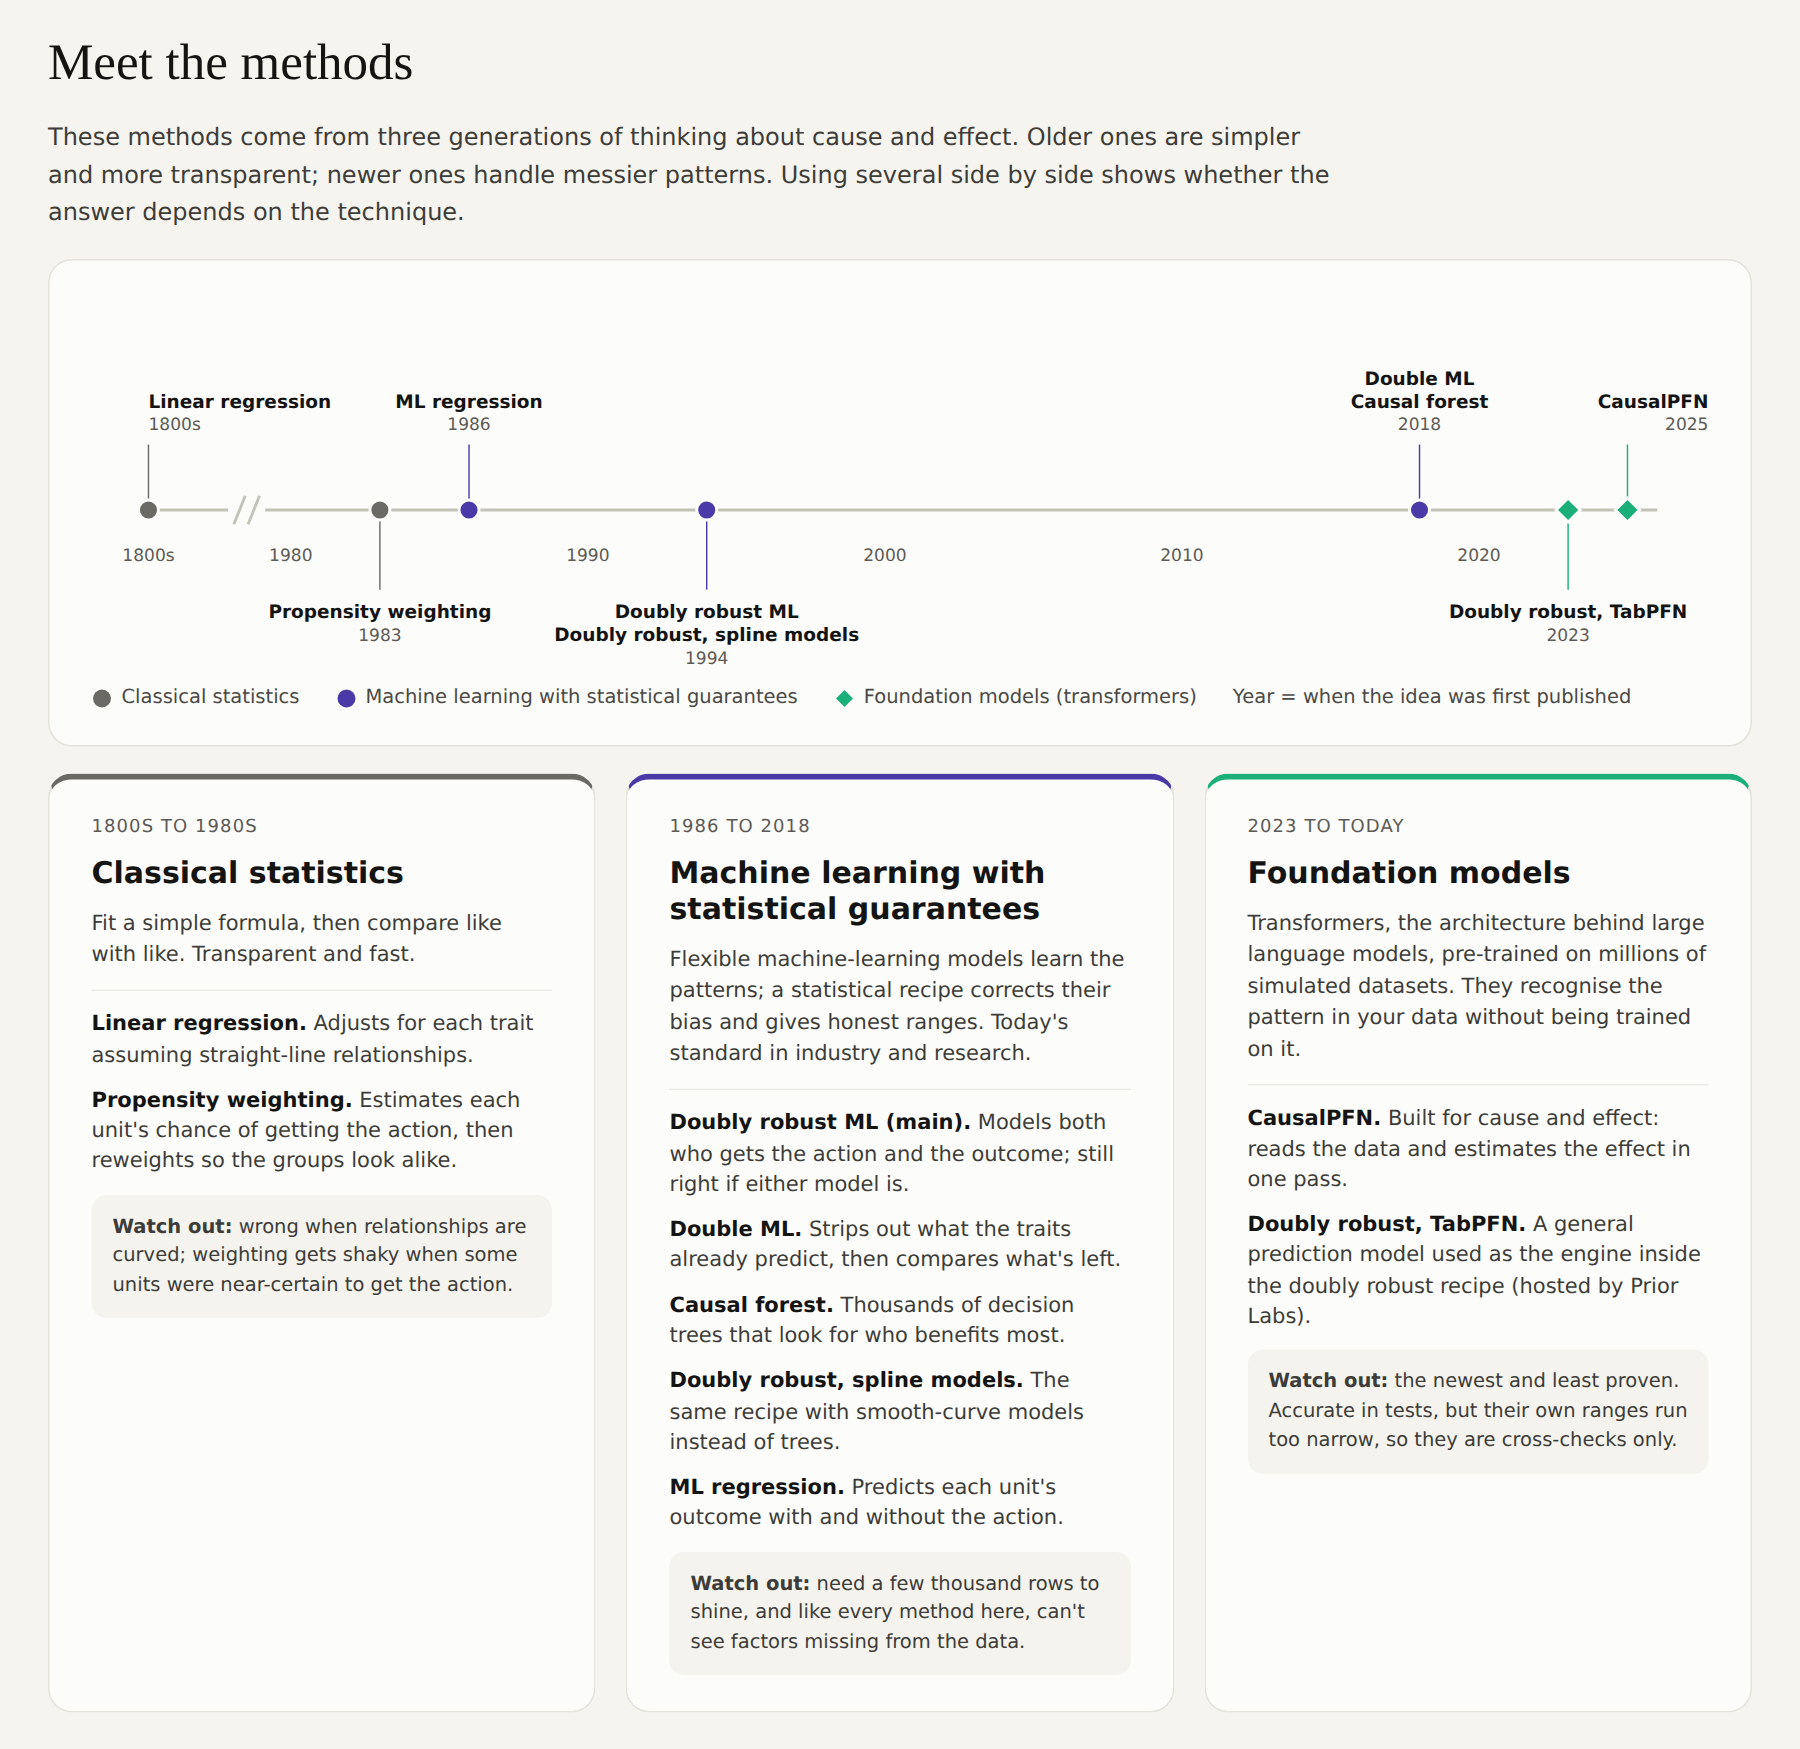 | 7 · What if our diagram is wrong?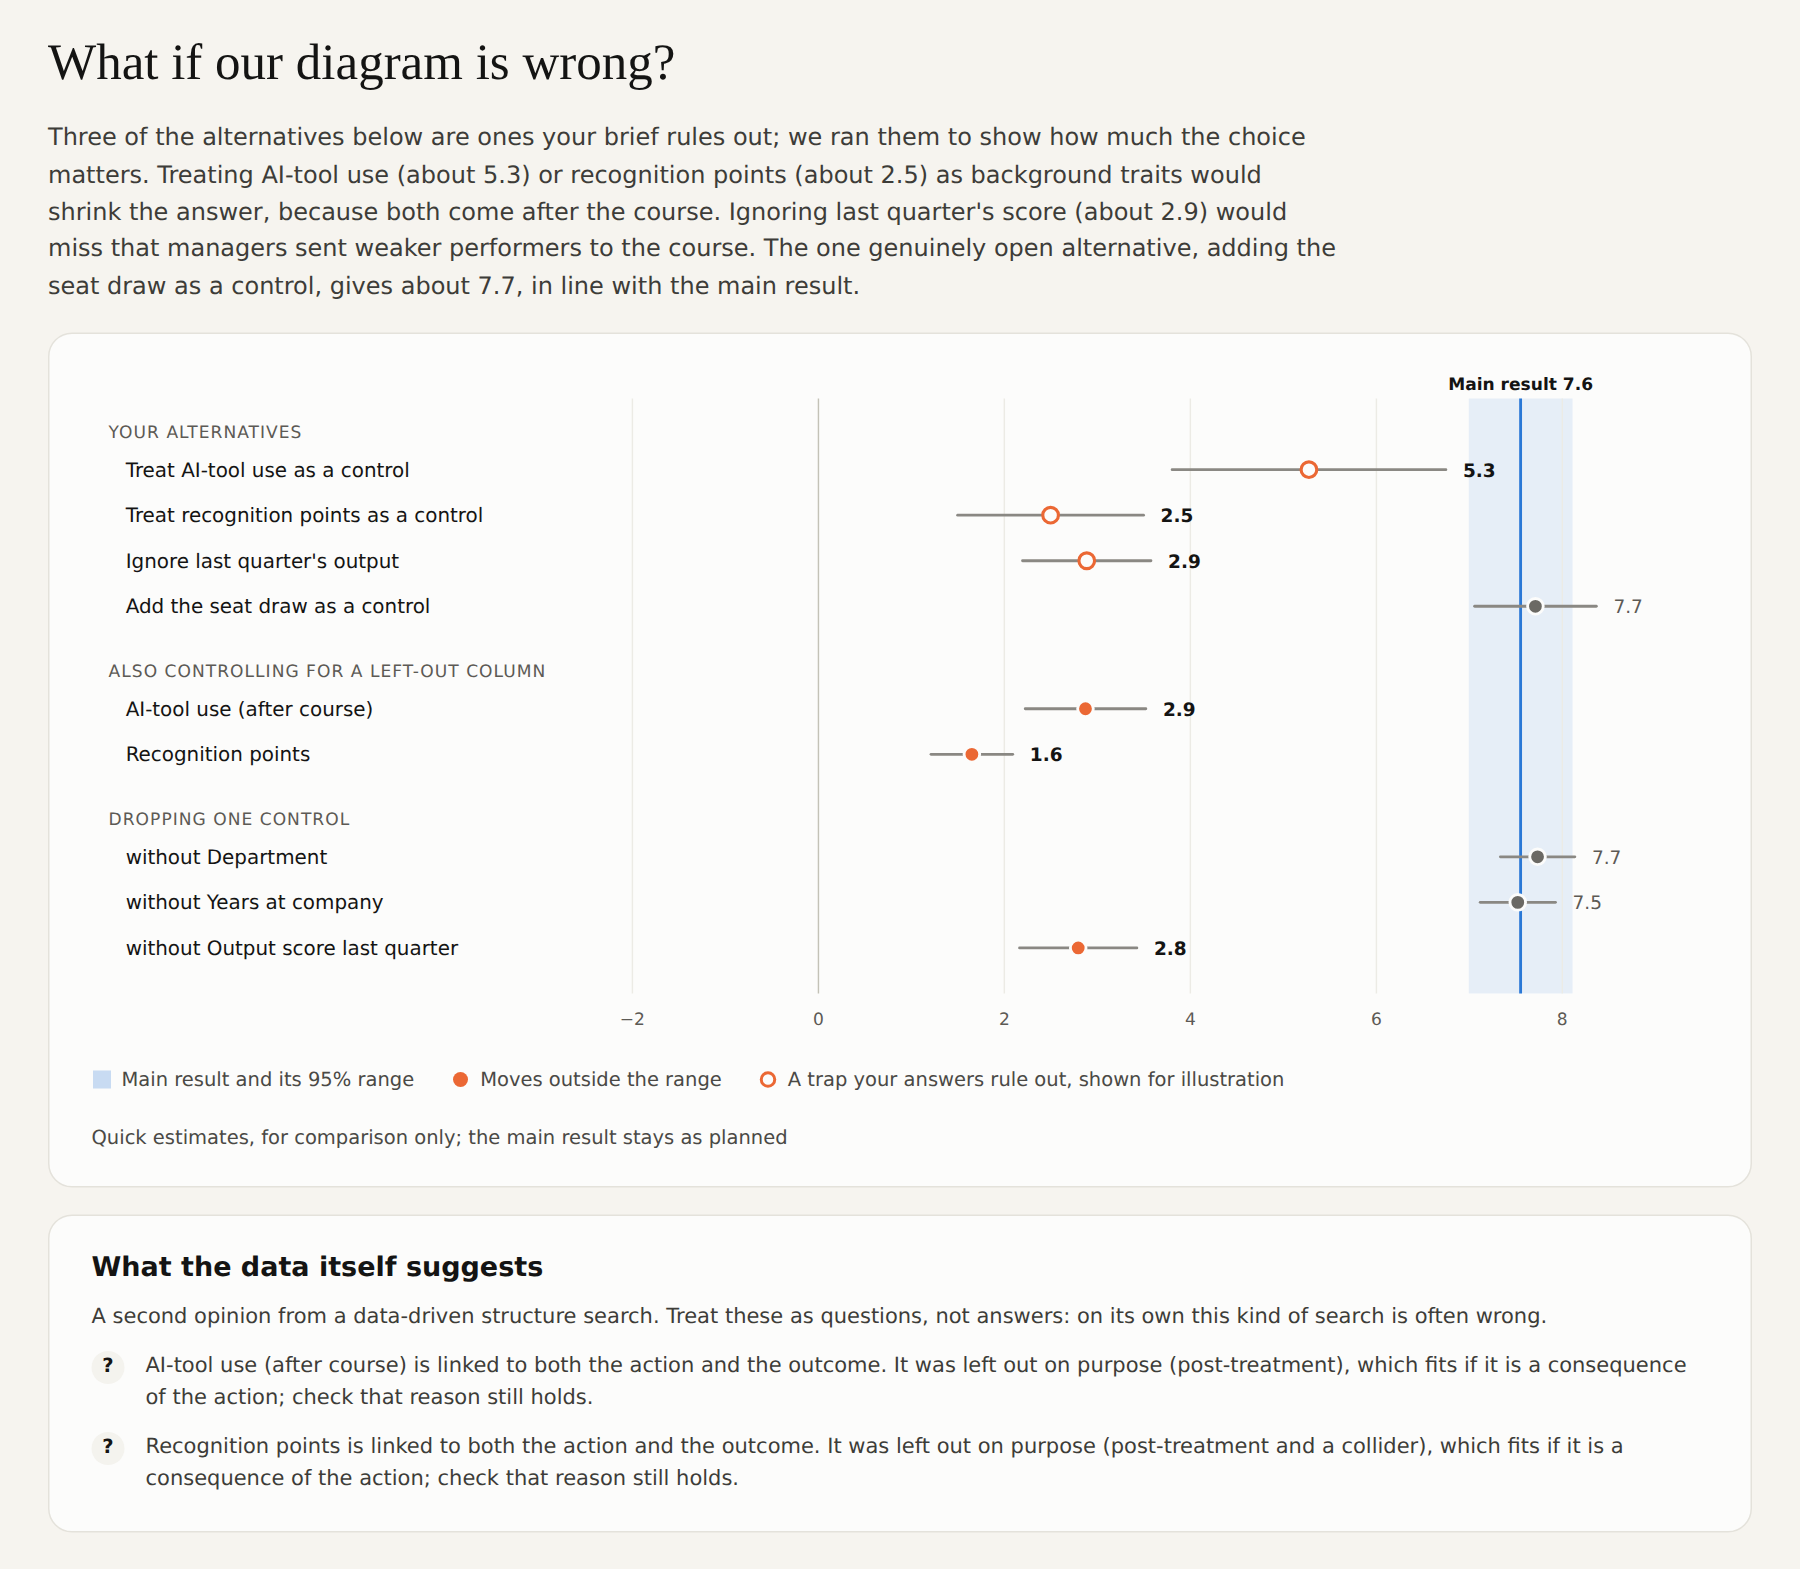 |
9 · Why the grade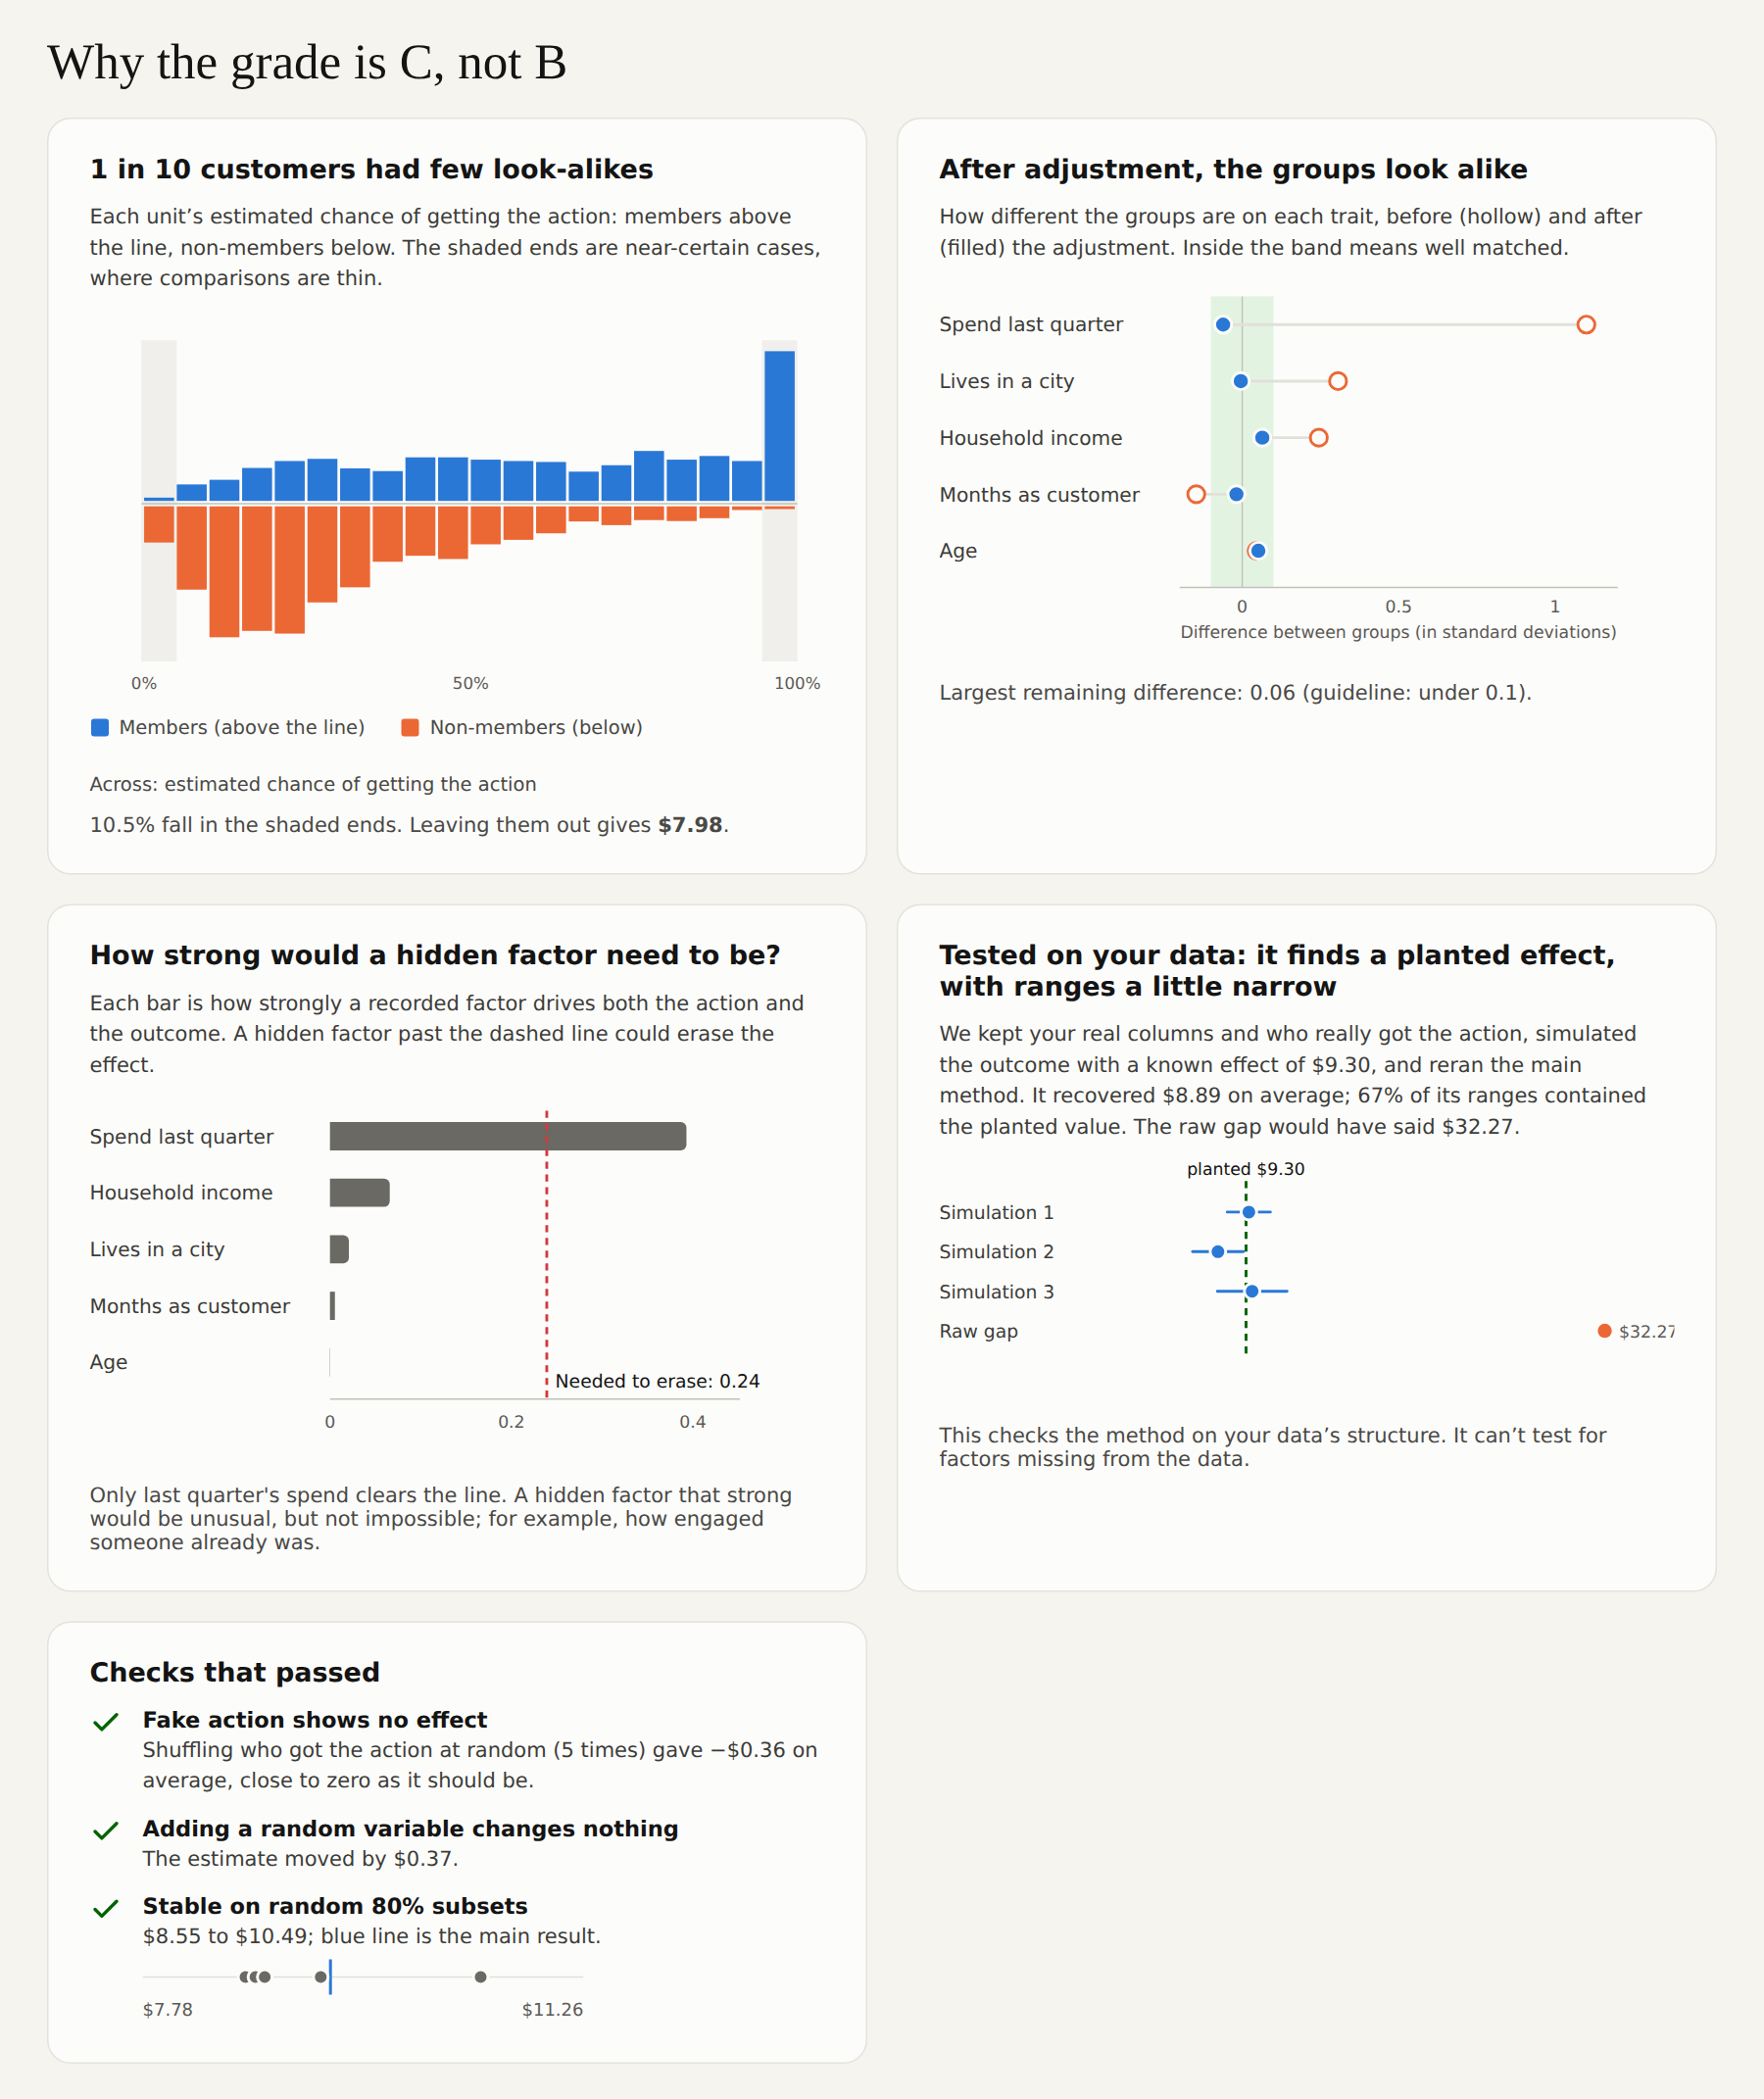 | 10 · What this rests on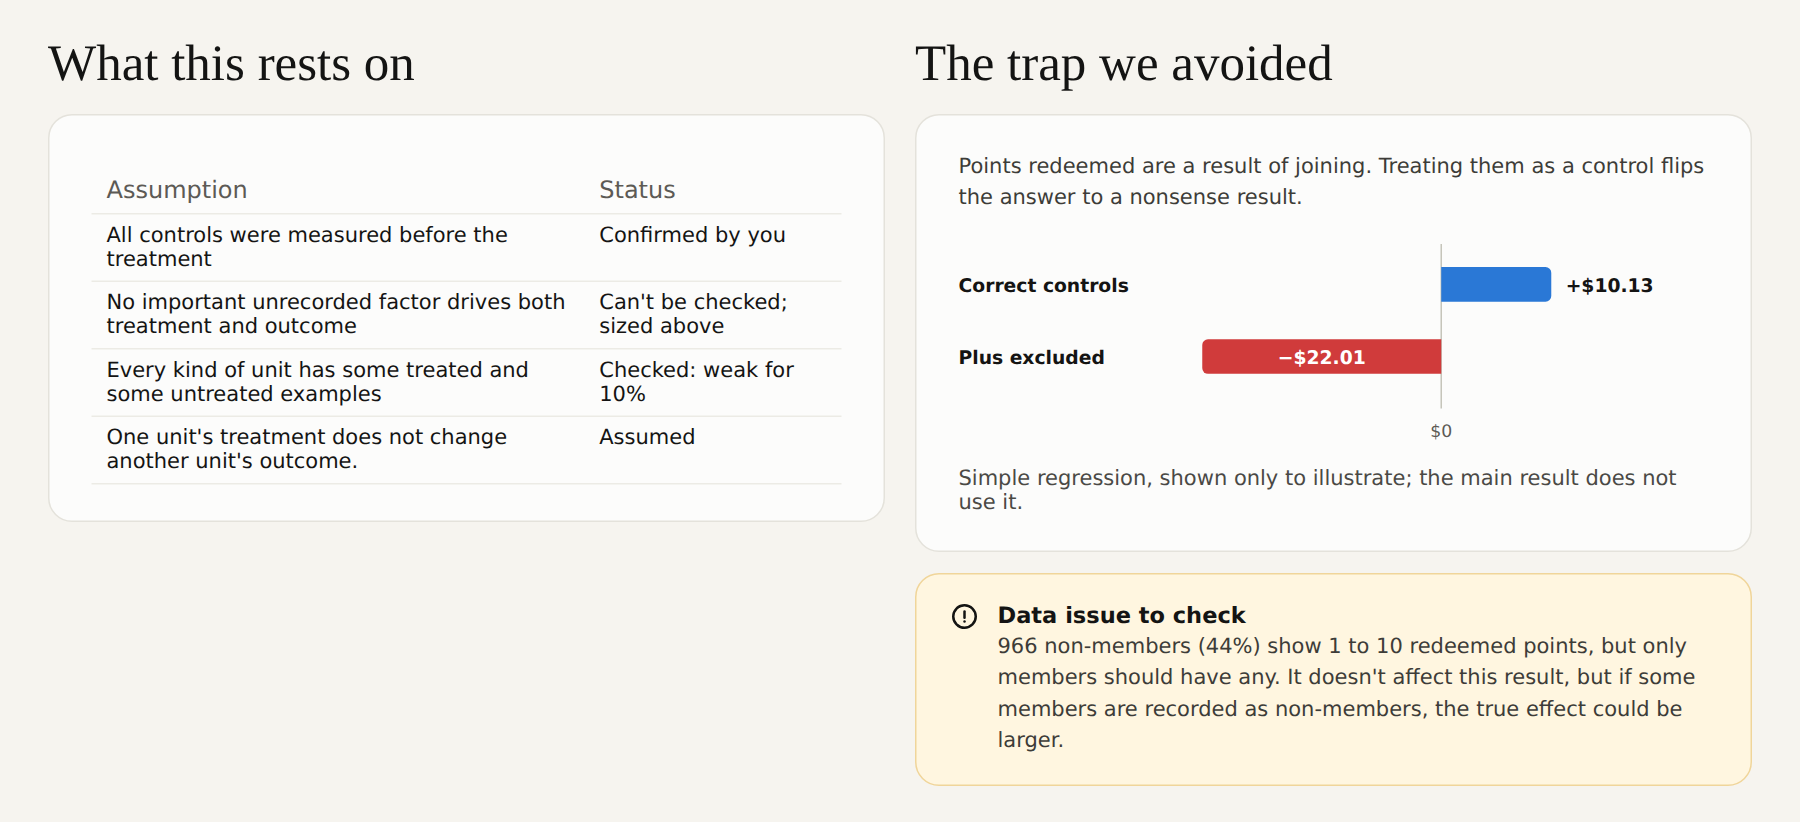 |
11 · Next steps and questions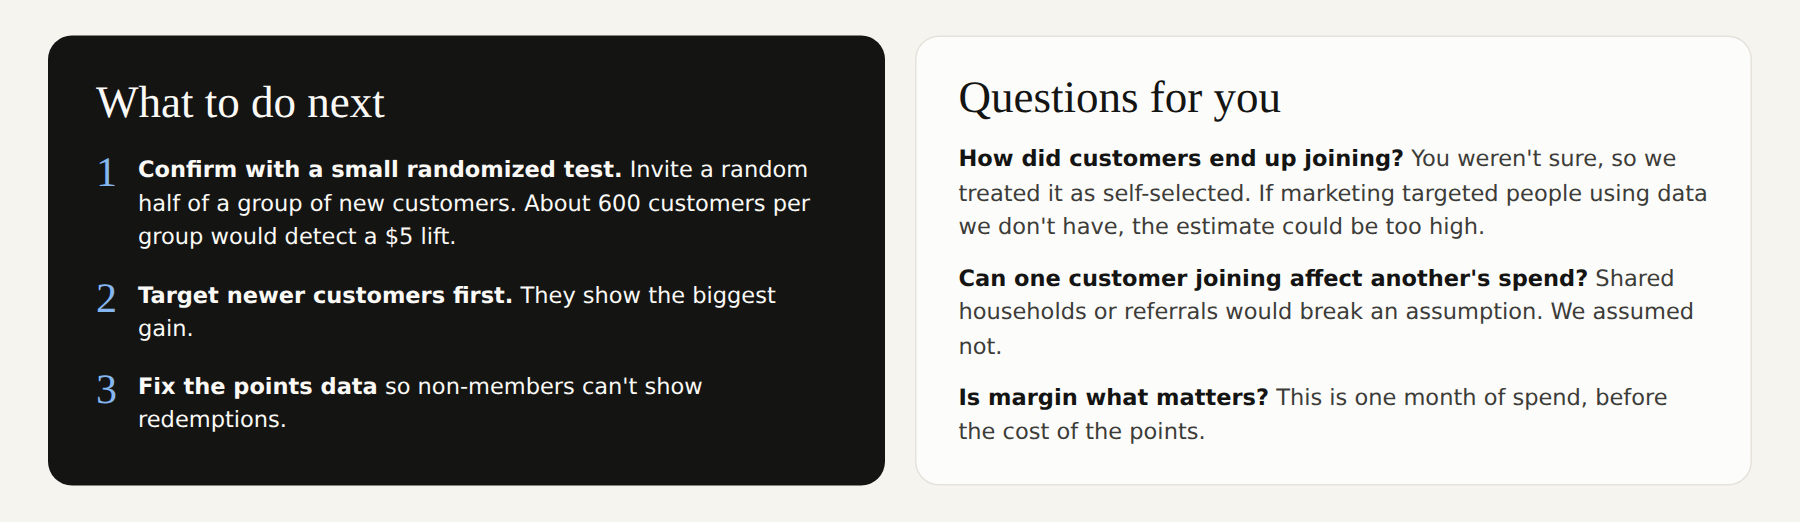 |
When the data can't answer the question, the report leads with that. The diagram shows why, and the page gives what can be said: a range the true effect lies in, and how to find out.
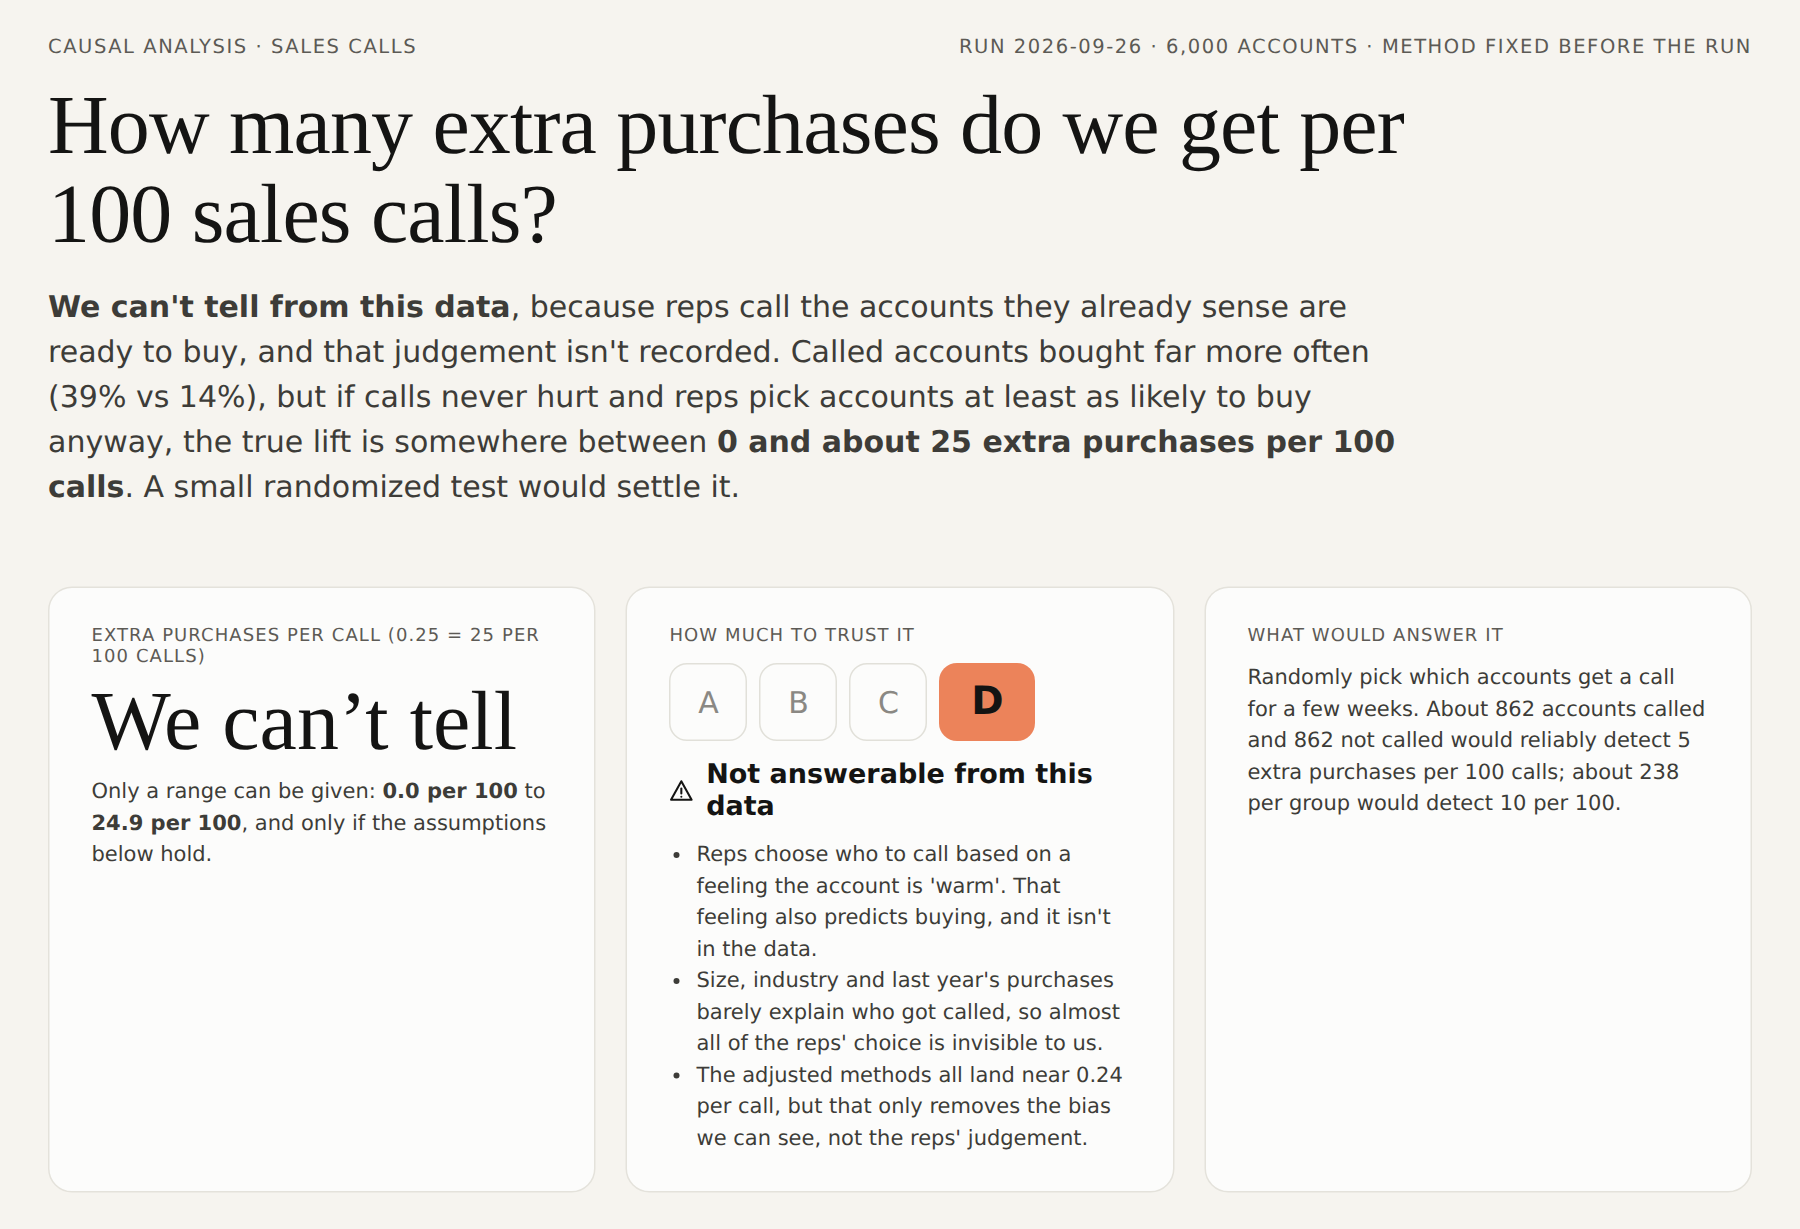 | 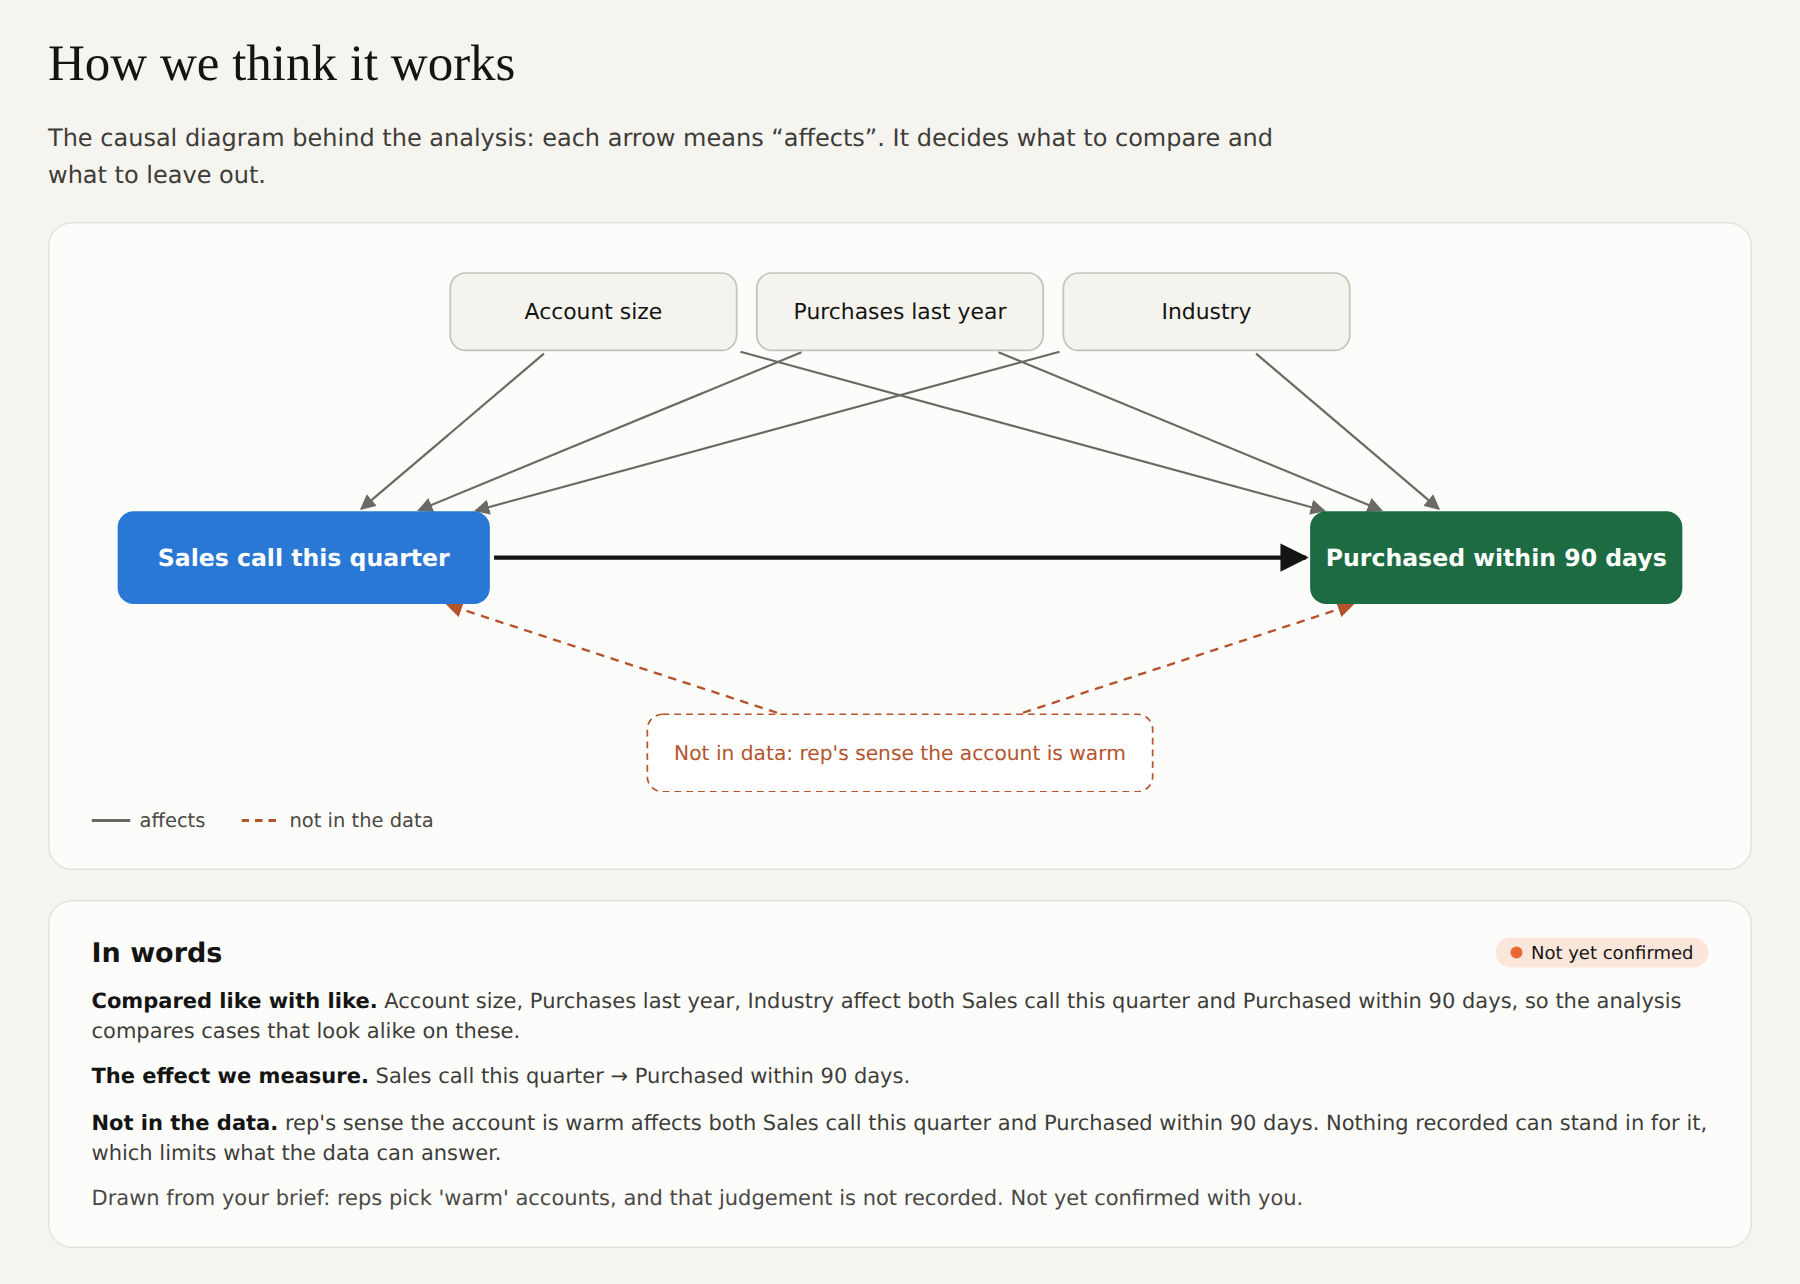 | 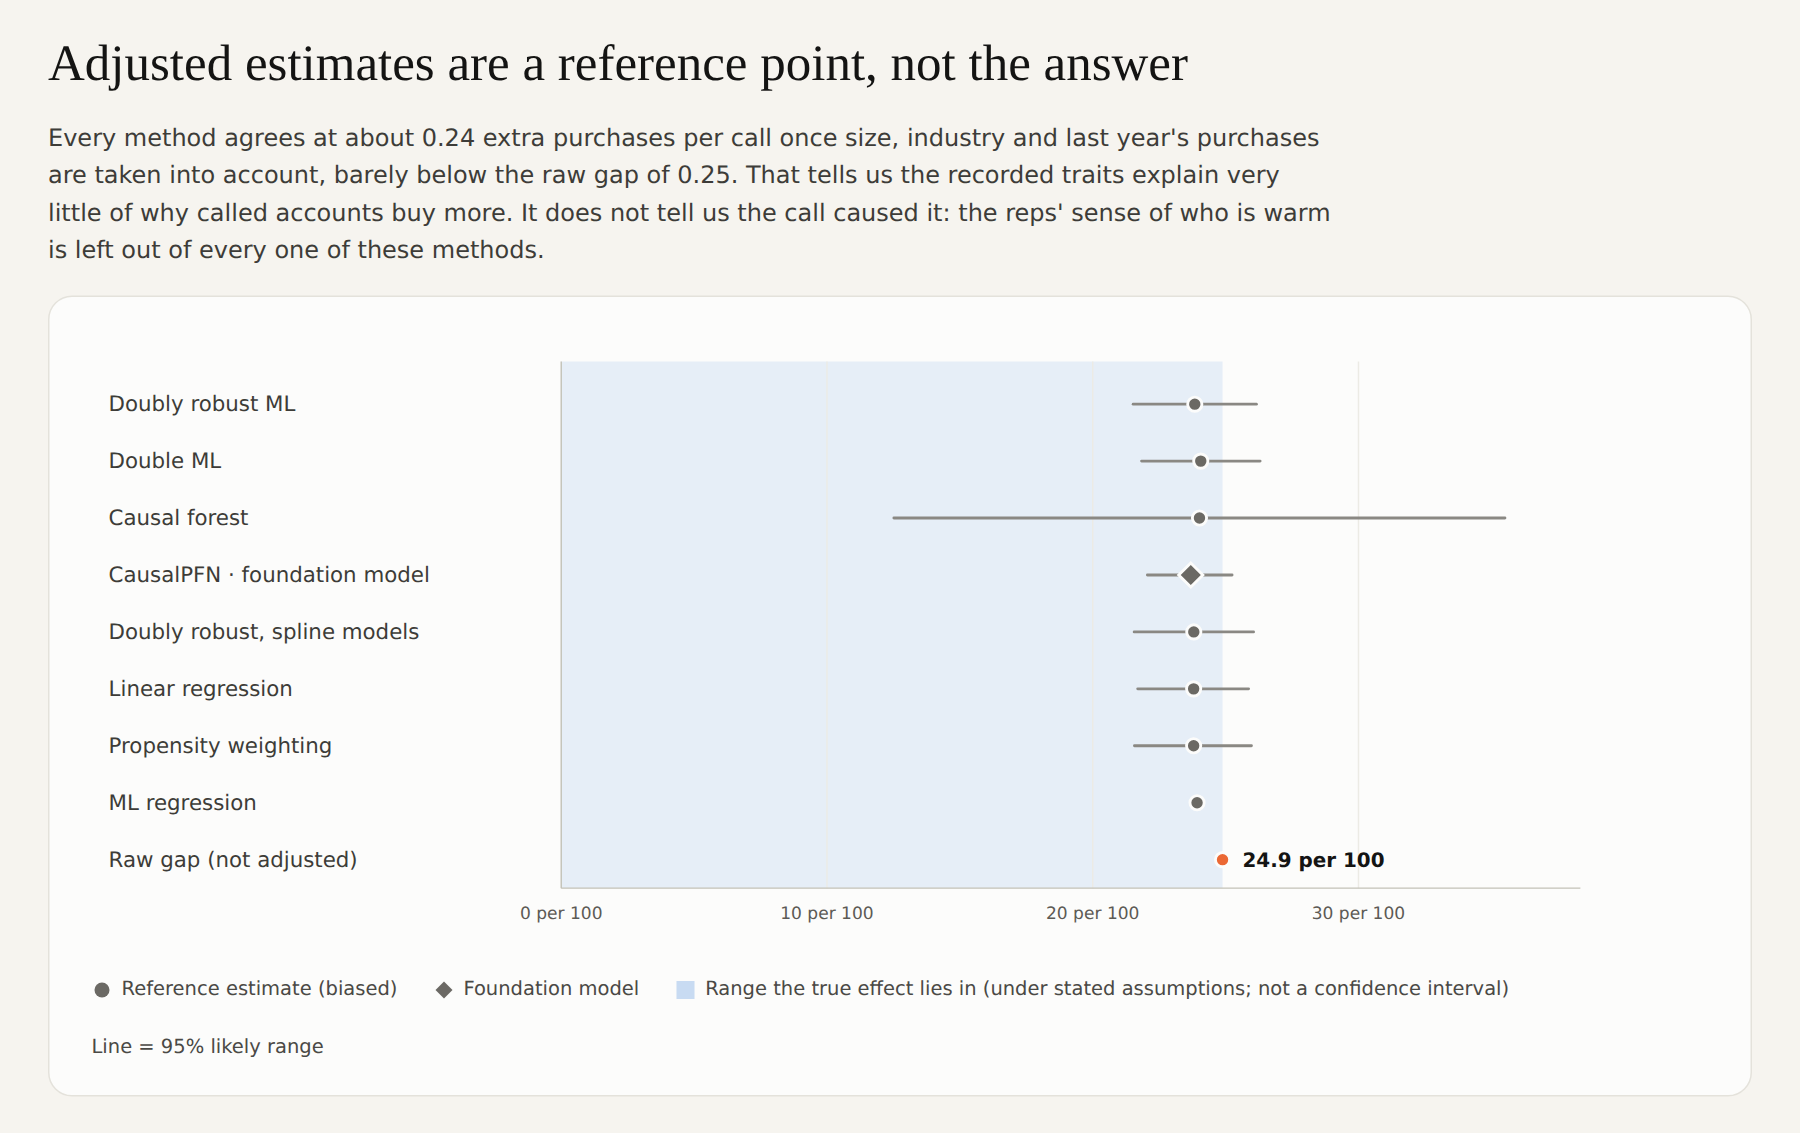 |
Open the full reports: loyalty program (grade C) · sales calls (grade D) · AI training (grade B: a misleadingly named mediator, a collider and reverse causation). The HTML files, data and every intermediate file are in examples/.
Quick start
Claude apps (claude.ai / desktop): download causal-analyst.skill from Releases and upload it in Settings, under Skills. Then attach a data file and ask your question. The skill triggers on questions like "did our loyalty program raise spend?" or "is this cause or just coincidence?"
Claude Code: copy skills/causal-analyst/ into ~/.claude/skills/ (personal) or .claude/skills/ (project).
Python dependencies are installed automatically where the environment allows. Otherwise:
pip install -r requirements.txt            # core: numpy, pandas, scikit-learn, statsmodels, econml, dowhy, matplotlib
pip install -r requirements-optional.txt   # optional: CausalPFN (local), tabpfn-client (hosted)
Without an agent: the toolkit is a plain CLI, so you can reproduce any report by hand:
cd examples/loyalty-program
S=../../skills/causal-analyst/scripts
python $S/ca.py profile  --data data.csv --treatment joined_loyalty --outcome monthly_spend --out profile.json
python $S/ca.py dag      spec.json --outdir .
python $S/ca.py identify spec.json --out identification.json
python $S/ca.py run      spec.json --out results.json      # ~1 minute on 4,000 rows
python $S/ca.py power    --sd 31 --lift 5 --results results.json
python $S/ca.py report   results.json --narrative narrative.json --out report.html
How it works
flowchart LR
  A[Your data + question] --> B[1. Profile + codebook<br/>flags odd values; you confirm<br/>what each column means]
  B --> C[2. The question<br/>action, outcome, target,<br/>groups to compare]
  C --> D[3. Assumptions interview<br/>timing, assignment, hidden drivers,<br/>reverse causation, colliders]
  D --> E[4. Diagram + plan<br/>expert confirms the DAG;<br/>alternatives named; method fixed]
  E --> F[5. Run<br/>estimators, diagnostics, design checks,<br/>sensitivity, trust grade]
  F --> G[6. Report<br/>designed HTML page]
  E -. not identifiable .-> H[Grade D:<br/>bounds, complier effect,<br/>test sizing]
  H --> G
Two rules hold throughout:
- Numbers come from the script, never from the model's head.
scripts/ca.pyproduces every estimate. Claude writes only the words (narrative.json), and the report renderer draws every chart fromresults.json. - The plan comes before the results. The main method, controls and target are written into
spec.jsonand approved before anything runs. Other methods are shown as cross-checks, never averaged in.
The methods
| Family | Methods | Role |
|---|---|---|
| Classical statistics | Linear regression, propensity weighting | Cross-checks; transparent baselines |
| Machine learning with statistical guarantees | Doubly robust ML (main), double ML, causal forest, ML regression, spline-based doubly robust | The main estimate and its closest checks |
| Foundation models (optional) | CausalPFN (local), doubly robust with TabPFN (hosted) | Cross-checks only: accurate in tests, but their own ranges run too narrow |
For amount treatments (e.g. discount size), the skill uses g-computation with the outcome model chosen by cross-validation. For "can't tell" cases it reports Manski / Manski–Pepper bounds, or instrument-based bounds and the complier effect when a random nudge exists.
Diagnostics:
- propensity overlap, with a trimmed estimate;
- covariate balance before and after weighting;
- a fake-treatment placebo and a random-common-cause test;
- stability across 80% subsamples;
- the Cinelli–Hazlett robustness value against the strongest measured confounder;
- a "bad control" illustration;
- power calculations for a confirming experiment.
Checks on the diagram itself. A correct method on the wrong diagram gives a confident wrong answer, so the run also tests the design:
- Column meanings: a codebook of what each column is and when it was recorded, drafted by Claude and confirmed by you. Unconfirmed meanings lower the grade.
- Reverse causation: the plan names a before-the-action measure of the outcome (last quarter's score, prior spend) and controls for it, or the report says why not.
- Alternative diagrams: the answer is re-estimated under the alternatives you named, with each control dropped in turn, and with each left-out column added. If a plausible alternative moves the answer outside the range, the grade says so.
- Structure second opinion: a light PC-algorithm search on the data flags controls that look like consequences (collider patterns) and unused columns linked to both action and outcome. Its findings become questions for you, never silent edits.
- Planted-effect test: the main method is rerun on your real columns and real assignment with a simulated outcome carrying a known effect. If it can't find that effect, the grade drops.
Trust grades: A randomized and checks pass · B observational, good overlap, robust to moderate hidden bias · C a weakness (weak overlap, fragile to hidden bias, methods disagree) · D the data can't answer this.
Does it work?
We ran the skill-creator eval loop on three scenarios, comparing Claude with the skill against Claude with the same prompt and no skill (details):
| Scenario | True answer | With skill | Without skill |
|---|---|---|---|
| Loyalty program with a post-treatment trap | +$9.17 | +$9.25 (7.43–11.07), grade C, trap excluded | +$9.50 (8.3–10.7), trap excluded, no grade |
| Benchmark case with an unmeasured confounder (not identifiable) | null | null; bounds −0.295 to −0.214 contain the truth | null; bounds −0.281 to −0.261 miss the truth |
| Sales calls chosen on an unrecorded "gut feel" | ≈ +5 per 100 | grade D; 0–25 per 100 contains the truth; test sized | no headline; "6 to 16 per 100" misses the truth |
| AI training: misleading mediator name, a collider, reverse causation | +7.5 | +7.55 (7.0–8.1), grade B, all three traps avoided, planted-effect test passed | +7.4 (7.0–7.8), all three traps avoided, no grade |
Assertion pass rate: 100% with the skill vs 50–57% without, at about 2–3 minutes and ~20% more tokens per run. Accuracy on clean cases is similar either way; on the AI-training case both runs avoided every trap, which tells us current frontier models handle well-described traps. The skill's added value there is the checks and the audit trail: the report shows what the answer would have been under each wrong diagram. The difference is honest ranges, abstention, pre-registration, and a report someone can act on.
The foundation-model cross-checks were benchmarked on 14 semi-synthetic datasets (results):
| Average error | 95% range covers truth | Time (CPU, 2–5k rows) | |
|---|---|---|---|
| Doubly robust ML (main) | 5.2% | 14 / 14 | ~4 s |
| CausalPFN | 2.8% | 12 / 14 | ~25–55 s |
| Doubly robust with CausalPFN outcomes | 4.1% | 13 / 14 | ~25–55 s |
CausalPFN was more accurate, especially under poor overlap, but overconfident. That is why the main method stays classical-ML and the foundation models are cross-checks.
Which model to use
| Model | Status |
|---|---|
| Claude Opus 5.5 | Tested. Every evaluation in this repo was run on it. Recommended for real decisions. |
| Other Claude models (Sonnet, Haiku) | Should work, but not yet evaluated. The scripts do the numerical work, but the steps that matter most are judgment calls: spotting post-treatment columns, deciding identification, calibrated wording. Run evals/ before relying on a smaller model. |
Non-Claude agents (e.g. GPT-6 Astra in a tool that reads SKILL.md, or any agent with a shell) | Not tested. SKILL.md is plain Markdown and the toolkit is a Python CLI, so any agent that can read instructions and run Python can drive it. Please share eval results if you try. |
The model matters less for the numbers (they're scripted) and more for knowing when not to trust them. That is where we'd spend on the strongest model available.
Data and privacy
- Everything runs locally by default. No data leaves your machine unless you opt in.
- The report includes the first 5 rows of the data so readers can see what the analysis stood on. For personal or sensitive data, set
"report_sample_rows": 0in the plan. - The hosted TabPFN cross-check sends data to Prior Labs. It runs only when the analysis plan lists
"allow_external_services": ["tabpfn_api"], which the skill sets only after you agree. Its upload also needsapi.priorlabs.aiandstorage.googleapis.comreachable. - API keys are read from
TABPFN_TOKENor a file named byTABPFN_TOKEN_FILE. Never paste keys into chat. - CausalPFN weights (~75 MB) download from Hugging Face on first use, or point
CAUSALPFN_WEIGHTSat a local copy.
Limitations and roadmap
Limitations
- One yes/no or amount action at a time, cross-sectional data. Difference-in-differences, regression discontinuity and multi-valued actions are not automated yet (the skill says so and offers a labelled one-off analysis).
- Hidden confounding can be sized, not removed. Grades B and C still rest on "nothing important is missing". The report says exactly how strong a hidden factor would need to be.
- The diagram is only as good as the answers behind it. If a column's name is misleading and nobody catches it, the diagram, and the answer, will be wrong. The codebook, alternative diagrams and structure check make this less likely, not impossible. The structure check uses linear tests and can miss nonlinear links.
- Front-door identification is detected but not estimated in this version.
- Size: comfortable up to a few hundred thousand rows on a laptop. Larger tables are what the warehouse version (below) is for.
- Tested on synthetic and semi-synthetic data with known answers, plus one benchmark case. Real-world validation is ongoing.
Roadmap
- SQL / warehouse layer: a signed-off analysis becomes a versioned contract. Models are fitted on a schedule in Databricks, Snowflake or ClickHouse, and effects are answered in SQL in seconds, with the trust grade recomputed per query.
- Realistic synthetic datasets for causal inference: a generator for complex, real-world-like scenarios with a known answer. Think hidden drivers, post-treatment traps, weak overlap, effects that vary by group, rollouts over time, and messy data. Use it to test this skill, compare methods, and train people.
- Difference-in-differences and synthetic control for before/after rollouts; regression discontinuity for score cutoffs.
- A proper one-step correction for foundation-model cross-checks (Melnychuk et al., 2026), and GPU support.
- Broader evals, including real-world benchmarks such as CausalReasoningBenchmark.
Repository layout
skills/causal-analyst/     the skill: SKILL.md, scripts/, references/
examples/                  three worked cases: data, brief, spec, results, narrative, report
evals/                     eval scenarios, assertions, benchmark results, foundation-model study
tests/                     smoke test (runs the full pipeline on the examples)
docs/images/               screenshots used in this README
Contributions, especially eval results on other models and new test cases with known answers, are welcome: see CONTRIBUTING.
Credits and licence
Built on DoWhy (identification cross-check), EconML (double ML, causal forests), scikit-learn, statsmodels, and optionally CausalPFN and TabPFN. Methods: Robins, Rotnitzky & Zhao (1994); Chernozhukov et al. (2018); Wager & Athey (2018); Cinelli & Hazlett (2020); Manski (1990); Manski & Pepper (2000); Balazadeh et al. (2025); Hollmann et al. (2025).
See CITATION.cff to cite this project. Licensed under Apache-2.0.
Contributors

8 commits
Similar repos


Languages
Python
100.0%
Causal analysis for people who aren't data scientists: an Agent Skill for Claude
Python
0
8 commits
updated Sep 26, 2026
See what people are saying
README
causal-analyst
Causal analysis for people who aren't data scientists. An Agent Skill that lets Claude answer "did X actually cause Y?" from your data. You bring the question and what you know about your business. Claude does the modelling, checks how far to trust the answer, and hands back a one-page report. When the data can't answer the question, it says so.
Live example reports: Loyalty program (grade C) · Sales calls (grade D, "can't tell") · AI training (grade B, three traps) · Quick start
Contents: Why this exists · What it's like to use · The report · Quick start · How it works · Does it work? · Which model to use · Data and privacy · Limitations and roadmap
Why this exists
Good causal analysis needs two kinds of knowledge that rarely sit in one person:
- Data science: which methods to use, how to check them, and what the numbers can and can't support.
- Domain knowledge: what happened before what, how people ended up getting the treatment, and what important factor isn't in the data.
The marketing lead knows that "points redeemed" only exists after someone joins, and that the program was pushed to big spenders. The data scientist knows that controlling for points will wreck the estimate, and that targeting big spenders creates a gap that isn't the program's doing. Usually it takes both people and a lot of back and forth. Often the domain expert simply ends up with a correlation.
This skill lets the domain expert work directly with Claude. Claude handles the modelling. It asks, in plain language, only the questions that need domain knowledge, turns the answers into a causal diagram the expert confirms, then runs and checks the analysis and explains the result. The expert supplies what only they know; the skill supplies the rest.
It also guards against the ways capable models go wrong. Frontier models already get the arithmetic right: in our tests plain Claude matched the skill's estimate on a clean case to within a few percent. The failures are judgment calls:
- Controlling for the wrong thing. Adjusting for "points redeemed" turns a +$10 effect into −$22.
- Answering a question the data can't support. If reps pick whom to call using a gut feel that isn't recorded, no amount of adjustment recovers the effect of a call.
- Choosing the method after seeing the results, and quietly drifting toward the hoped-for answer.
- Overstating certainty. Plain Claude twice gave confident ranges that missed the true answer.
So the workflow puts those judgments in the open. Controls are confirmed as recorded before the treatment. The expert signs off the diagram. The method is fixed in advance. There's an explicit "we can't tell" grade, and the risk from hidden factors is sized.
What it's like to use
You attach a file and ask in your own words. The skill takes it from there, stopping three times for your input.
You: [attaches customers.csv] Did our loyalty program actually raise monthly spend? We think newer customers benefit more.
1. Claude checks the data and points out anything odd before going further:
4,000 customers, 9 columns.
points_redeemedalmost perfectly predicts who joined, which usually means it's a result of joining. And 44% of non-members have some points, which shouldn't happen. I'll flag that.
2. It confirms what each column means. Column names mislead (is usage_idx measured before or after the training?), so Claude writes down its reading of every column and when it was recorded, and you correct it.
3. It asks what only you know, one question at a time, as clickable options:
Were income, tenure, age, city and last quarter's spend all recorded before customers joined? ○ Yes ○ Some were later ○ Not sure
Is there anything that affects both who joins and how much they spend that isn't in this file? ○ No ○ Yes: ___ ○ Not sure
Could past spending have driven who joined, rather than only the other way round? ○ Yes, big spenders were targeted ○ No ○ Not sure
4. You confirm the diagram and the plan. Claude draws how it thinks things work, you correct it, and the main method is fixed before anything runs. Where you weren't sure, Claude writes down the alternative diagrams too.
5. You get the report about a minute later. It gives the answer, how much to trust it and why, who benefits most, and the randomized test that would settle it.
The report
A self-contained HTML page: it works offline, on a phone, and prints cleanly. It reads top to bottom as a story. Here is the answer; here is what it stood on; here is how sure we are; here is what to do.
| # | Section | What it answers |
|---|---|---|
| 1 | Headline + trust grade (A–D) | What's the effect, how sure are we, who gains most |
| 2 | The data | How big it is, each column's role (action, outcome, control, left out), distributions, the first few rows |
| 3 | How we think it works | The causal diagram, in a picture and in words, and whether you confirmed it |
| 4 | Where the raw gap comes from | How much of the naive difference is who got the action vs the action itself |
| 5 | Methods side by side | Does the answer depend on the technique? |
| 6 | Meet the methods | A timeline and plain-English guide to each method family |
| 7 | What if our diagram is wrong? | The answer under alternative diagrams, and what the data itself suggests about the structure |
| 8 | Who benefits more | Effects for the groups you asked about, with ranges |
| 9 | Why the grade | Overlap, balance, hidden-factor strength, a planted-effect test on your own data, placebo and stability checks |
| 10 | What this rests on | Every assumption and its status; the trap that was avoided; data issues |
| 11 | Next steps and questions | A sized randomized test, and every assumption made on your behalf |
| 2 · The data | 3 · How we think it works |
| 4 · Where the raw gap comes from 8 · Who benefits more | 5 · Methods side by side |
| 6 · Meet the methods | 7 · What if our diagram is wrong? |
| 9 · Why the grade | 10 · What this rests on |
| 11 · Next steps and questions |
When the data can't answer the question, the report leads with that. The diagram shows why, and the page gives what can be said: a range the true effect lies in, and how to find out.
| | |
Open the full reports: loyalty program (grade C) · sales calls (grade D) · AI training (grade B: a misleadingly named mediator, a collider and reverse causation). The HTML files, data and every intermediate file are in examples/.
Quick start
Claude apps (claude.ai / desktop): download causal-analyst.skill from Releases and upload it in Settings, under Skills. Then attach a data file and ask your question. The skill triggers on questions like "did our loyalty program raise spend?" or "is this cause or just coincidence?"
Claude Code: copy skills/causal-analyst/ into ~/.claude/skills/ (personal) or .claude/skills/ (project).
Python dependencies are installed automatically where the environment allows. Otherwise:
pip install -r requirements.txt            # core: numpy, pandas, scikit-learn, statsmodels, econml, dowhy, matplotlib
pip install -r requirements-optional.txt   # optional: CausalPFN (local), tabpfn-client (hosted)
Without an agent: the toolkit is a plain CLI, so you can reproduce any report by hand:
cd examples/loyalty-program
S=../../skills/causal-analyst/scripts
python $S/ca.py profile  --data data.csv --treatment joined_loyalty --outcome monthly_spend --out profile.json
python $S/ca.py dag      spec.json --outdir .
python $S/ca.py identify spec.json --out identification.json
python $S/ca.py run      spec.json --out results.json      # ~1 minute on 4,000 rows
python $S/ca.py power    --sd 31 --lift 5 --results results.json
python $S/ca.py report   results.json --narrative narrative.json --out report.html
How it works
flowchart LR
  A[Your data + question] --> B[1. Profile + codebook<br/>flags odd values; you confirm<br/>what each column means]
  B --> C[2. The question<br/>action, outcome, target,<br/>groups to compare]
  C --> D[3. Assumptions interview<br/>timing, assignment, hidden drivers,<br/>reverse causation, colliders]
  D --> E[4. Diagram + plan<br/>expert confirms the DAG;<br/>alternatives named; method fixed]
  E --> F[5. Run<br/>estimators, diagnostics, design checks,<br/>sensitivity, trust grade]
  F --> G[6. Report<br/>designed HTML page]
  E -. not identifiable .-> H[Grade D:<br/>bounds, complier effect,<br/>test sizing]
  H --> G
Two rules hold throughout:
- Numbers come from the script, never from the model's head.
scripts/ca.pyproduces every estimate. Claude writes only the words (narrative.json), and the report renderer draws every chart fromresults.json. - The plan comes before the results. The main method, controls and target are written into
spec.jsonand approved before anything runs. Other methods are shown as cross-checks, never averaged in.
The methods
| Family | Methods | Role |
|---|---|---|
| Classical statistics | Linear regression, propensity weighting | Cross-checks; transparent baselines |
| Machine learning with statistical guarantees | Doubly robust ML (main), double ML, causal forest, ML regression, spline-based doubly robust | The main estimate and its closest checks |
| Foundation models (optional) | CausalPFN (local), doubly robust with TabPFN (hosted) | Cross-checks only: accurate in tests, but their own ranges run too narrow |
For amount treatments (e.g. discount size), the skill uses g-computation with the outcome model chosen by cross-validation. For "can't tell" cases it reports Manski / Manski–Pepper bounds, or instrument-based bounds and the complier effect when a random nudge exists.
Diagnostics:
- propensity overlap, with a trimmed estimate;
- covariate balance before and after weighting;
- a fake-treatment placebo and a random-common-cause test;
- stability across 80% subsamples;
- the Cinelli–Hazlett robustness value against the strongest measured confounder;
- a "bad control" illustration;
- power calculations for a confirming experiment.
Checks on the diagram itself. A correct method on the wrong diagram gives a confident wrong answer, so the run also tests the design:
- Column meanings: a codebook of what each column is and when it was recorded, drafted by Claude and confirmed by you. Unconfirmed meanings lower the grade.
- Reverse causation: the plan names a before-the-action measure of the outcome (last quarter's score, prior spend) and controls for it, or the report says why not.
- Alternative diagrams: the answer is re-estimated under the alternatives you named, with each control dropped in turn, and with each left-out column added. If a plausible alternative moves the answer outside the range, the grade says so.
- Structure second opinion: a light PC-algorithm search on the data flags controls that look like consequences (collider patterns) and unused columns linked to both action and outcome. Its findings become questions for you, never silent edits.
- Planted-effect test: the main method is rerun on your real columns and real assignment with a simulated outcome carrying a known effect. If it can't find that effect, the grade drops.
Trust grades: A randomized and checks pass · B observational, good overlap, robust to moderate hidden bias · C a weakness (weak overlap, fragile to hidden bias, methods disagree) · D the data can't answer this.
Does it work?
We ran the skill-creator eval loop on three scenarios, comparing Claude with the skill against Claude with the same prompt and no skill (details):
| Scenario | True answer | With skill | Without skill |
|---|---|---|---|
| Loyalty program with a post-treatment trap | +$9.17 | +$9.25 (7.43–11.07), grade C, trap excluded | +$9.50 (8.3–10.7), trap excluded, no grade |
| Benchmark case with an unmeasured confounder (not identifiable) | null | null; bounds −0.295 to −0.214 contain the truth | null; bounds −0.281 to −0.261 miss the truth |
| Sales calls chosen on an unrecorded "gut feel" | ≈ +5 per 100 | grade D; 0–25 per 100 contains the truth; test sized | no headline; "6 to 16 per 100" misses the truth |
| AI training: misleading mediator name, a collider, reverse causation | +7.5 | +7.55 (7.0–8.1), grade B, all three traps avoided, planted-effect test passed | +7.4 (7.0–7.8), all three traps avoided, no grade |
Assertion pass rate: 100% with the skill vs 50–57% without, at about 2–3 minutes and ~20% more tokens per run. Accuracy on clean cases is similar either way; on the AI-training case both runs avoided every trap, which tells us current frontier models handle well-described traps. The skill's added value there is the checks and the audit trail: the report shows what the answer would have been under each wrong diagram. The difference is honest ranges, abstention, pre-registration, and a report someone can act on.
The foundation-model cross-checks were benchmarked on 14 semi-synthetic datasets (results):
| Average error | 95% range covers truth | Time (CPU, 2–5k rows) | |
|---|---|---|---|
| Doubly robust ML (main) | 5.2% | 14 / 14 | ~4 s |
| CausalPFN | 2.8% | 12 / 14 | ~25–55 s |
| Doubly robust with CausalPFN outcomes | 4.1% | 13 / 14 | ~25–55 s |
CausalPFN was more accurate, especially under poor overlap, but overconfident. That is why the main method stays classical-ML and the foundation models are cross-checks.
Which model to use
| Model | Status |
|---|---|
| Claude Opus 5.5 | Tested. Every evaluation in this repo was run on it. Recommended for real decisions. |
| Other Claude models (Sonnet, Haiku) | Should work, but not yet evaluated. The scripts do the numerical work, but the steps that matter most are judgment calls: spotting post-treatment columns, deciding identification, calibrated wording. Run evals/ before relying on a smaller model. |
Non-Claude agents (e.g. GPT-6 Astra in a tool that reads SKILL.md, or any agent with a shell) | Not tested. SKILL.md is plain Markdown and the toolkit is a Python CLI, so any agent that can read instructions and run Python can drive it. Please share eval results if you try. |
The model matters less for the numbers (they're scripted) and more for knowing when not to trust them. That is where we'd spend on the strongest model available.
Data and privacy
- Everything runs locally by default. No data leaves your machine unless you opt in.
- The report includes the first 5 rows of the data so readers can see what the analysis stood on. For personal or sensitive data, set
"report_sample_rows": 0in the plan. - The hosted TabPFN cross-check sends data to Prior Labs. It runs only when the analysis plan lists
"allow_external_services": ["tabpfn_api"], which the skill sets only after you agree. Its upload also needsapi.priorlabs.aiandstorage.googleapis.comreachable. - API keys are read from
TABPFN_TOKENor a file named byTABPFN_TOKEN_FILE. Never paste keys into chat. - CausalPFN weights (~75 MB) download from Hugging Face on first use, or point
CAUSALPFN_WEIGHTSat a local copy.
Limitations and roadmap
Limitations
- One yes/no or amount action at a time, cross-sectional data. Difference-in-differences, regression discontinuity and multi-valued actions are not automated yet (the skill says so and offers a labelled one-off analysis).
- Hidden confounding can be sized, not removed. Grades B and C still rest on "nothing important is missing". The report says exactly how strong a hidden factor would need to be.
- The diagram is only as good as the answers behind it. If a column's name is misleading and nobody catches it, the diagram, and the answer, will be wrong. The codebook, alternative diagrams and structure check make this less likely, not impossible. The structure check uses linear tests and can miss nonlinear links.
- Front-door identification is detected but not estimated in this version.
- Size: comfortable up to a few hundred thousand rows on a laptop. Larger tables are what the warehouse version (below) is for.
- Tested on synthetic and semi-synthetic data with known answers, plus one benchmark case. Real-world validation is ongoing.
Roadmap
- SQL / warehouse layer: a signed-off analysis becomes a versioned contract. Models are fitted on a schedule in Databricks, Snowflake or ClickHouse, and effects are answered in SQL in seconds, with the trust grade recomputed per query.
- Realistic synthetic datasets for causal inference: a generator for complex, real-world-like scenarios with a known answer. Think hidden drivers, post-treatment traps, weak overlap, effects that vary by group, rollouts over time, and messy data. Use it to test this skill, compare methods, and train people.
- Difference-in-differences and synthetic control for before/after rollouts; regression discontinuity for score cutoffs.
- A proper one-step correction for foundation-model cross-checks (Melnychuk et al., 2026), and GPU support.
- Broader evals, including real-world benchmarks such as CausalReasoningBenchmark.
Repository layout
skills/causal-analyst/     the skill: SKILL.md, scripts/, references/
examples/                  three worked cases: data, brief, spec, results, narrative, report
evals/                     eval scenarios, assertions, benchmark results, foundation-model study
tests/                     smoke test (runs the full pipeline on the examples)
docs/images/               screenshots used in this README
Contributions, especially eval results on other models and new test cases with known answers, are welcome: see CONTRIBUTING.
Credits and licence
Built on DoWhy (identification cross-check), EconML (double ML, causal forests), scikit-learn, statsmodels, and optionally CausalPFN and TabPFN. Methods: Robins, Rotnitzky & Zhao (1994); Chernozhukov et al. (2018); Wager & Athey (2018); Cinelli & Hazlett (2020); Manski (1990); Manski & Pepper (2000); Balazadeh et al. (2025); Hollmann et al. (2025).
See CITATION.cff to cite this project. Licensed under Apache-2.0.
Similar repos
Contributors
8 commits
Languages
Python
100.0%