
README
binary-size-profiler
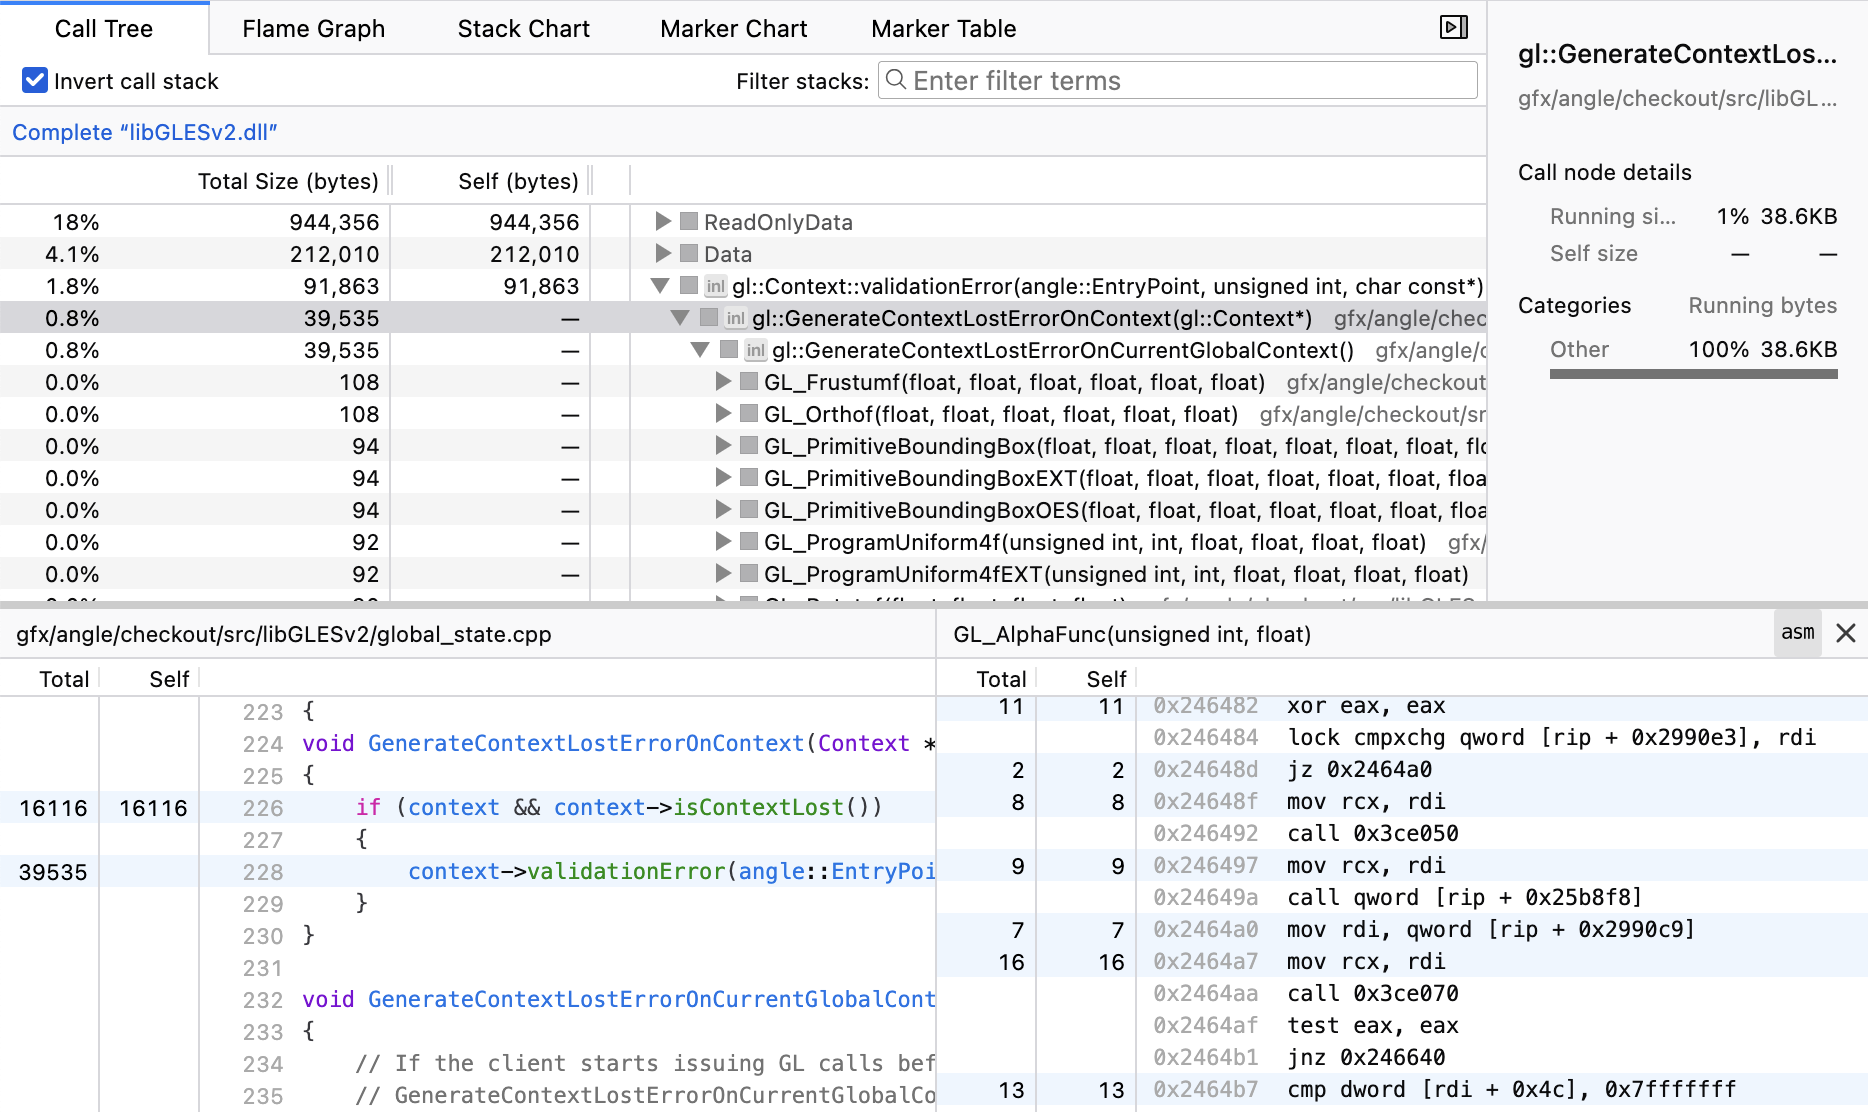
This tool takes a binary and its debug info, and generates a binary size profile.
Example profile: https://share.firefox.dev/3SJx8gs
# Usage:
cargo run --release -- /path/to/binary
samply load output.jslb
This opens the generated profile in https://profiler.firefox.com/.
Install samply as described in its readme. samply is needed for the source view and the assembly view to show your local files.
The profile linked above took 5 seconds to generate on an M1 Max, for a 5.2MB binary with a 16MB breakpad symbol file. The output was a 73.3MB output.json file (9MB gzipped).
Usage with Rust
Debug information is required for useful output. When you use the binary size profiler on a Rust project, compile your project with cargo build --profile profiling and declare a system-wide cargo profile with the name profiling in ~/.cargo/config.toml:
[profile.profiling]
inherits = "release"
debug = true
Then run this tool on your-rust-project/target/profiling/your-binary.
Features
The profile shows information about inlined functions. This means that, in addition to seeing which "outer" functions take the most space, you can see which inlined calls within each outer function take up how much space. This lets you find functions which contribute a lot of binary size by being inlined into lots of different places.
The profile also shows the number of instruction bytes per line of source code. You can see this in the source view, which opens when you double-click a function in the call tree.
You can also see the assembly code of the double-clicked function. There's one caveat: If you open the assembly view for a function which has multiple monomorphized versions with the same name, the assembly view picks one arbitrary monomorphization. Follow PR #5349 for updates on the ability to see all monomorphizations.
The source view and assembly view only work locally, before the profile is uploaded. The shared profile does not contain source code or assembly code. Follow issue #4018 for updates on this.
How does it work?
The profile's "time" axis is the file offset, and a sample's weight is a byte count. The call tree is the nesting of the file's structure: for a Mach-O binary, that's fat archive member → segment → section → source file path → function → inlined calls. Bytes that nothing claims — padding, alignment, regions we don't recognise — are attributed to the enclosing node, so every byte in the file is accounted for somewhere.
Inside __LINKEDIT, which has no sections, we use the load commands to find the
symbol table, string table, code signature, function starts, and the rest.
For a PE binary the nesting is headers or section → source file path → function
→ inlined calls. A section covers its full on-disk range, including the bytes it
takes up only to satisfy FileAlignment, so that padding is attributed to the
section that causes it. The resource section is broken down by resource type,
name, and what the bytes turn out to be: an image's dimensions, and a hash of the
contents. Resources with identical bytes get identical labels, so they collapse
into one node in the inverted call tree with one caller per copy, and anything
with more than one caller is stored more than once in the file. That's worth
having. In a shippable firefox.exe the resources are over half the file and
almost all of that is icons, four pairs of which are exact copies of each other
and cost 66,660 bytes.
The breakdown of text sections uses a brute force approach.
We walk the bytes in the binary one by one, from front to back. For every byte in a text section, we feed the address into addr2line and look at the file + line + inline stack for that address. If the information is different than for the previous address, we emit a sample, with the sample's "weight" being the byte count for the emitted sample.
Known issues
- Hardcoded to the Mozilla symbol server: When looking up debug information, this tool makes a request to symbols.mozilla.org with the binary name and its debug ID. This makes for a nice experience when you run this tool on official Firefox binaries, but it's not very useful for other consumers of this tool.
- Output size: For large binaries, the output JSON can be prohibitively large. For example, this tool cannot handle
xul.dllfrom Firefox, which is 162MB big. It creates over 3GB of JSON, which is too much for the front-end. - Confusing byte counts in the assembly view: To save space in the profile JSON, we don't write down the byte count for every instruction. We only emit a new sample for an instruction address if the function + source information about that address is different from the information for the previous byte. This often makes it look as if one instruction took 20 bytes and the next four instructions took zero bytes each. You need to imagine the 20 bytes being "spread out" over the whole hunk of instructions until the next sample count.
- Coarse attribution for some bytes: the regions we identify outside of text sections are not broken down any further yet. A Mach-O symbol table shows up as a single lump rather than being attributed to individual symbols, and neither PE nor Mach-O attributes read-only data to the function or variable it belongs to. For PE in particular,
.pdataand the unwind info it points at are per-function by construction and could be charged to those functions, but aren't yet. For ELF we only break down by section, so anything outside a section is unattributed.
License
Licensed under either of
- Apache License, Version 2.0 (
LICENSE-APACHEor http://www.apache.org/licenses/LICENSE-2.0) - MIT license (
LICENSE-MITor http://opensource.org/licenses/MIT)
at your option.
Unless you explicitly state otherwise, any contribution intentionally submitted for inclusion in the work by you, as defined in the Apache-2.0 license, shall be dual licensed as above, without any additional terms or conditions.



Similar repos


Languages
Rust
100.0%
README
binary-size-profiler
This tool takes a binary and its debug info, and generates a binary size profile.
Example profile: https://share.firefox.dev/3SJx8gs
# Usage:
cargo run --release -- /path/to/binary
samply load output.jslb
This opens the generated profile in https://profiler.firefox.com/.
Install samply as described in its readme. samply is needed for the source view and the assembly view to show your local files.
The profile linked above took 5 seconds to generate on an M1 Max, for a 5.2MB binary with a 16MB breakpad symbol file. The output was a 73.3MB output.json file (9MB gzipped).
Usage with Rust
Debug information is required for useful output. When you use the binary size profiler on a Rust project, compile your project with cargo build --profile profiling and declare a system-wide cargo profile with the name profiling in ~/.cargo/config.toml:
[profile.profiling]
inherits = "release"
debug = true
Then run this tool on your-rust-project/target/profiling/your-binary.
Features
The profile shows information about inlined functions. This means that, in addition to seeing which "outer" functions take the most space, you can see which inlined calls within each outer function take up how much space. This lets you find functions which contribute a lot of binary size by being inlined into lots of different places.
The profile also shows the number of instruction bytes per line of source code. You can see this in the source view, which opens when you double-click a function in the call tree.
You can also see the assembly code of the double-clicked function. There's one caveat: If you open the assembly view for a function which has multiple monomorphized versions with the same name, the assembly view picks one arbitrary monomorphization. Follow PR #5349 for updates on the ability to see all monomorphizations.
The source view and assembly view only work locally, before the profile is uploaded. The shared profile does not contain source code or assembly code. Follow issue #4018 for updates on this.
How does it work?
The profile's "time" axis is the file offset, and a sample's weight is a byte count. The call tree is the nesting of the file's structure: for a Mach-O binary, that's fat archive member → segment → section → source file path → function → inlined calls. Bytes that nothing claims — padding, alignment, regions we don't recognise — are attributed to the enclosing node, so every byte in the file is accounted for somewhere.
Inside __LINKEDIT, which has no sections, we use the load commands to find the
symbol table, string table, code signature, function starts, and the rest.
For a PE binary the nesting is headers or section → source file path → function
→ inlined calls. A section covers its full on-disk range, including the bytes it
takes up only to satisfy FileAlignment, so that padding is attributed to the
section that causes it. The resource section is broken down by resource type,
name, and what the bytes turn out to be: an image's dimensions, and a hash of the
contents. Resources with identical bytes get identical labels, so they collapse
into one node in the inverted call tree with one caller per copy, and anything
with more than one caller is stored more than once in the file. That's worth
having. In a shippable firefox.exe the resources are over half the file and
almost all of that is icons, four pairs of which are exact copies of each other
and cost 66,660 bytes.
The breakdown of text sections uses a brute force approach.
We walk the bytes in the binary one by one, from front to back. For every byte in a text section, we feed the address into addr2line and look at the file + line + inline stack for that address. If the information is different than for the previous address, we emit a sample, with the sample's "weight" being the byte count for the emitted sample.
Known issues
- Hardcoded to the Mozilla symbol server: When looking up debug information, this tool makes a request to symbols.mozilla.org with the binary name and its debug ID. This makes for a nice experience when you run this tool on official Firefox binaries, but it's not very useful for other consumers of this tool.
- Output size: For large binaries, the output JSON can be prohibitively large. For example, this tool cannot handle
xul.dllfrom Firefox, which is 162MB big. It creates over 3GB of JSON, which is too much for the front-end. - Confusing byte counts in the assembly view: To save space in the profile JSON, we don't write down the byte count for every instruction. We only emit a new sample for an instruction address if the function + source information about that address is different from the information for the previous byte. This often makes it look as if one instruction took 20 bytes and the next four instructions took zero bytes each. You need to imagine the 20 bytes being "spread out" over the whole hunk of instructions until the next sample count.
- Coarse attribution for some bytes: the regions we identify outside of text sections are not broken down any further yet. A Mach-O symbol table shows up as a single lump rather than being attributed to individual symbols, and neither PE nor Mach-O attributes read-only data to the function or variable it belongs to. For PE in particular,
.pdataand the unwind info it points at are per-function by construction and could be charged to those functions, but aren't yet. For ELF we only break down by section, so anything outside a section is unattributed.
License
Licensed under either of
- Apache License, Version 2.0 (
LICENSE-APACHEor http://www.apache.org/licenses/LICENSE-2.0) - MIT license (
LICENSE-MITor http://opensource.org/licenses/MIT)
at your option.
Unless you explicitly state otherwise, any contribution intentionally submitted for inclusion in the work by you, as defined in the Apache-2.0 license, shall be dual licensed as above, without any additional terms or conditions.
Similar repos
Languages
Rust
100.0%